Do things seem to be slowing down?
Hey, it’s December. Things always slow down.
We have had 5 years of a recovering market. We are do for a respite.
In the past, real estate markets seemed to follow a 5-year pattern. But after what we have been through, that may no longer be true.
What is going on now?
That’s the reason for this mid-month blog. I want to point out that there may be some changes underway. Or maybe not.
Graphs can be useful, because you can visually spot trends. I think there may be a trend going on that I do not yet see in the charts.
So today, no charts, only the numbers.
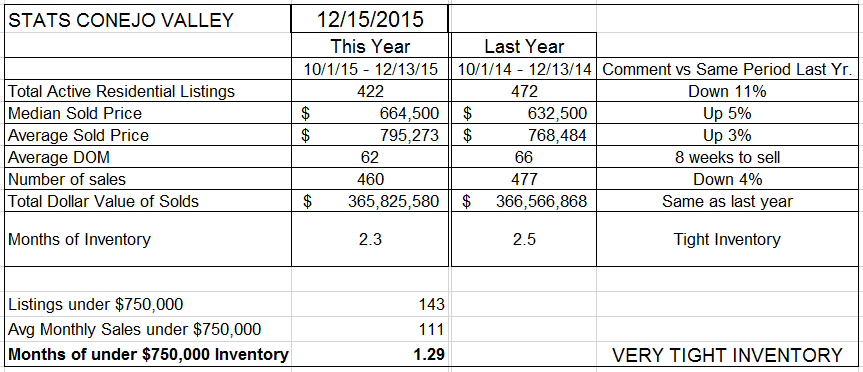
Listings down 11%. That is no change, they have been below last year consistently.
Prices up 3-5%. Consistent for the year.
Number of sales down 4%. There is the change I am talking about. We have experienced sales beating last year consistently. Suddenly they are lower than last year. This is for the 10-week period going back to the beginning of October, compared to the same period last year. By using this smaller sample size, rather than the entire year-to-date versus last year, we should be able to spot trends more quickly, without the dilution that happens when you consider an entire year’s worth of data.
Now to consider why sales numbers are lower. Interest rates are the same. Prices have not gone crazy. One culprit may be the inventory. Only 10 weeks worth in total, only 5 weeks worth for homes priced below $750,000. That may be the culprit.
Let’s look at the same information for Simi Valley and Moorpark.
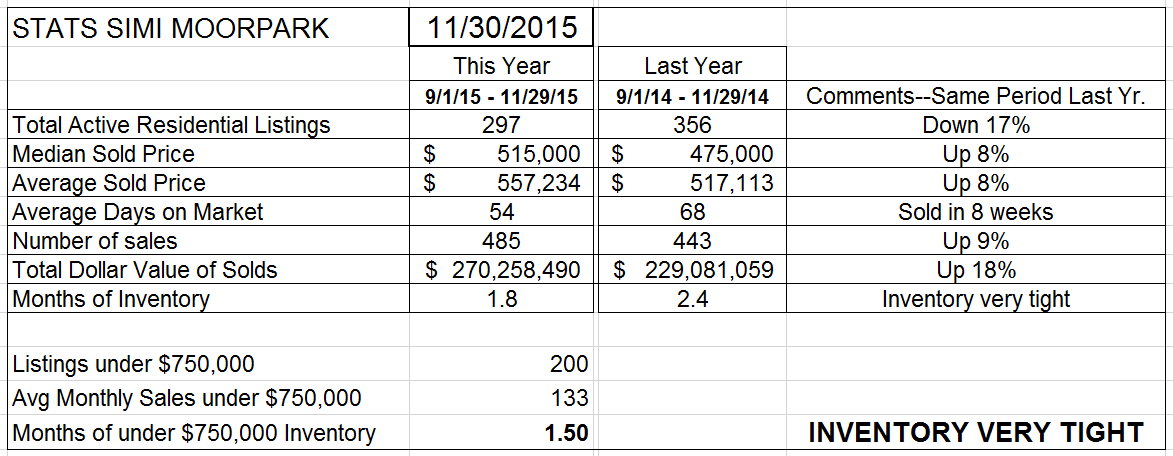
As measured by months of supply, both areas are in an extremely tight inventory position. At this time of the year, we normally see inventory very low.
Inventory is down 17% (versus 11% for Conejo), prices are up 8% (versus 4% for Conejo) and number of sales up 9% (versus 4% lower for Conejo).
The number of sales is the biggest difference between the two areas. Conejo is troublesome, with a 4% decline.
CAR’s forecast is for a 6.3% increase this year, and the same for 2016. That forecast was made two months ago. Here is a forecasting hint. You can always look smarter the closer you come to the actual period forecasted. For example, I can be 100% accurate when forecasting yesterday’s weather today.
For now, we will watch and see. Dilbeck has 14 offices in different areas of Southern California, and they do not all react the same way at the same time. You can see that in your farms. One year, 15 homes sell, the next year, only 4. The real estate market is irregular, year to year. But if you take a big enough sample, it all evens out, and seems regular.
Enjoy the holiday season, it is a wonderful time to keep in touch with your clients. They become friends. That’s one of the benefits of our business. We really get to know our clients, and this time of the year we need to contact our friends.
Happy Holidays.
Chuck