From President Obama’s 2016 State of the Union Address.
“Let me start with the economy and a basic fact. The United States of America, right now, has the strongest, most durable economy in the world. We’re in the middle of the longest streak of private-sector job creation in history. More than 14 million new jobs, the strongest two years of job growth since the 1990s, an unemployment rate cut in half. Our auto industry just had its best year ever.
That’s just part of a manufacturing surge that’s created nearly 900,000 new jobs in the past six years. And we’ve done all this while cutting our deficits by almost three-quarters.” President Obama
In our area, the state of the real estate market remains healthy. Chuck Lech
I don’t get as much press as the President, but that means I don’t get criticized by the other party when my presentation is over. Or maybe I do. I actually would be very happy to get comments back from you. I make a guess on what I think is going on, but your guess is probably better than mine.
For my posts this year, I decided not to compare full year to full year data, as using the entire year tends to average out the data, and we have seasonality built into our industry. These figures still compare year against year, but only for the final quarter of 2014 versus the final three months of 2015.
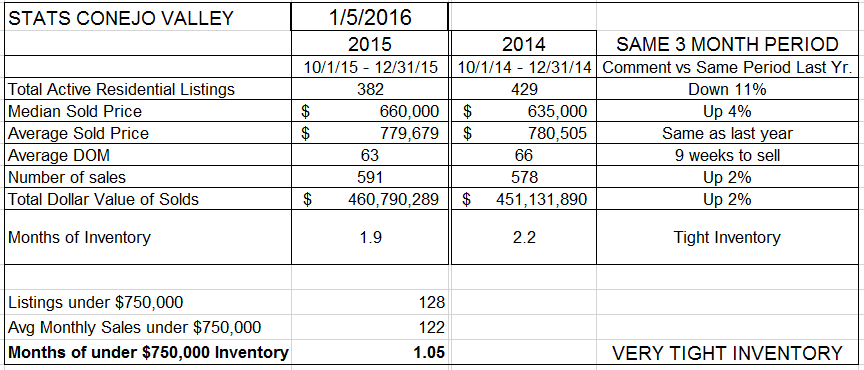
Comparing the final quarter of 2015 with the final quarter of 2014, the inventory at the end of the year dropped 11%. Inventory is tight with less than two months of sales, and for homes priced below $750,000, extremely tight with only one month. For the entire U.S. market, people often describe 6 months as a normal inventory, not favoring either buyer or seller. With our coastal location, I think our normal inventory should be more in the area of 3-4 months. No matter which one you choose, there is extremely little inventory available.
Median prices are up 4% compared to the final quarter of last year, and average prices even with last year. This difference is caused by the percentage of high priced homes. The more high priced homes we sell (7 figure prices) the more the average price goes up compared to the median. When the average price is below the median, it means there was less influence from the high priced homes. That was the case for the last quarter.
The number of transactions is up 2%. In July, the increase was 14%.
We are seeing business level off, and price increases level off. Both were up in the middle of the year, then came down at the end of the year.
But that is what has happened. What is going to happen? If I knew that, I would buy a Powerball ticket for tonight. One of the most positive influences on price is the inventory. Even though sales leveled off, when compared against the inventory, this portends a price increase in the making. Business remains good in our market, we have avoided any terrorist events locally, interest rates remain extremely attractive, and we have more people who want to move here than we have homes available.
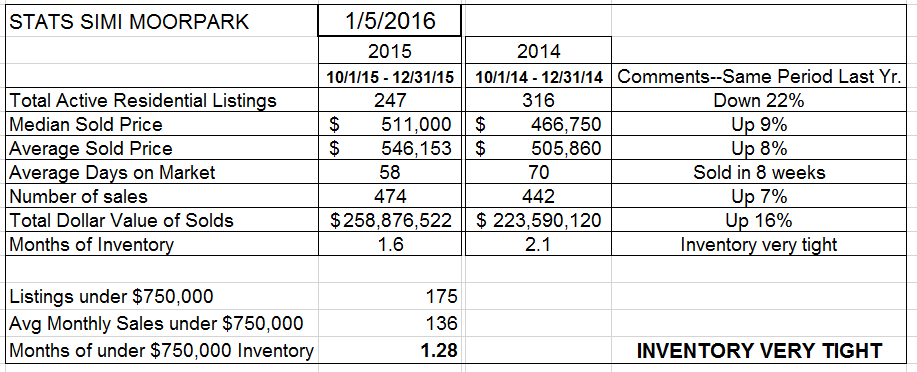
Simi Valley and Moorpark show some similar, some dissimilar forces. Inventory is very tight in all locations. While the Conejo inventory decreased 11%, Simi/Moorpark decreased 22% from the end of last year. The number of sales are up 7%, versus 2% in Conejo. Both Median and Average prices are up 8-9% versus the same end-of-year quarter in 2014. This is a very strong market, due to strong sales and low inventory. Prices should push upwards.
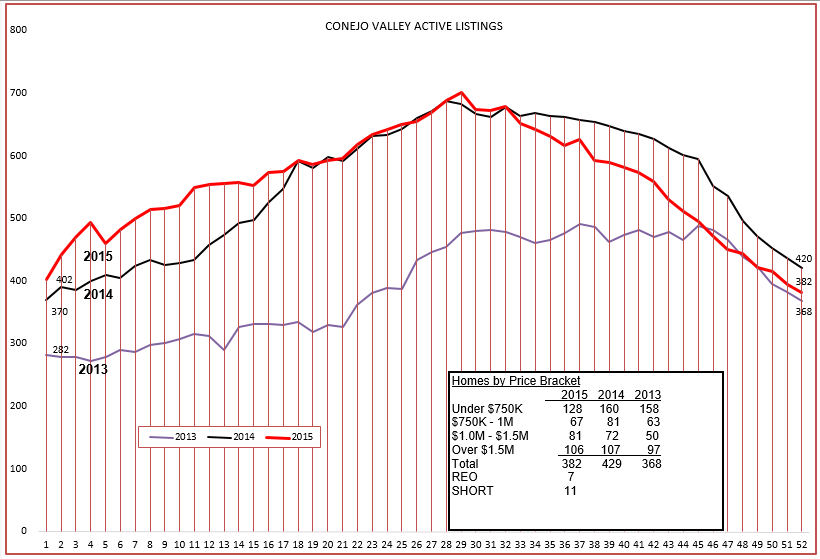
The inventory figures for Conejo indicate no problems, a normal seasonal curve, and very little trouble inventory.
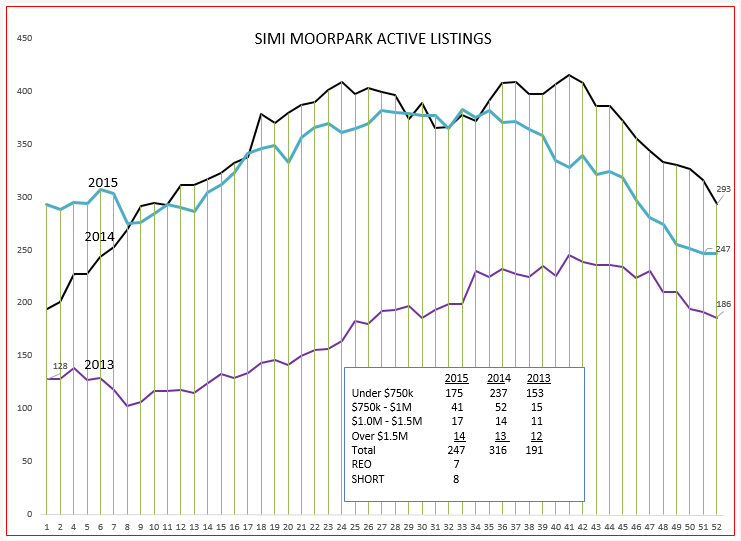
The inventory for Simi/Moorpark did not follow the expected normal curve, and finished the year with very little inventory. Financially troubled inventory, REOs and Short Sales, remain minimal.
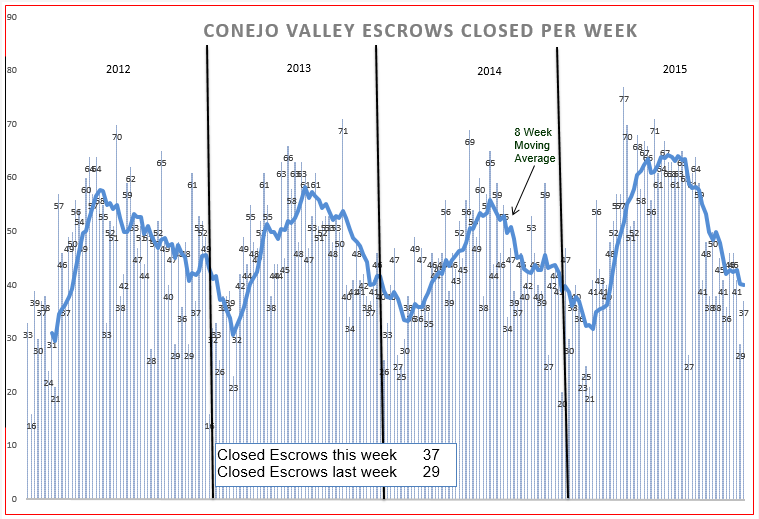
Sales for Conejo showed strength all year with a very busy simmer. Last year peaked as all the years peak, but then kept that peak going for an extended time period. A very good summer, but returning to a normal, average end of year.
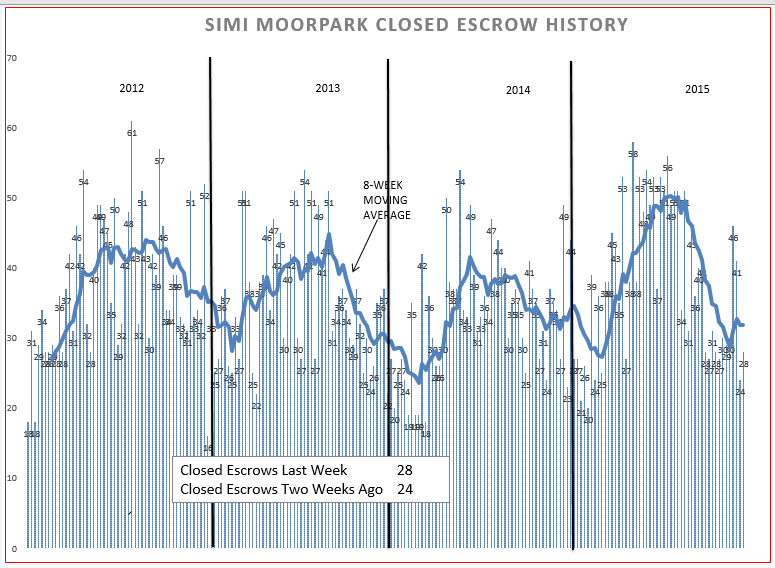
The Simi/Moorpark chart shows the market strength during the summer, beginning with a high level of activity and ending the same way.
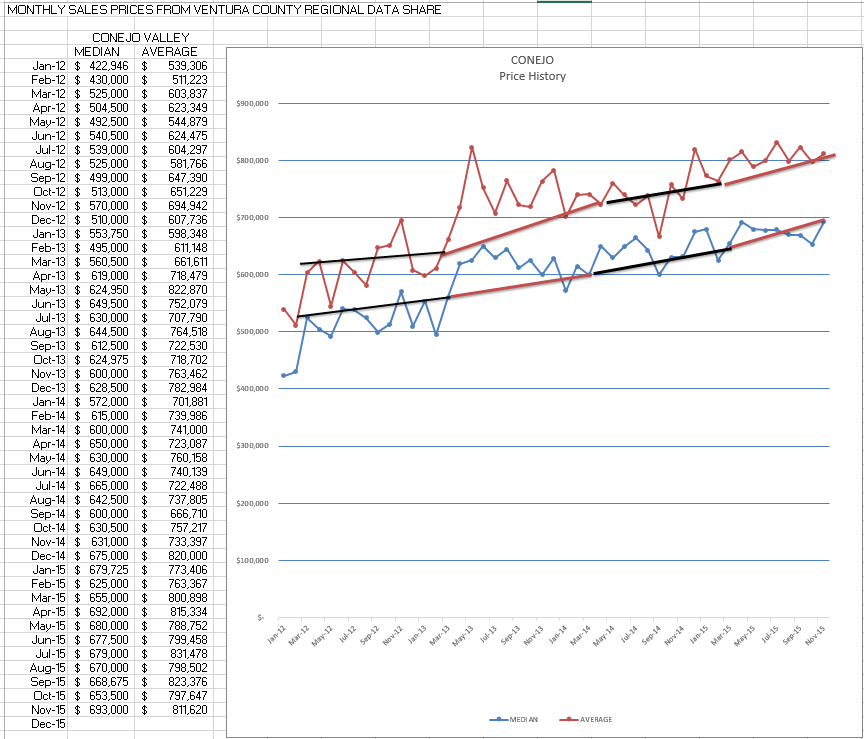
Look at the changes in median and average prices to the left of the chart above. Lots of up and down movement, no straight lines here. Median prices over the past four years, from January 2012 to December 2015, began with $423,000 and ended at $700,000, an increase of 65%, an excellent recovery. Average prices began with $540,000 and ended at $810,000, an increase of 50% over 4 years.
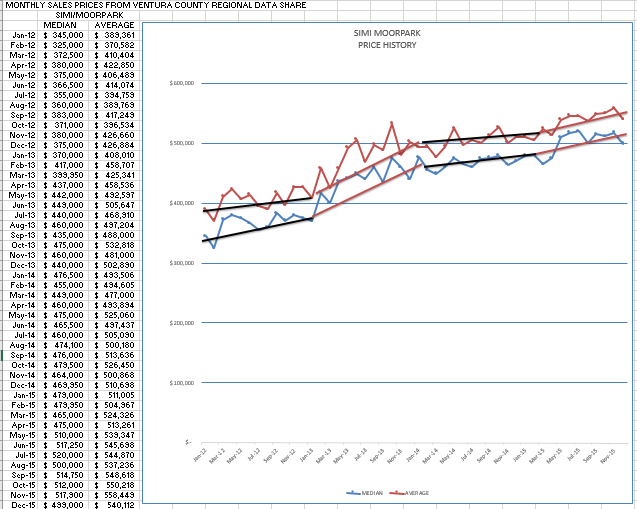
Look at the changes in median and average prices to the left of the chart above. Lots of up and down movement, no straight lines here. Median prices over the past four years, from January 2012 to December 2015, began with $345,000 and ended at $500,000, an increase of 45%, a very good recovery. Average prices began with $390,000 and ended at $540,000, an increase of 40% over 4 years. Simi/Moorpark had more inventory involved in short sales and REOs, and is currently enjoying stronger price appreciation that it did not experience earlier.
Finally, let’s look at the number of sales going back in time to 2004, and see how our current volume compares to those wild years.
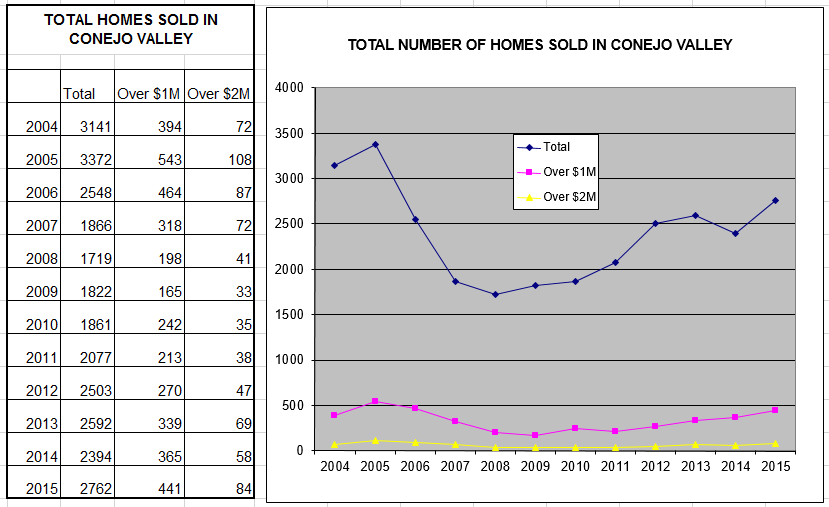
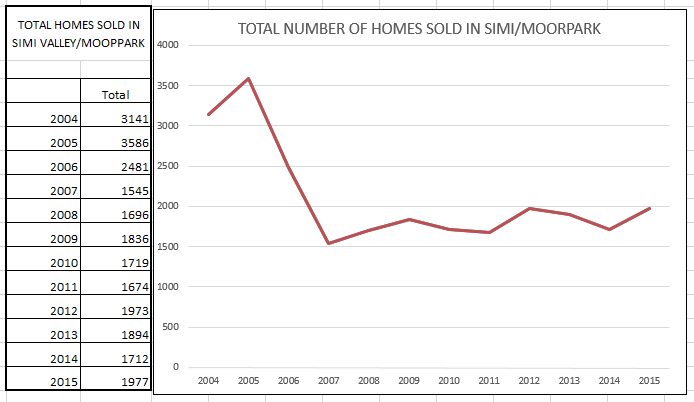
Comparing the earlier sections of both charts, the Simi/Moorpark market was on fire, selling probably more homes than should have been sold. With a large inventory of short sales and REOs, the number of annual sales did not increase to the level in Conejo. Then again, who is to say what the appropriate number of sales should be?
In both areas, the market is strong. And 2016 should continue that strength.
Chuck