As far as real estate in the Conejo, Moorpark, and Simi Valleys, it all depends on where you are standing.
Let’s begin by looking at the overall statistics for Conejo Valley. You can get different answers depending on which range of dates you use. I have been using the current three month history, and comparing it to the same dates from a year ago. Hopefully this takes the seasonality out of the comparison, and is not affected by averaging a large quantity of data over the span of an entire year. Real estate is not a business with consistent day to day volume, so we have to take a larger sample of time to get reasonable data. Three months seems just about right.
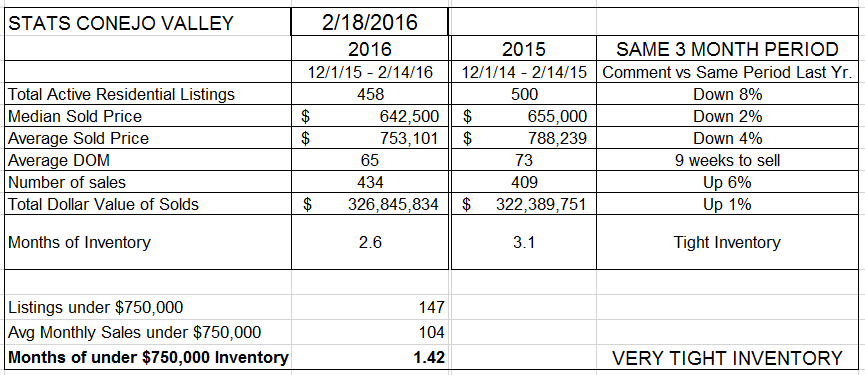
The first thing that you notice is the DOWN areas. The number of listings are down 8%. The number of sales are up 6%. When inventory is low and demand is high, we expect prices to increase. However, the median price is down 2% for this period, the average sold price is down 4%. This has to be an anomaly, it cannot continue. We are seeing multiple offers in all sales, particularly those in the lower price ranges. As these close escrow, we should be reporting higher prices in the future. But these figures certainly give you pause to think about just what may be going on. Most published comparisons point out that prices increased year over year. We will have to watch this one more closely.
Simi/Moorpark is a different story.
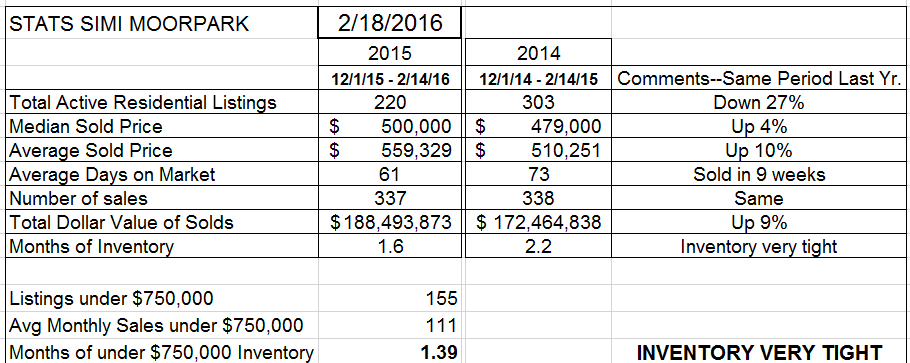
Inventory is down a whopping 27% from a year ago, while the number of sales is the same as last year. Should prices go up? Yes, and they have, 4% higher median price and 10% higher average price. (The average price is more affected by the mix of houses, in this case a higher percentage of higher priced homes being sold.) The months of inventory in Simi/Moorpark remains extremely low, and going lower, as shown in this chart of inventory available for sale.
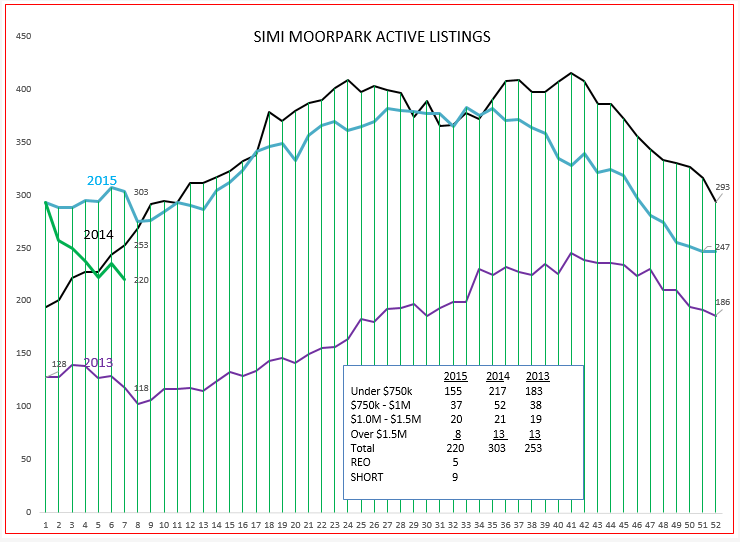
Sales (closed escrows) are comparable to the same period last year. The inventory can decrease because 1) new listings are not coming onto the market or 2) homes are selling like hotcakes. The second condition appears to be the real reason. There is a sweet spot of affordability in Simi/Moorpark, and $500,000 median-priced homes are much in demand. Look at the box within the graph and see what has been happening to all the price categories, but particularly the Under-$750,000 category.
Conejo has a wider price range of homes, but the same is true on the lower end.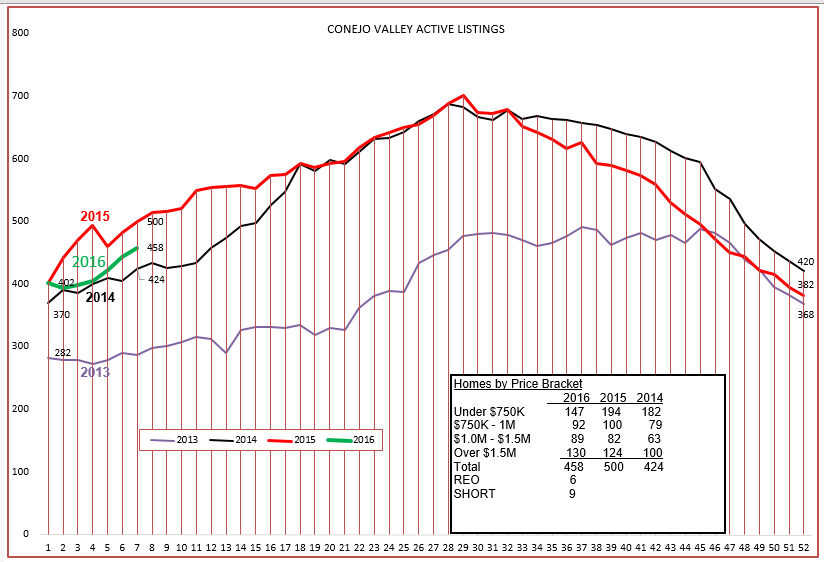
The overall inventory in Conejo is rising, as we expect, but look at the box within the chart and compare the Under-$750,000 inventory over the past three years. Again, those homes are going like hotcakes. It seems that the higher priced inventory is moving more slowly, while the lower priced inventory is moving quickly. Some economists have opined that this situation will continue, that the high priced inventory is taking a break.
Sales as measure by closed escrows are performing about as expected for this time of year.
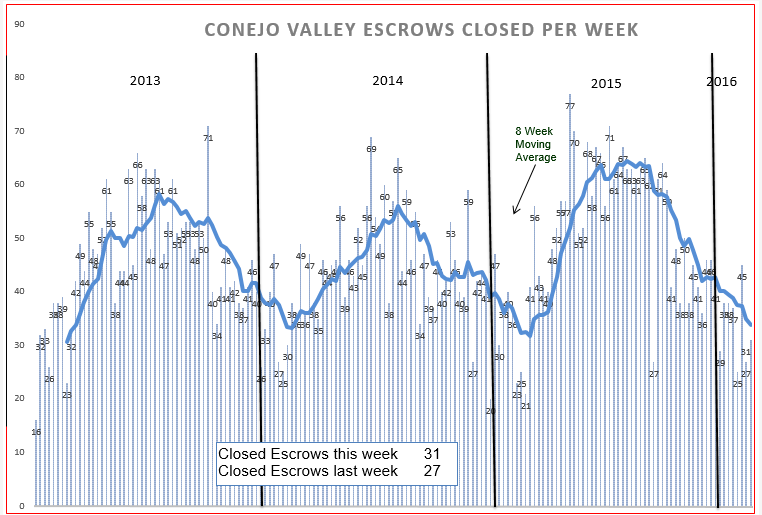
The 8-week moving average line historically turns upwards around this time of the year. Again, something to watch closely in the coming weeks.
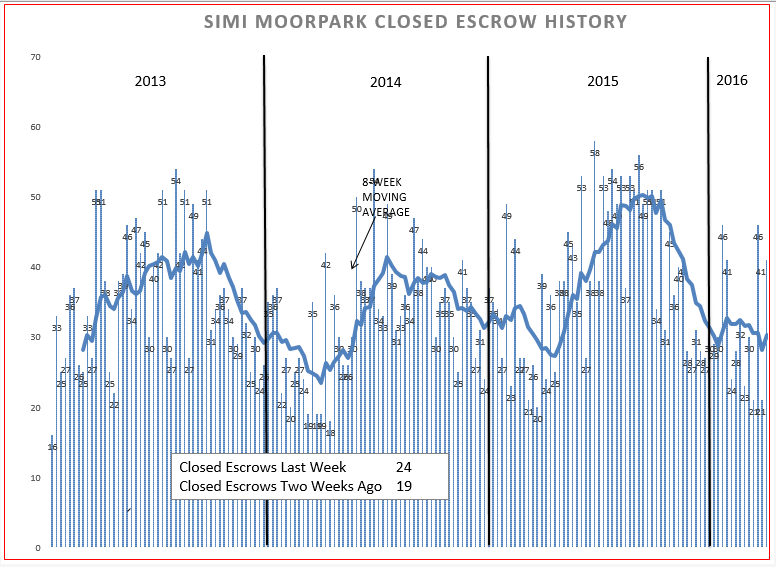
Simi Moorpark is following the pattern of the past two years. It is a somewhat strange pattern, with alternating weeks of high sales and low sales (closed escrows). As I said earlier, real estate is not a business that is consistent day to day, but the above points out it is not even consistent week to week. Simi Moorpark is tracking as expected, Conejo, on the other hand, ………………..
Finally let’s look at the chart of prices over the past three years.
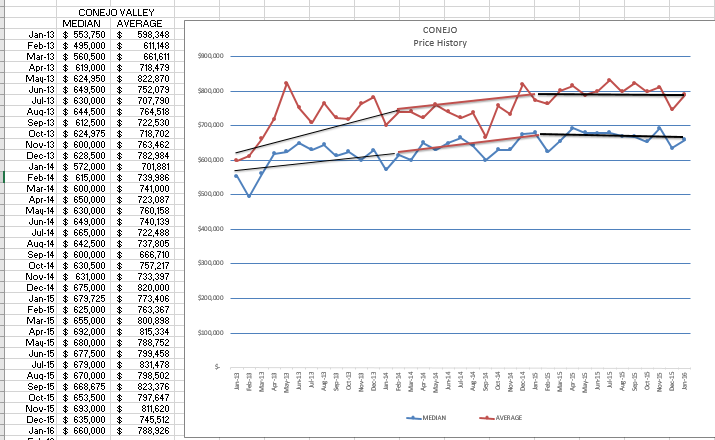
The chart for Conejo prices graphically shows what the numbers have been telling us, that prices have decreased a little (2%). Again, nothing to worry about, but certainly different information than what I would have expected.

For Simi Moorpark, the chart graphically shows the price increases being recorded in the statistics page above. 2013 was a strong year for price increases, and when you look at the inventory figures for 2013, and for 2016 we expect strong pricing pressure as the year progresses.
Look at the previous posting on this blog to see a unique way of looking at the decision to buy or rent.
Have a prosperous week.
Chuck