Our celebrations today involve the ability to down copious amounts of ice cream and candy, all given up for lent. No headaches, unless you consume the ice cream too quickly.
This post is a couple of weeks early. I wanted to do an early dissemination of information. I will be on vacation at the end of the month, and did not want you to have to wait for this.
The market is behaving questionably. Surely the stock market has been questionable, but now the Conejo market is becoming more of a puzzle. The Simi/Moorpark is behaving more as expected.
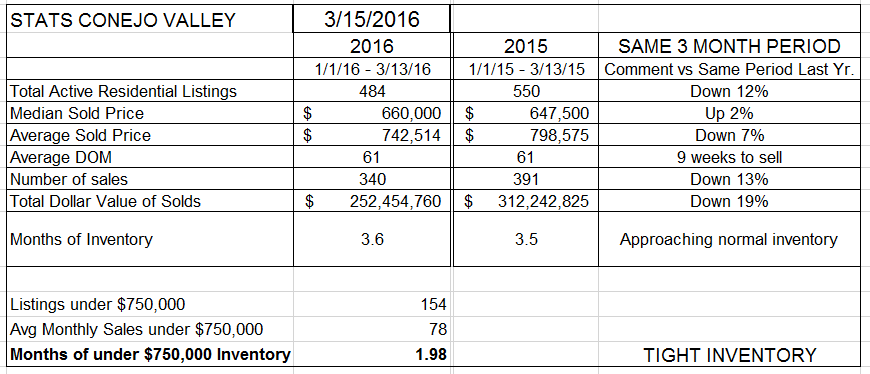
Active listings are down 12% from last year. The median price is up 2%, but the average price is down 7%. The mix of homes sold is more heavily populated by lower priced homes. Higher priced homes are still selling, but not as well as last year. Overall, we are at 3-1/2 months of inventory based on current sales, about where we were last year. However, we have less inventory and lower sales. The months of inventory figure has been climbing, and the total number of sales versus last year is down 13%, not what we like to see. Total inventory is down 12%, and the combination of lower prices and lower sales means that total dollars sold is down almost 20%.
Overall, a balanced market. But for homes in the lower category of prices, with only a 2-month supply, sales are strong, inventory low, and multiple offers the norm. Let’s look at how the inventory shapes up compared to the last few years.
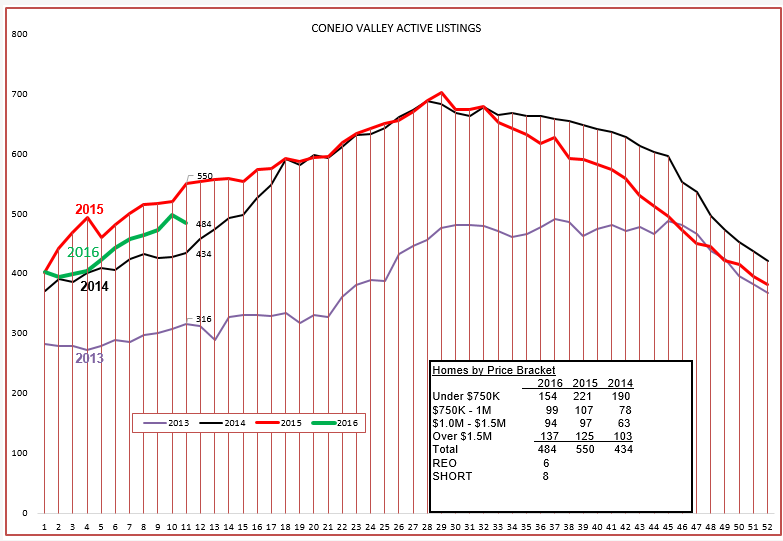
The overall inventory graph is sandwiched between 2014 and 2015. We had a very low inventory in 2013, resulting in strong price increases and most likely restricting the number of homes sold. Look at the price brackets in the box above. The under $750,000 inventory is declining, while the over $1 million inventory number is climbing. In order to judge how the inventory is doing, you have to compare the number of actives versus the number of solds in that same price category. That is why the inventory is growing in the higher priced homes, because they are selling more slowly that previously. Let’s look at the chart of closed sales and see how it is reacting at this point in the year compared to the last couple of years.
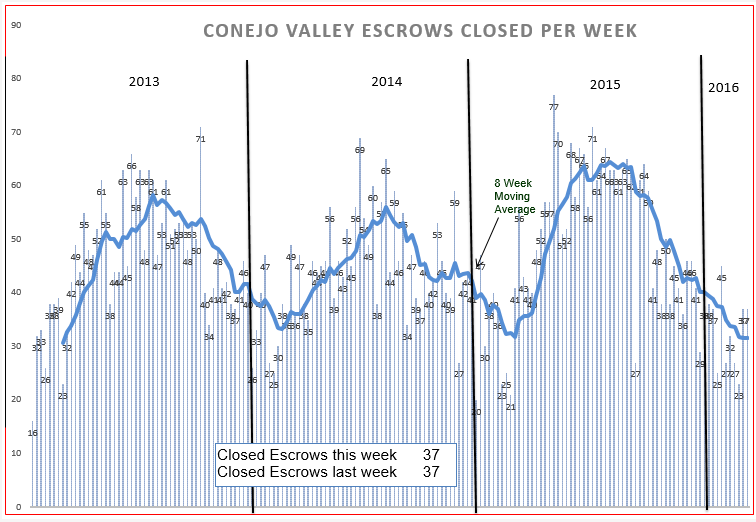
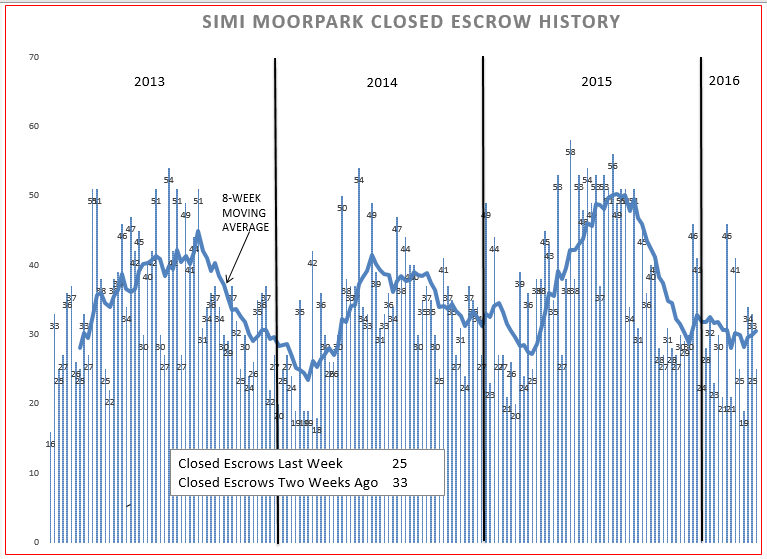
The lack of strength (number of sales down 13%) is expected to change upwards due to the usual spring upturn in the market. We will watch closely to see if that is happening. The 8-week average is trying to turn around. Let’s hope it does.
SIMI VALLEY/MOORPARK
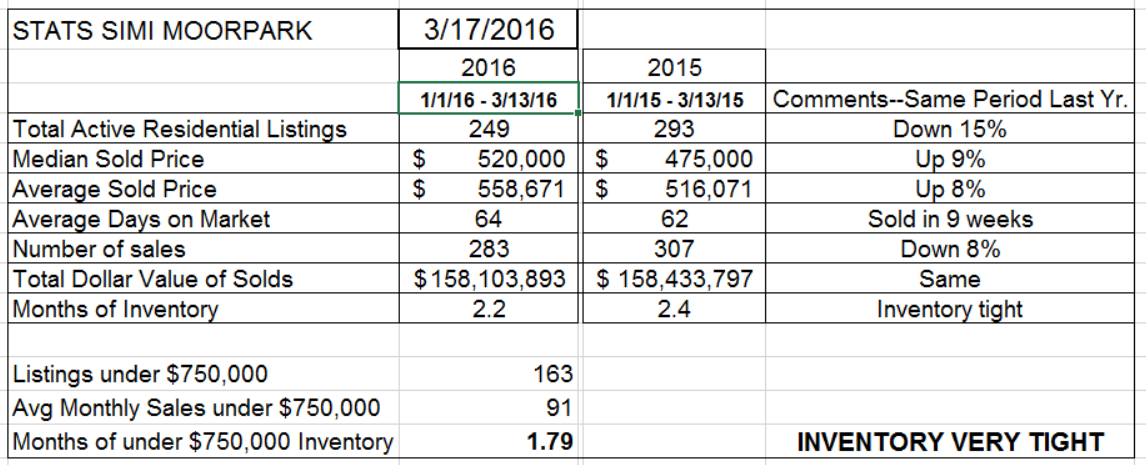
A better picture, but sales are still down 8% compared to the same 12 weeks of last year. Inventory is down, and very tight in the under $750,000 category, down 15% from last year. Prices are up about 8%, as most of the sales tend to be in the $500,000 – $750,000 category.
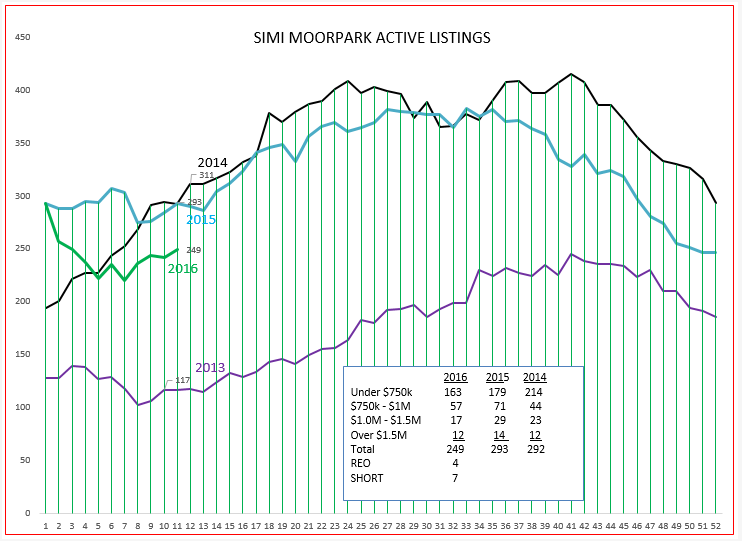
The inventory graph is behaving very similar to 2015, and 2015 was a very abnormal graph. Usually this graph is more like the 2014 graph. Increases in pricing have taken place, about 8% over last year, but the inventory remains reasonable compared to the extreme inventory shortage of 2013. But this overall inventory number should be further defined. Look at the numbers in the box above, and you will see the direction of the inventory in the Under $750,000 category is heading lower. Basically a good solid market driven by minimal inventory and reasonably strong demand. The number of sales to date is 8% lower than that experience last year. Is this due to a shortage of inventory or a slackening of demand? Please let me know your thoughts. Finally, let’s look at the Closed Escrows chart.
From where I sit, Simi/Moorpark sales look to continue strong, with inventory lower and driving higher prices.
Have a prosperous week, and Happy St. Patty’s Day.
Chuck