Halloween is the perfect time to look back and review the year thus far.
I went to the Reagan Library last week with some friends from Chicago. It was interesting to see a chart documenting how things changed during Reagan’s time in office,. From 1981 to 1989, the mortgage interest rate dropped from 15.4% to 10.3%, a far cry from today’s under 4% number. The other interesting number was the Dow Jones Industrial Average. It rose from 970 to 2,235. Yesterday it went up almost 400 points. What a difference.
How about tour local real estate market in 2016? Was it a trick, or was it a treat?
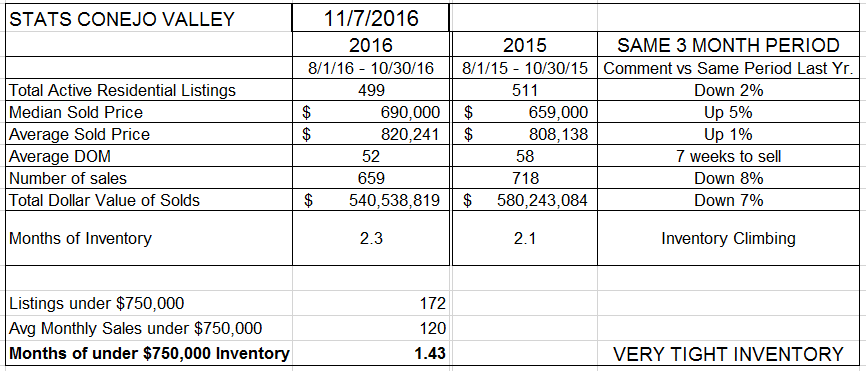
For the Conejo Valley, the number of sales was down 8% compared to last year (the same three month period as last year). The active inventory is only 2% lower than last year, after spending much of the year significantly lower than the previous year. Median Prices were up 5%, while Average Prices were up only 1%. We theorized at the beginning of the year that the low inventory might affect sales, but if that occurred, the low inventory should have also seen prices rise significantly. 5% is a good number, but not a number that displays a bubble caused by a significant lack of inventory. And the months worth of inventory figure has climbed to 2.3 months. This metric is a combination of the inventory available divided by the amount of sales taking place. An inventory figure all by itself is like getting the score of a ball game, Cubs 5. You need to know both sides to make sense of the number. We had a good year, not as good as last year, but a good year.
2.3 months of inventory seems to be the new normal a balanced market, one favoring neither buyers nor sellers. That is a lot lower than most of us would have described as a normal inventory a few years ago. Like I said, it is the new normal.

In Simi Valley and Moorpark, the number of sales decreased only 5% from the year prior (the prior 3 months 2016 versus the same 3 months 2016). Median and Average prices were up 2% and 1% respectively, and the number of sales was down 5% from the previous period. Sales in Simi/Moorpark do not feel the influence of a large range of home prices, with most being in the half-million dollar range. That inventory is very low, and has been all year, yet it has not resulted in a pricing bubble. The market has stayed very sane.
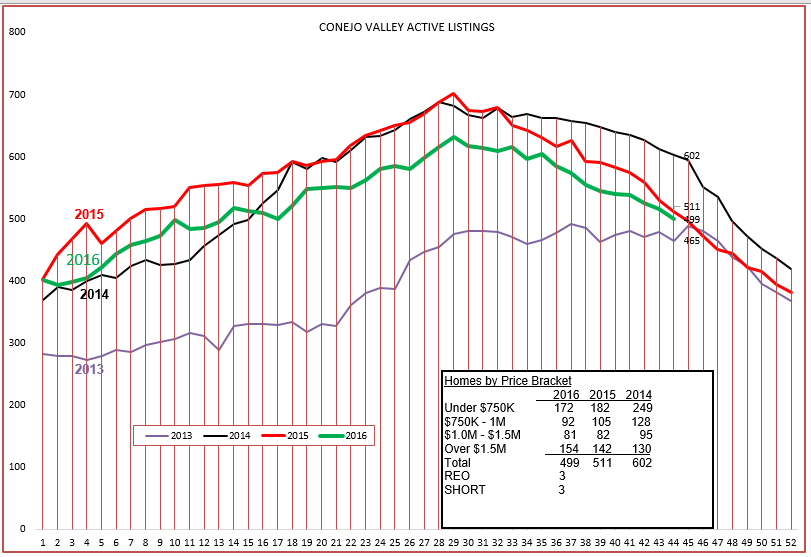
The inventory in Conejo is amazingly consistent as we approach the fall and winter seasons. Looking at the inset box, the lower price ranges continue to show lower inventories, while the highest price category shows a growth of inventory compared to past years. Reporting on REOs and Short Sales is basically insignificant, and we all hope it stays that way.
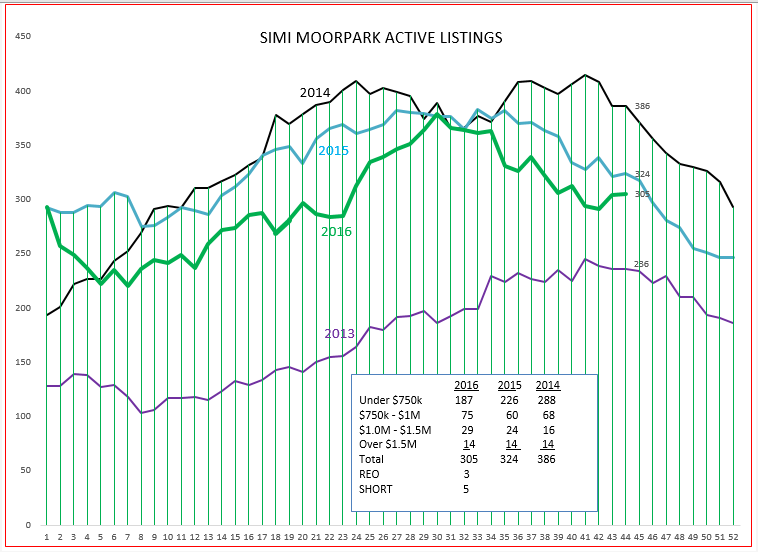
The inventory in Simi/Moorpark has been up and down week-to-week, following the overall pattern of 2015 but with fewer sales and lower inventory. The extremely low inventory of 2013 resulted in very strong pricing pressure, but that has not occurred the past three years. We can be happy about that. No one wants to see the type of wild swings we saw that resulted in the big bubble of the first decade of this century. Slow and steady is good.
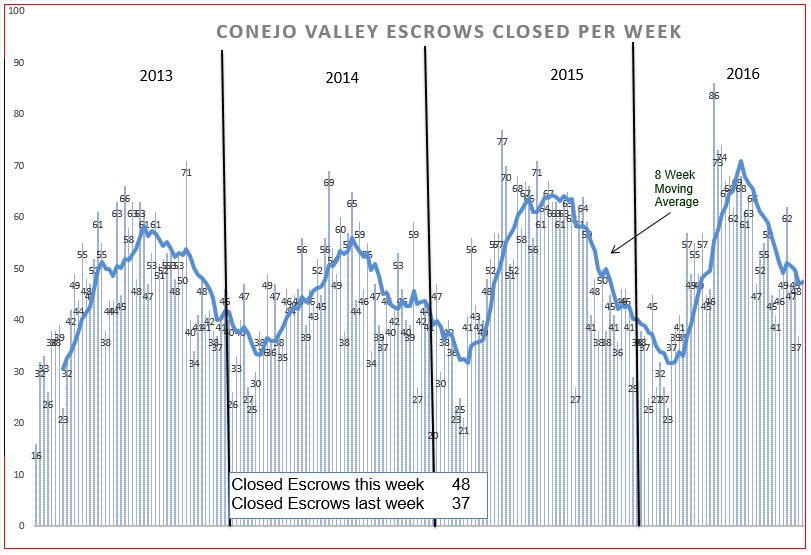
The number of sales is down 8% versus last year. Sometimes we can see things more clearly in a graph, sometimes the actual number makes more sense, as this number does. Conejo started out the year slower than last year, reaching a sharp peak during the summer rather than the sustained plateau of 2015. Overall, down 8%.
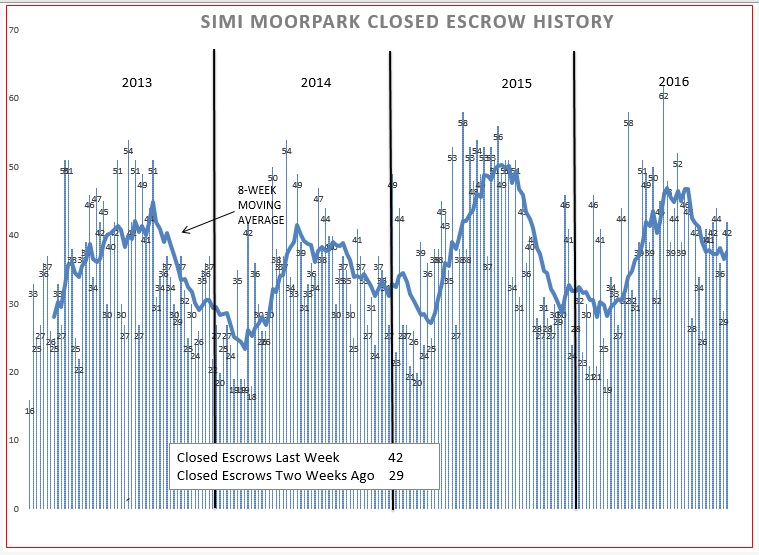
Simi/Moorpark numbers are down 5% for the year, and here again the number is more significant than what the graph tells us. The end of 2015 shows a steep slide in business, but 2016 looks very strong as we are ending the year. Hence, numbers are down 5%, and that number may go down as we hit year end.
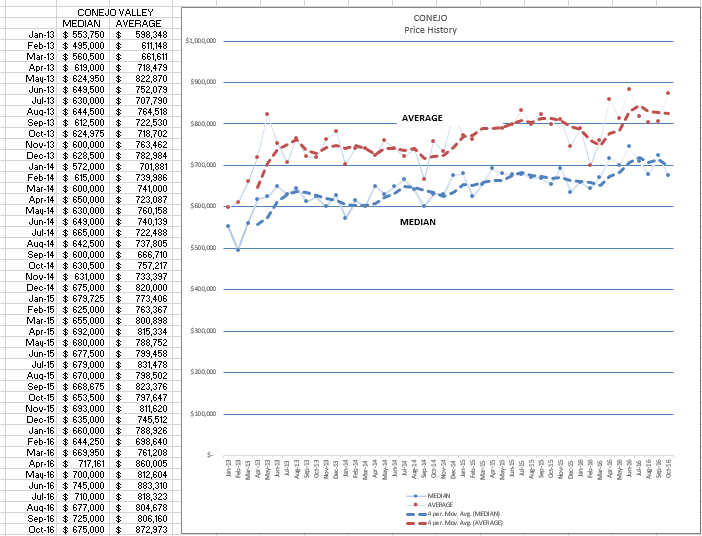
Finally, let’s look at pricing. In Conejo, this is strongly affected by the presence or absence of high dollar properties. There does seem to be a cycle during the year, stronger in the summer months and weakening as we head to year end.
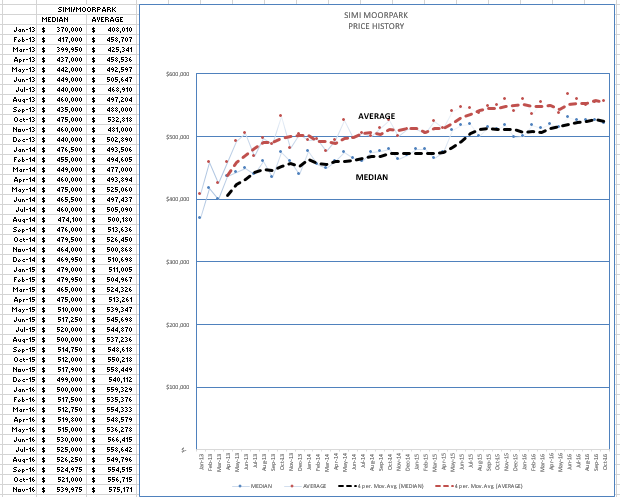
For Simi, the graph is much more controlled, much more regular, due to the predominance of half-million dollar properties. And we can see the cyclic influence as the year progresses.
So what to tell your clients?
The market continues to be active. Prices may change as we go through the yearly cycle. Remember that both buyers and sellers face the same issues. The best time to buy may not be the best time to sell. and vice versa. For people who own a home, pay attention to value more than trying to hit the right point to buy or sell. Buy the home of your dreams when it becomes available. A year or two from now you will be glad you did.