We just experienced Thanksgiving, and this year has provided much to be thankful for. Now we approach the end of the year, and we plan and work and hope for next year to be even better.
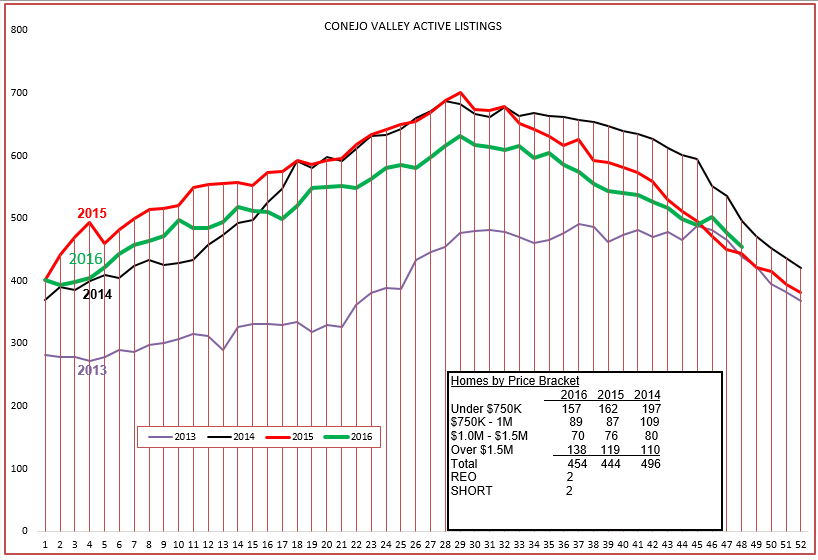
As we approach year end, we expect inventory and sales to decrease. Inventories are right on track. Almost perfectly on track.
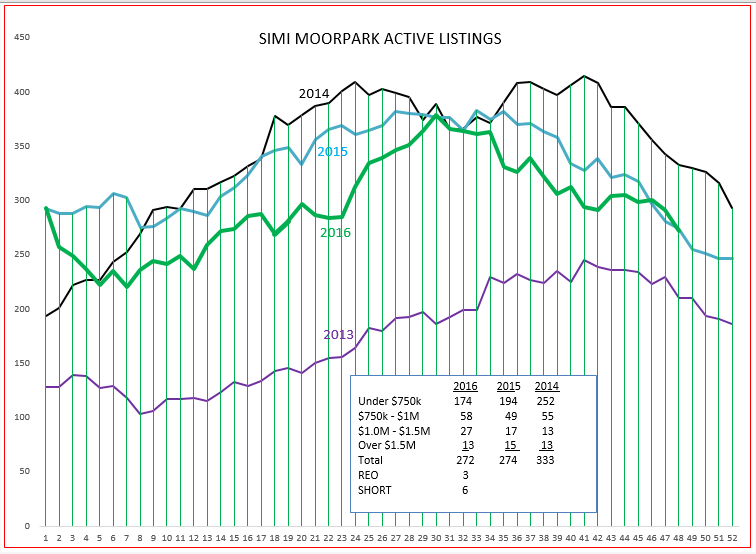
Simi Moorpark has a little more diversity. The graph jitterbugs along, but overall the decrease in slope is right on target.
When we get to the closed sales charts, it takes a little more study to see the trends. Before we get to those charts, let’s look at the overall statistics for a numerical measurement
..
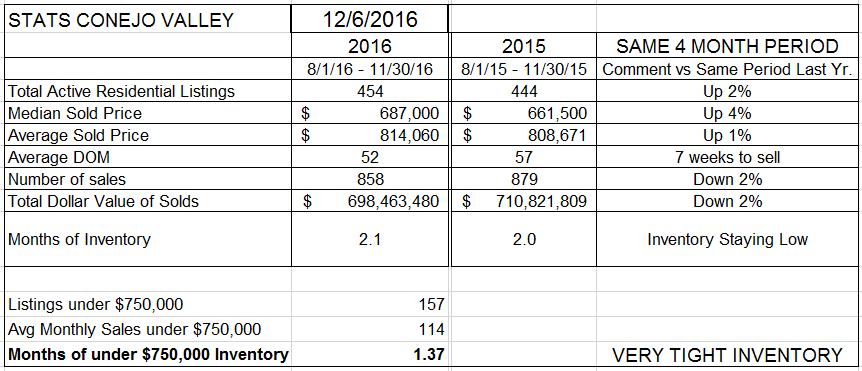
For the Conejo Valley, total sales are down 2% for the past 4 months, but were down much more in the first half of the year. Inventory remains very low, particularly for homes in the under-$750,000 category. Two months of inventory is the new normal.
Now that we know sales over the past 4 months were 2% lower than the same 4 months last year, let’s look at the graph and see if it tells the same story.
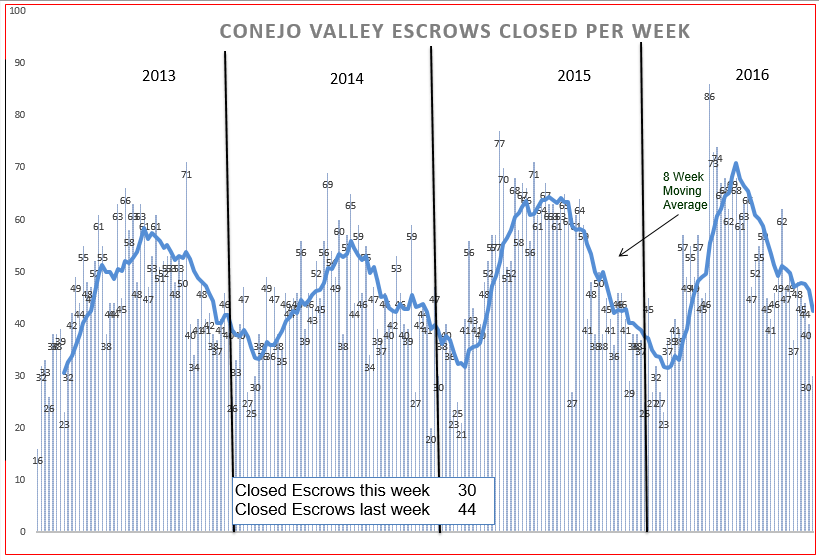
Sales had a hjgher, more pointed peak than in 2015. As we go toward the end of this year, you can see sales higher than 2015, a good omen for 2017.
Next, let’s compare the same two charts for Simi Valley and Moorpark.
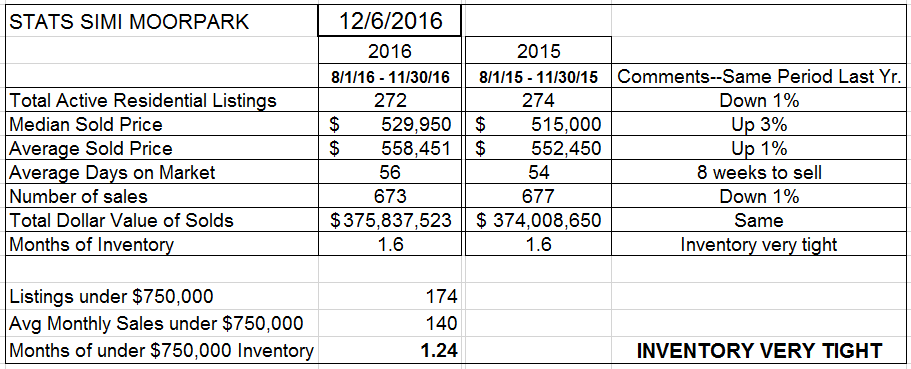
Sales also down, only 1%. But a much tighter inventory, mainly because of the median price points in Simi/Moorpark, and the lack of a large number of higher priced homes. Inventory is also extremely low, extremely low.
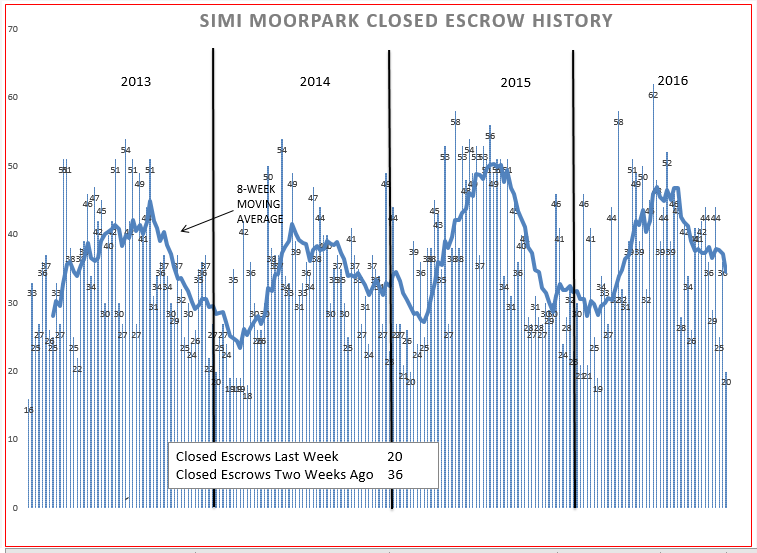
Again we see a slow beginning in 2016, but sales are comparatively strong as we close the year. Better to finish the year strong forecasting a strong beginning for 2017.
The final thing we usually look at involves pricing. That is the third leg of the three-legged economic stool, supply and demand and pricing.
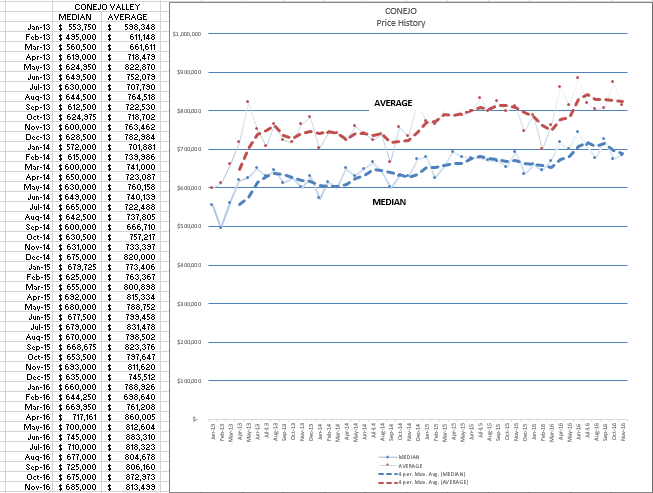
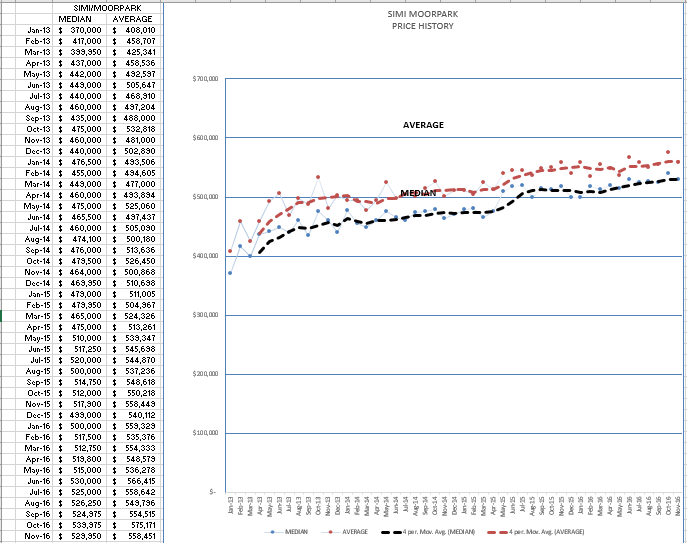
Comparing these charts lets us compare the two valleys. Conejo has a lot more space between the median and average prices, caused by the wider range of homes in inventory. There are recognizable peaks and valleys, caused by seasonality and by the activity, or lack of activity, in higher priced markets. Simi/Moopark does not have as pronounced a price seasonality, although prices are a little lower as we approach what we laughingly call winter (Sorry, I am originally from Chicago).
I decided to do a little more investigation into the different price categories. The following chart shows how long the inventory would last if we continued to sell at the same rate as the last four months.
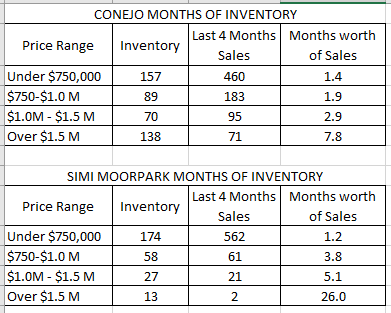
This supports the proposition that the homes under $750,000 are where a lot of the action is. The months-worth-of-sales to use up all the inventory always is higher when speaking of high priced homes, but now we can see just how much higher. In the highest price category for Simi/Moorpark, there is not enough inventory or sales volume to be concerned with that high final figure.
One last comment needs to be made concerning these inventory figures. Although they do not represent a huge area like the entire state of California, they do represent two very large valleys, and within those valleys are micro-markets that have very different stories. Do homes sell as fast in Lake Sherwood as they do in North Ranch? It depends on the inventory, and on the price points. That is what makes real estate so interesting. All real estate is very, very local.
Have an excellent experience during the holiday season, enjoy your time with friends and family, and prepare for another good real estate year.
Chuck