All real estate is local. However, since I am up in Sacramento at the C.A.R. meeting, I have heard from agents all over the state, and can report that everyone is reporting that their inventory is very low, and prices are rising.
Reporting that our inventory is low is not enough. It would elicit a response that the old Johnny Carson show often included, “How Low Is It?”
First, the picture to see how the past few years compare.
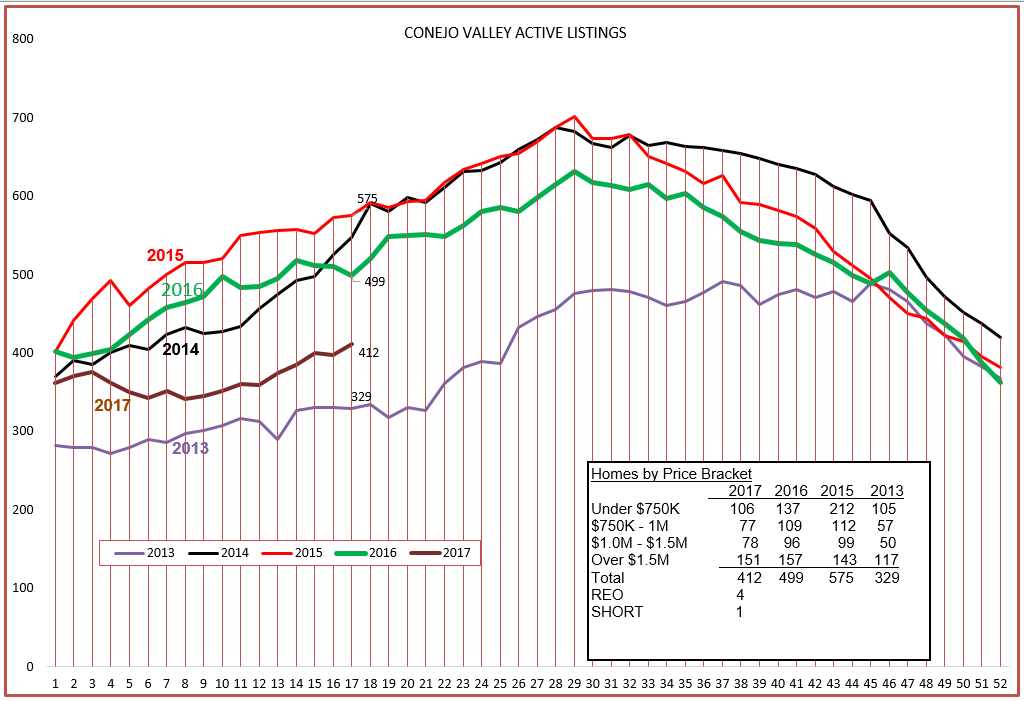
So not as low as 2013, a year of strong price increase due to low supply and high demand, but the lowest inventory since 2013. And note that REOs and Short Sales account for a whopping 5 listings.
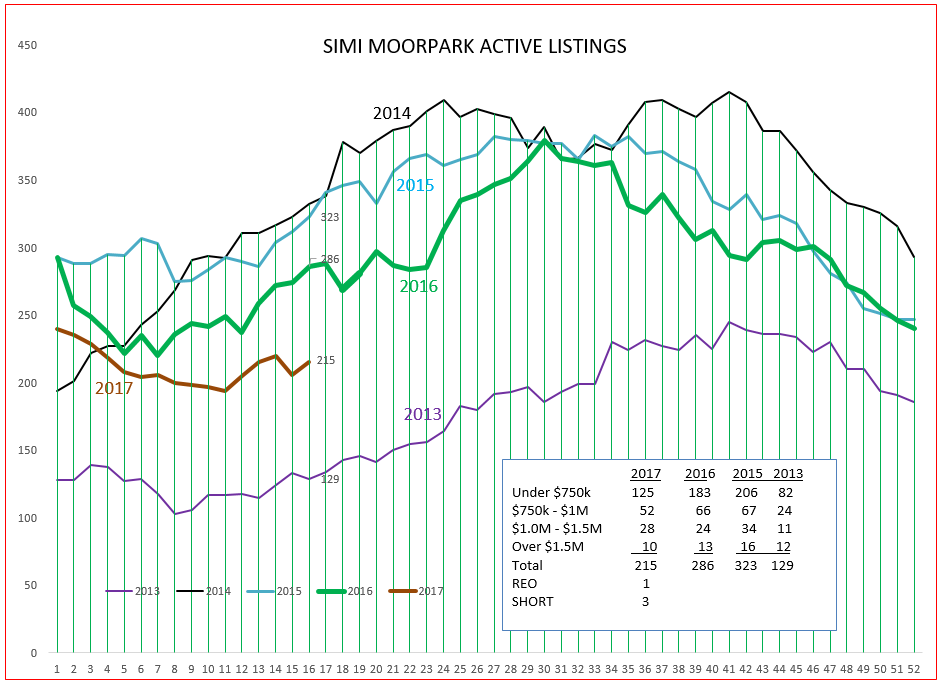
SImi Valley and Moorpark show similar low inventory positions, with a total of only 4 REO and Short Sale listings.
How about demand? Graphically first.
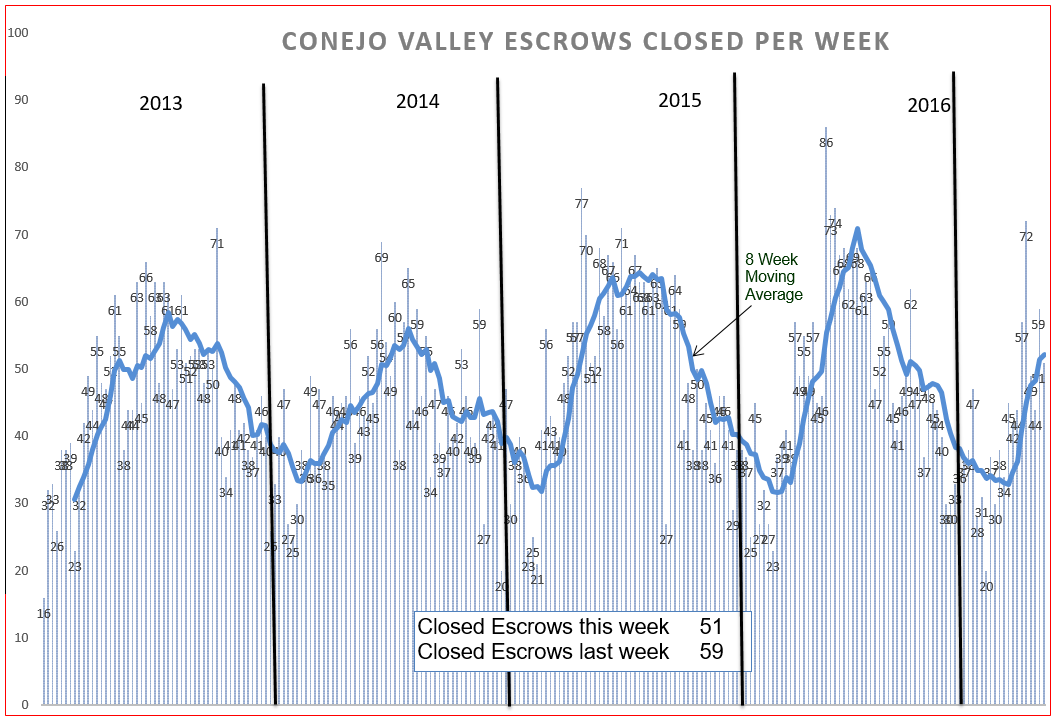
The strength of closed escrows compares favorably in 2017, following the same graphs we experienced in 2015 and 2016. Combine that strength with the lower inventory we are experiencing, and we are experiencing strong forces to increase prices.s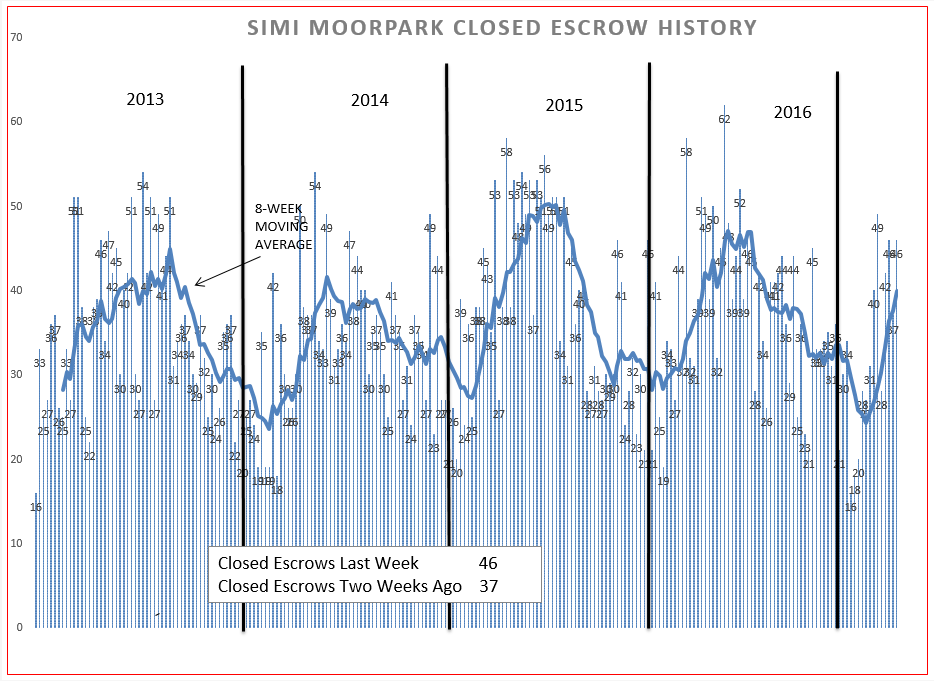
SImi Valley and Moorpark are about the same. Frankly, it is difficult to make a comparison just looking at this graph. So let’s look at the actual numbers, comparing the first four months of 2017 and how they compare to the first four months of 2016.
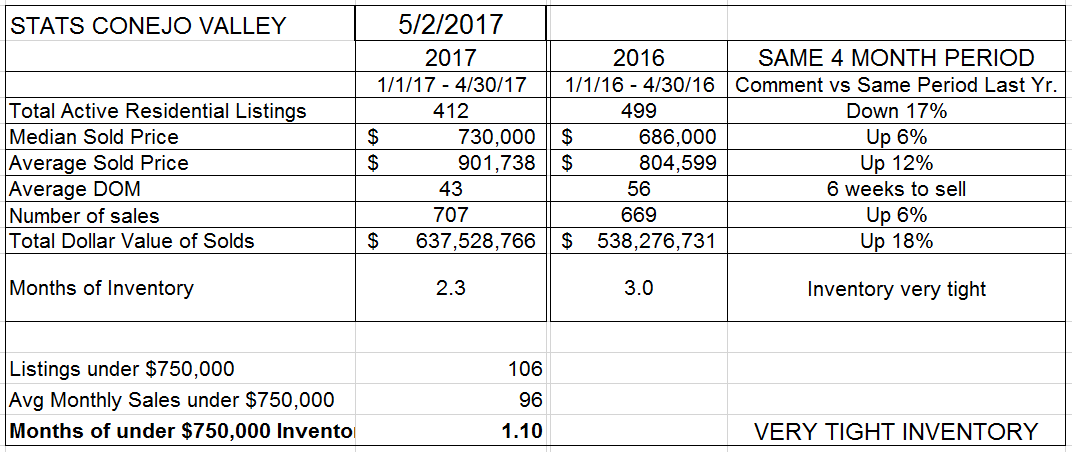
Looking at these numbers, we can see that the number of sales is actually up 6%, although we have 17% fewer listings at the same point in the year. So what has lower supply and higher demand done to prices? They are up 6% on Median Price, and double that, 12%, on Average Price. The difference represents a larger percentage of higher priced homes as part of the entire group of homes sold. What should you say when discussing where prices as compared to last year? 6% is the logical answer, 6% higher than last year, 6% increase in value. One of the best investments around. For a median Conejo price of around $730,000, that means a home increased in value about $45,000. Homeowners should be happy with that number. The average homeowner made $45,000 while sleeping in their home last year. The average renter made nothing., and more than likely saw their rent increase.
Total months of inventory represents 2.3 months worth of sales, a low inventory, lower than last year. And for homes priced under $750,000, a very low one month worth of sales.
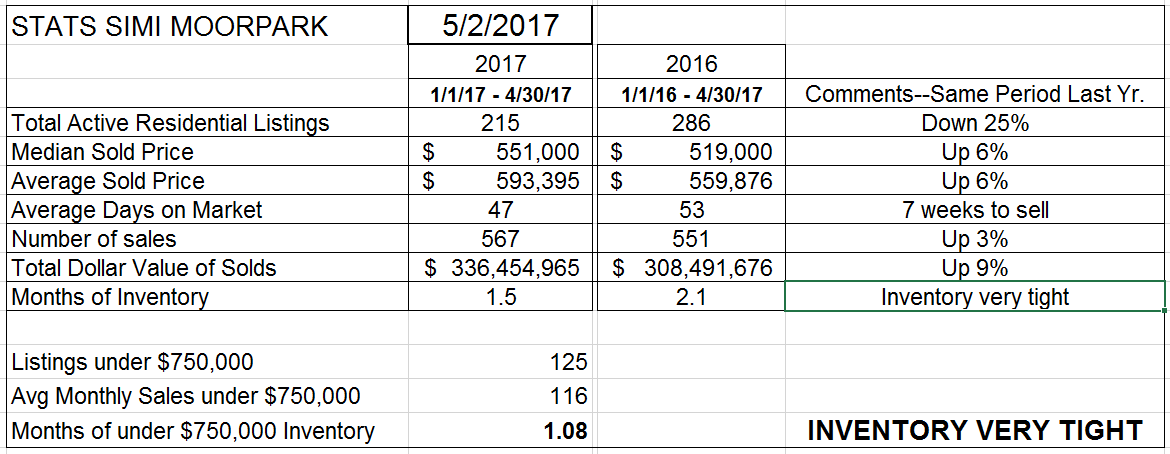
Looking at Simi Valley and Moorpark, we can see that the number of sales is up 3%, although we have 25% fewer listings at the same point of the year. That lower supply may be limiting the number of sales. So what has lower supply and higher demand done to prices? They are up 6% both on Median Price and Average Price. Not as many higher priced homes to move the Average price away from the Median. What should you say when discussing where prices are compared to last year? 6% is the logical answer, 6% higher than last year, 6% increase in value. One of the best investments around. For a median price of around $551,000, that means a home increase in value about $34,000. Homeowners should be happy with that number. Total months of inventory represents only 1.5 months worth of sales, a low inventory, lower than last year. And for homes priced under $750,000, a very low one month worth of sales. Tight inventory and strong demand usually means upward pricing pressure.
Let’s look at the past history of prices, recorded for each month. In these charts, the median and average prices are for the actual one month period, rather than for the four month period above.
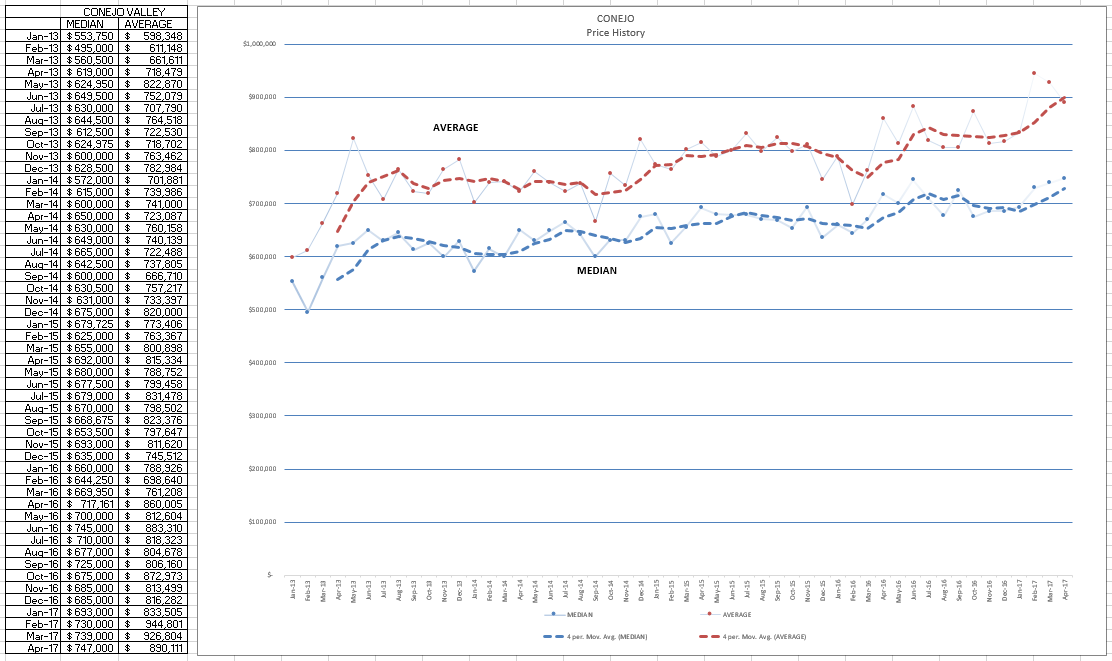 Prices have been strongly increasing, with the median jumping from $693,000 in January to $747,000 in April. I like to make comparisons over a longer period of time, but you can just see the strength in pricing month-to-month, as well as the seasonality as we enter the summer season.
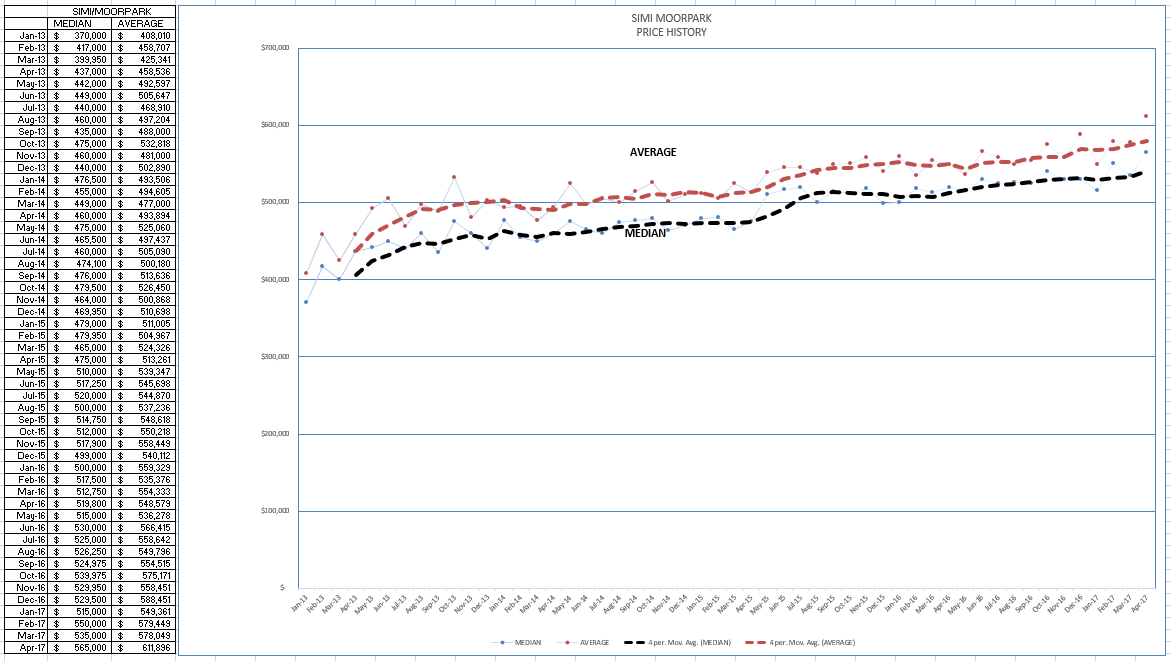
For Simi Valley and Moorpark, the median price has jumped from $515,000 in January to $565,000 in April. This is where confusion begins, when people start quoting percentages without specifying exactly what period of time they are comparing. Year over year, over a four month sample, prices increased by 6%. Month to month, since April we have seen prices increase 10%. Which is correct? They both are. The numbers show we have very strong pricing pressure this year, and over time we will see that average 6% number increase.
So what is your house worth? That is what our clients want to know. Remember, these figures represent entire valleys. There are micro-markets in each valley, changes by area and even by tract. We have an enormous amount of information available to give the answer to each homeowner that asks that question. You need to do something similar for each one of them.
Have a fabulous month.
Chuck