Supply and Demand and Pricing. All three are tied together. Each one affects the other two.
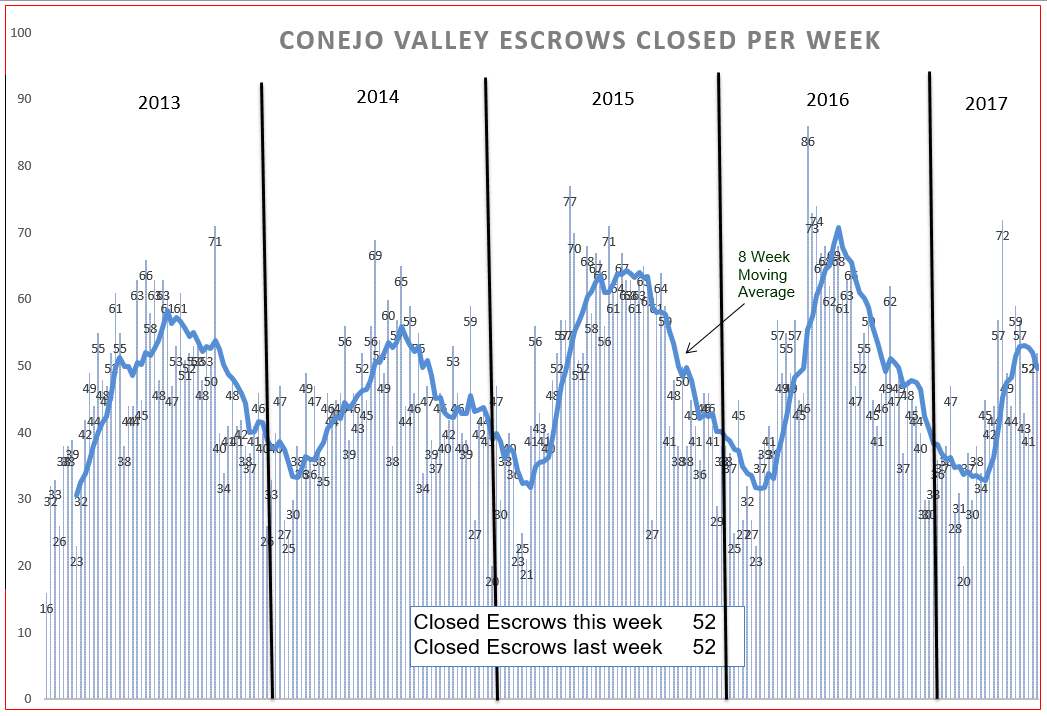
This month, I want to start with the Closed Escrows chart. I have never done this before, but this month there is a particular phenomenon happening that starts our discussion.
As we head into the summer selling season, sales are dropping off. That is unusual. That is not normal. But it is supply and demand theory.
The chart below shows five years of history. The first four show how strong sales are as we enter the summer selling season. What about 2017? A trend reversal? We had extremely strong sales in the beginning of this year, as evidenced by the rapidly rising, almost vertical graph. Now we have not only leveled out, we are actually reversing direction. The charts have not shown that since 2013. The year 2013 was a year of very low inventory, strong sales, and strongly increasing prices. Similar to what we are experiencing in 2017. Then 2013 sales took a dip before climbing again. For 2017, let’s call this a breather, a pause to balance things out.
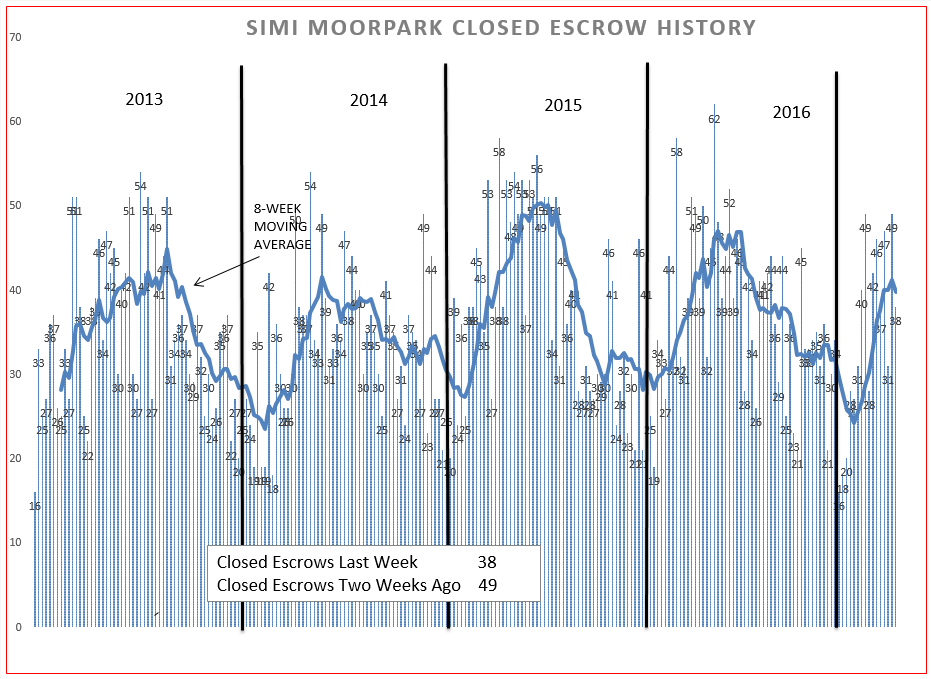
Let’s compare how Simi Vally/Moorpark is doing. Not as dramatic, but certainly a pause, and a reversal also. The history of sales in Simi Moorpark has never been as “smooth” a line as we see in Conejo, less week-to-week consistency.
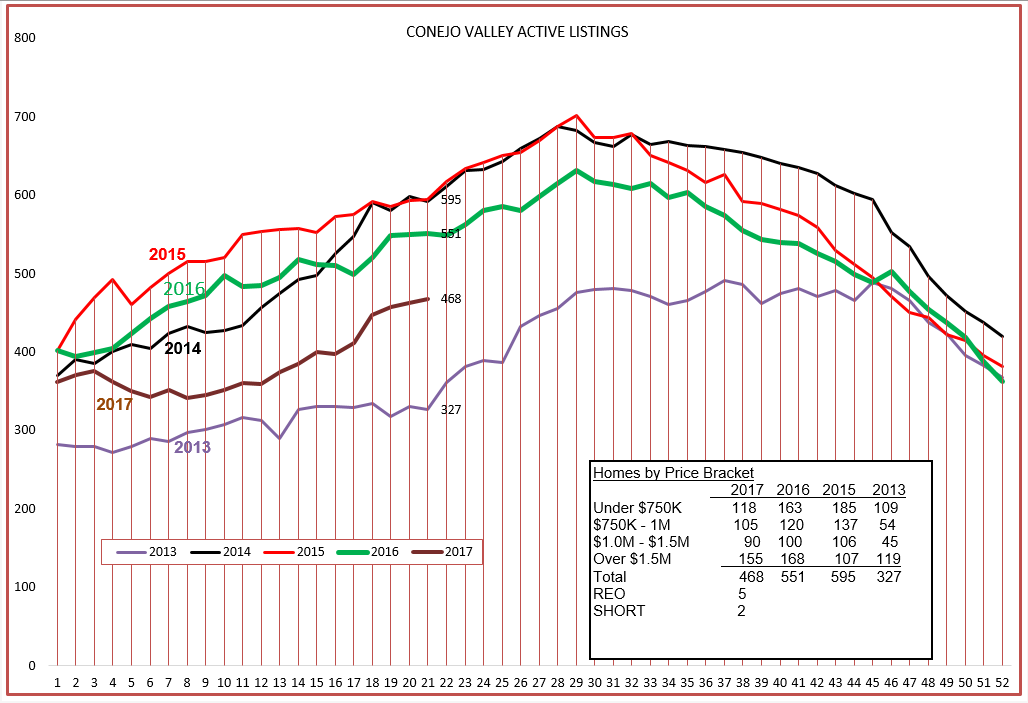
We have been experiencing low inventories, and perhaps that is the reason for the lower sales numbers. Conejo seems to be tracking with what we expect with inventories. Not as low as 2013, lower than the past three years, but certainly tracking the same path.
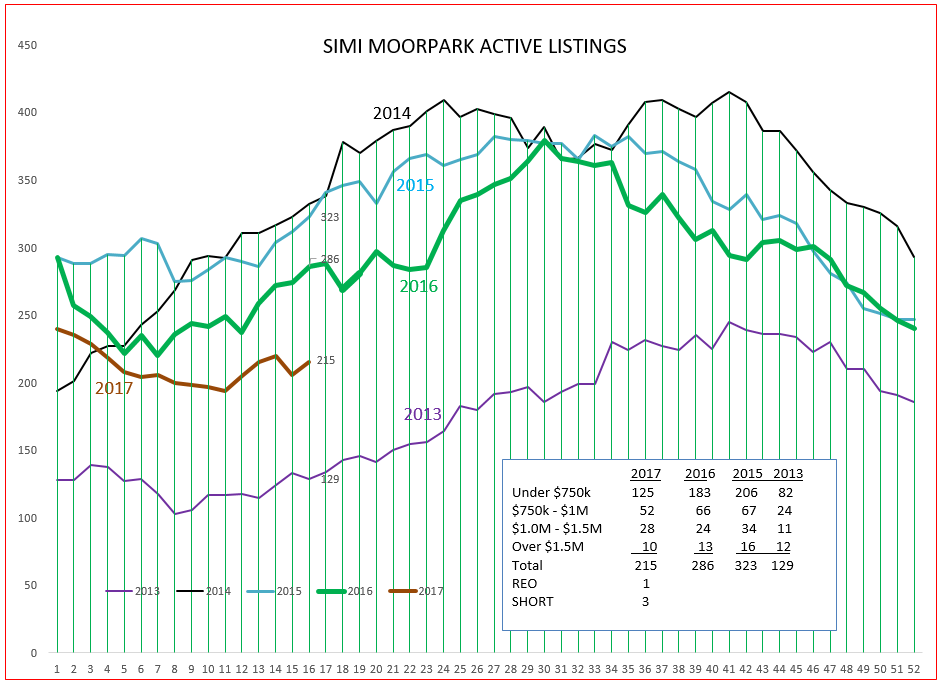
Simi Valley/Moorpark is a little different, with lower inventory currently than at the beginning of the year. They are not following the expected summer increases in inventory, but are behaving more like 2013, a year of very low inventory and strongly increasing prices. Both valleys seem to be tracking 2013 more so than the intervening years.
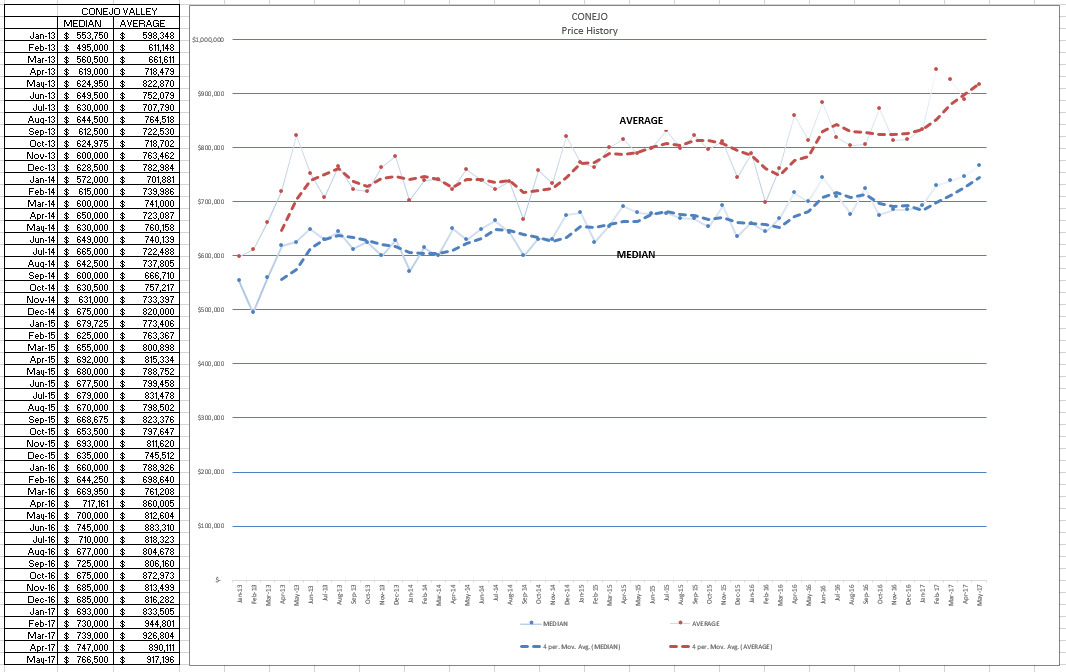
The third leg of the stool is pricing. We have been experiencing strong sales, we have been consistently looking at low inventories, we have been forecasting higher prices. When we look at the graph below, we see an extremely strong trend in higher pricing. Remember, these are monthly price figures, not 3-month figures, so we see rises in prices more quickly, without the averaging effect of multiple months. Both median and average prices are increasing very strongly.
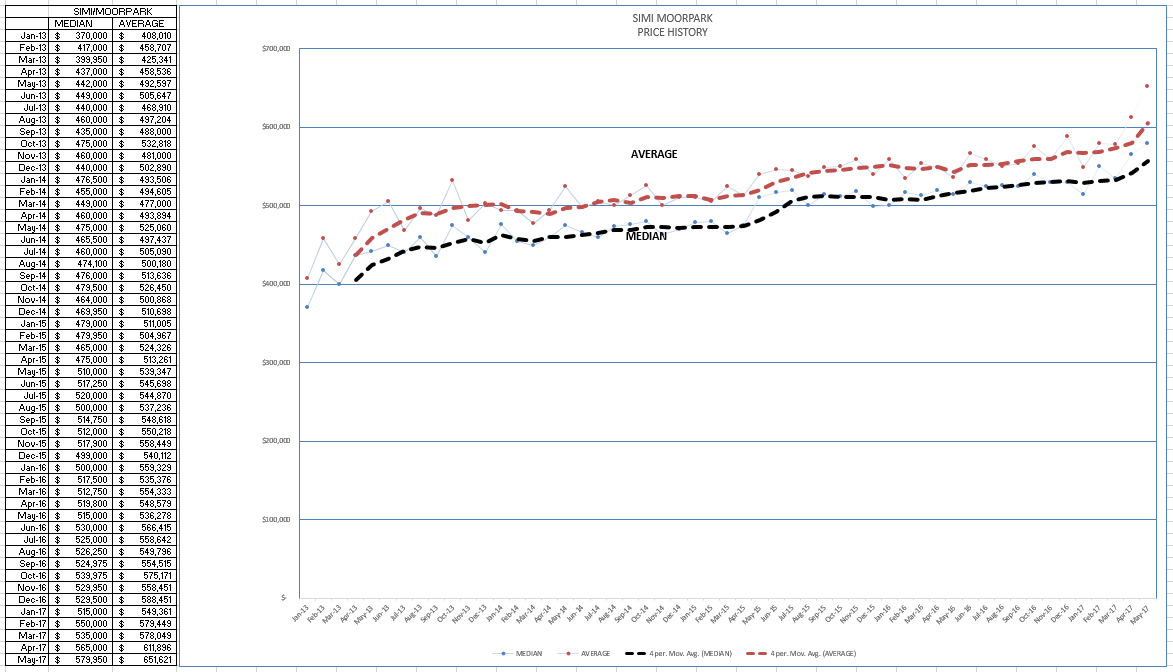
Simi Valley/Moorpark also shows a very strong uptick in pricing. For May, the median price for Simi/Moorpark was $579,960 versus $515,000 in January. The same increase with the median price.
We can see that the recent history of low inventory and strong demand has caused prices to increase strongly. If prices increase too strongly, it will cause sales to moderate (decrease) and inventory to rise. All three are related, any two affect the third element.
Let’s look finally at the overall actual statistics, not the graphs, and see if the numbers mirror what the graphs are telling us. Remember, in these statistics, year-to-year comparisons are made by comparing the past three months with the same three months last year.
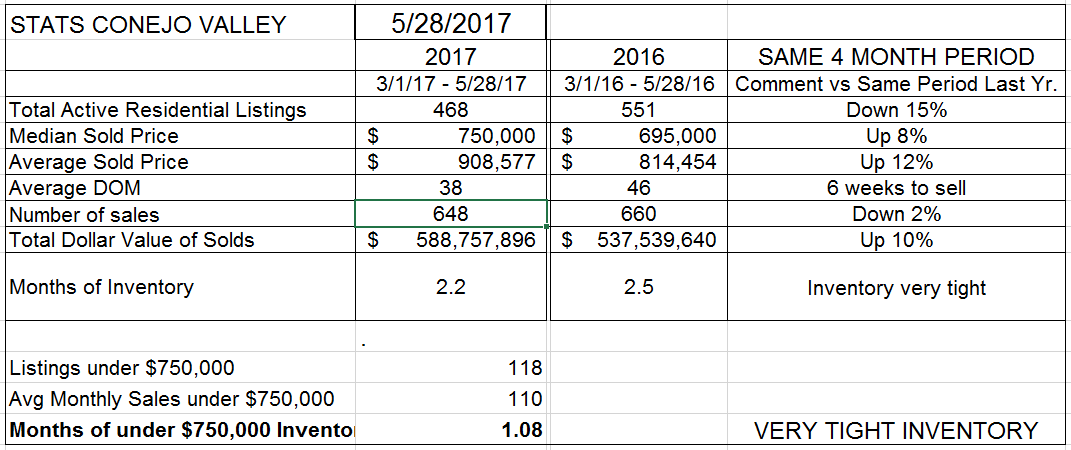
Conejo prices are up between 8-12%. Extremely strong. The number of sales is down 2% compared to last year. Inventory is down 15% from last year. But remember these changes are not immediate, this balancing act takes at least a few months to occur. One of the most interesting statistics to watch is Average Days on Market. 46 last year, only 38 this year, getting closer to only 5 weeks to sell the average home. Listings are going into escrow very rapidly, often after multiple offers and sometimes with selling prices exceeding list prices.
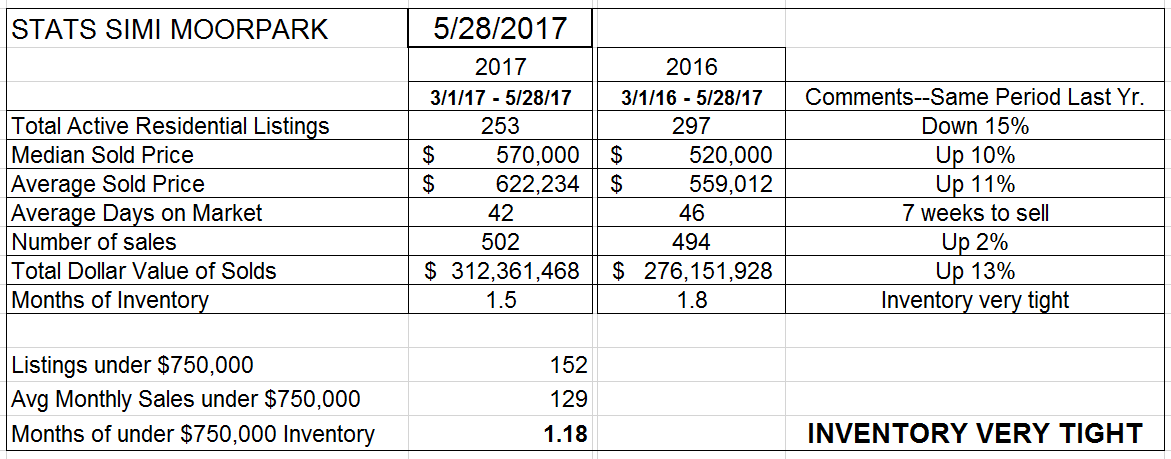
Simi Moorpark shows similar numbers. Median and Average prices up 10-11%, with inventory down 15%. The number of sales is now 2% lower than last year, weakening. Inventory tightness has been one pressure limiting sales from growing, but now pricing is beginning to become a limiting factor. If I read this right, we will soon see inventory start to climb as sales numbers continue to moderate. I don’t look for prices to decline, but slower sales will put out the fire under prices.
The market has experienced rapid price increase, and we have more than half the year to go. This is why they call it a market. Sales can increase and decrease, prices can increase and decrease, and now those two elements will cause inventory to grow. But comparing all this to 2013, the last year in which we experienced very strong price increases, the market is not falling apart, it is just taking a breather, it is just making a correction. The overall market continues to be strong.
Have a wonderful weekend, and remember to thank to the veterans you meet. They helped make all this possible.
Chuck