There is an old Frank Sinatra song titled “Something’s Gotta Give”.
We have been living for many months with extremely low inventory, with historically low interest rates, and with pricing that does not seem to be responding to the enormous pressure it should be feeling. I have used the terms “normal” and “new normal”. We surmise that the extremely low inventory has kept sales numbers from reaching their true potential, and that the demand is so strong that we could sell more houses, if only we had more to sell. The picture I see is not of a bubble, but of a pressure cooker. Looking at the inventory, prices should be ready to explode, and at that point we may have to worry about a bubble.
But is this a correct picture? We know that historically the market goes through ups and downs, or as the Wall Street gurus describe, “a correction”. That correction would normally see inventories rise, and prices stable or declining. Sales would be less than previous time periods.
So lets see what the numbers are telling us, let’s see if in the picture we can read a thousand words that describe what is truly happening.
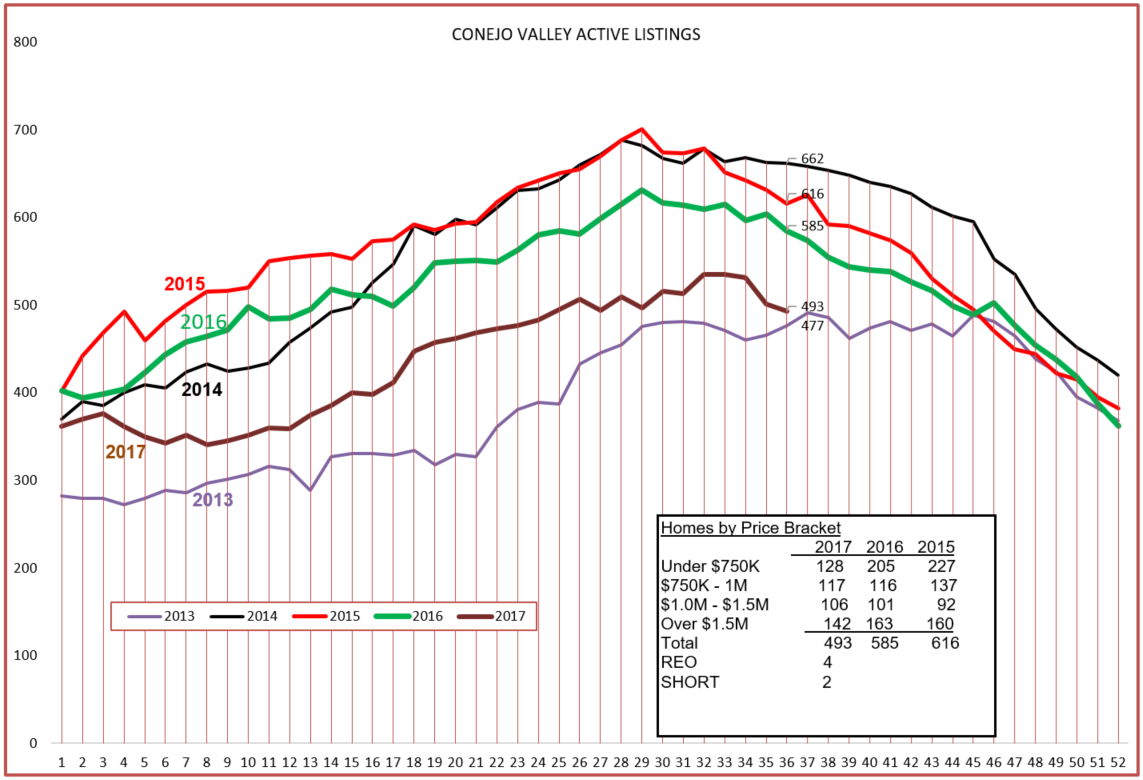
First, the inventory. Conejo’s chart is below. A large drop, somewhat expected this time of year, but the biggest drop in this last month involved homes priced above $1.5 million.
Short sales and REOs continue to be minimal. However, it looks as if the chart is looking to challenge 2013, one of the lowest inventory years recorded.
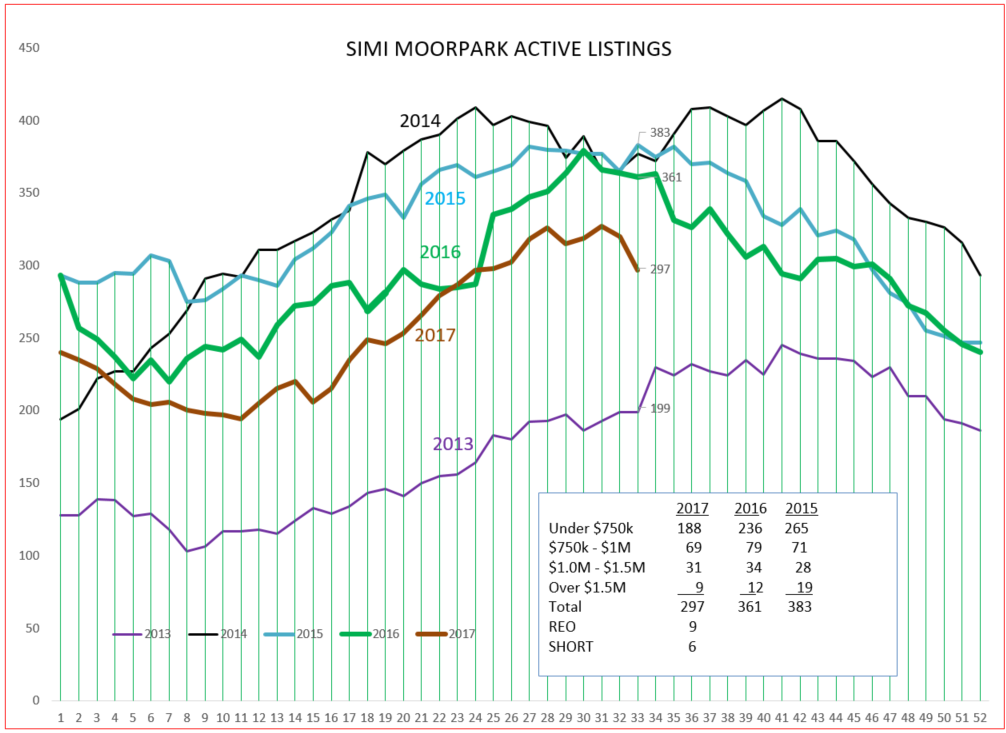
Simi/Moorpark also experienced a severe drop in inventory, mainly in homes priced in the under-$750,000 bracket, which is the bread and butter of Simi Valley. One noticeable change here is in the number of Short Sales and REOs, both climbing to highs not seen for two years.
Charts can show us trends, but the statistics for the valleys give us a little more measurement of just how much that is changing.
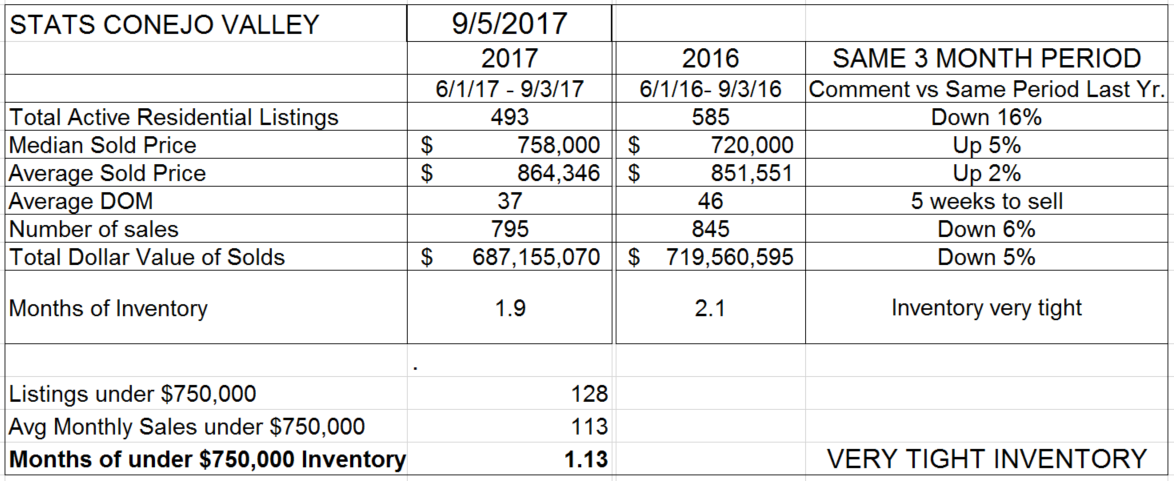
The table below compares current three months history this year with the same three months last year.
Yes, inventory is down, 16% compared to last year. Significant. Prices are up, the Median up 5% but the Average only 2%. This is a result of fewer sales at the high end. Two percent is the same inflationary figure that the Fed is unhappy about. So prices really may not have increased at all, only a little due to inflation. The number of sales is also down by 6% from last year. And the inventory is tight, compared to the amount of sales, less than two months worth of sales. Rather than talking about the past three months, the talk in the industry is that August was very very slow. Remember, these are closed escrows, and our conversations in the office generally revolve around what is selling what is going into escrow, not what came out. There is a feeling that the economy is not hitting the accelerator, is not just coasting, but the brake pedal has been applied a little.
What’s selling? The homes below $750,000. Part of that is due to wage growth, an anemic 2% per year. Not much money left over to buy homes with.
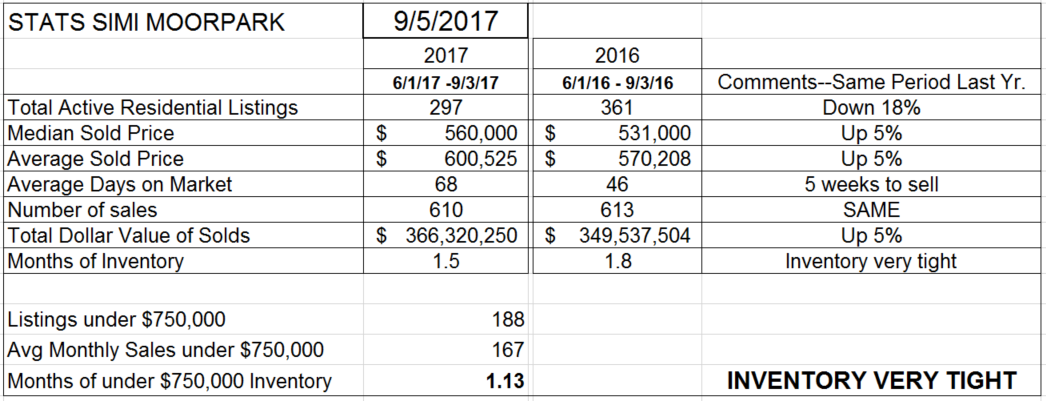
Looking at the same statistics for Simi Valley and Moorpark, their inventory is down even more, 18% lower than the same period last year. But prices are up more, 5% for both Median and Average. The Median and Average prices for this area are very close, due to the preponderance of homes in that under-$750,000 range, and not as much influenced by higher priced homes. The number of sales is the same, and inventory continues to be unbelievably tight, only 6 weeks worth. The lack of inventory is pushing prices upwards, but not significantly higher.
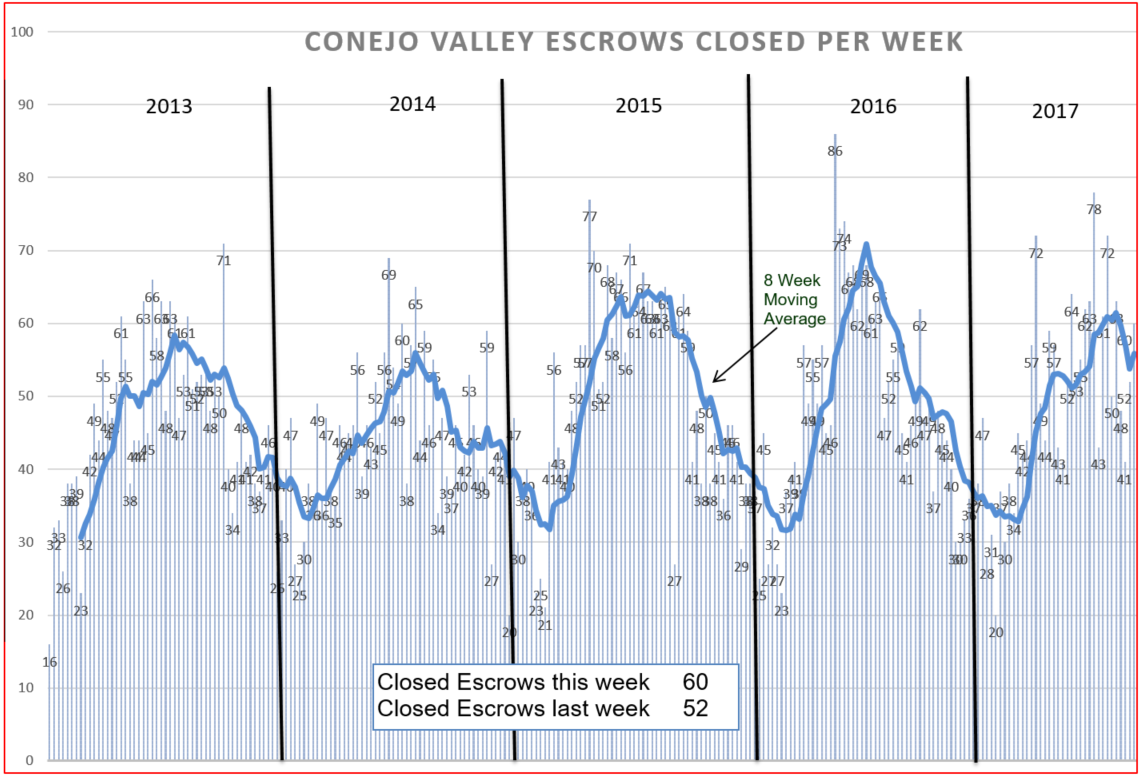
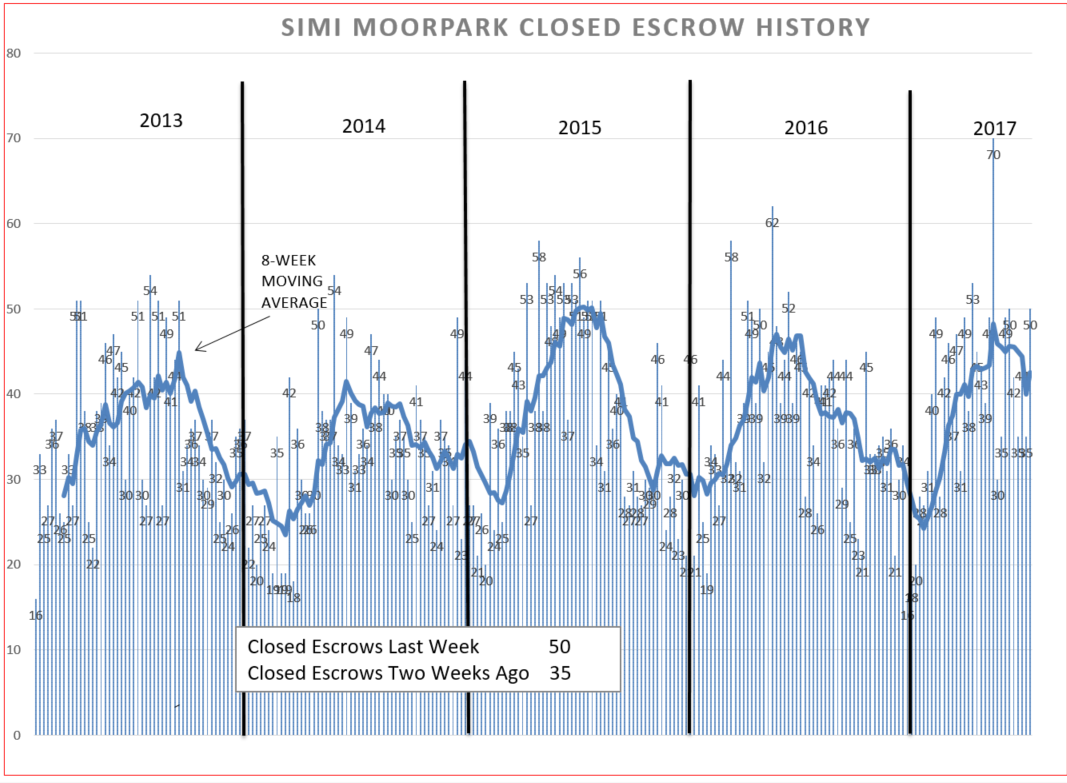
I have not put these two charts on the blog for the past month, so here they are. But you can tell from the tables above, closed escrows are the same or lower for the three-month comparison periods.
From the looks of the charts, we peaked in 2015 and 2016, but are struggling in 2017.
For Simi Moorpark, the chart shows about the same as was sold in 2016, with 2015 being a considerably stronger year.
So is lack of inventory slowing things down? Certainly no one would say mortgage prices are the reason. And although not shown here, consumer confidence remains high. Of course they don’t measure consumer confidence on a daily basis. With everything going on in Washington and Korea and two major hurricanes, I would not be at all surprised to see consumer confidence take a dip also.
I think the market is taking a rest, or as the title says, experiencing a correction.
More next month. Sometimes I hope I am wrong. Sometimes I want to write only uplifting, flowery projections. But today is not a day of bright economic sunlight, and I have to call them as i see them.
This is what I think is going on. Most importantly, what do you think is going on? Please let me know.
Chuck