There are times I wonder why the real estate markets in two separate, but adjoining valleys can be so different. A lot depends on the valley and how it was developed, high end homes versus low end homes, and certainly the number of homes built.
The population is very similar, with Conejo Valley home to 157,000 people, while Simi Valley and Moorpark is home to 163,000 people.
The overall size shows the Conejo Valley with 68.62 square miles, while Simi Valley and Moorpark are 54.68 miles.
Similar, but different. Conejo includes many more higher priced homes, historically more white collar, while Simi Valley and Moorpark was historically more blue collar.
In recent history, the number of sales in Conejo has far outpaced Simi/Moorpark. However, last month, Conejo sales dropped off while Simi Moorpark increased, with the two valleys reporting similar numbers of sales. The numbers in the charts below show the three month sales totals, 615 versus 550. For the month of October, the numbers were Conejo 159 Simi/Moorpark 176. I would surmise that because prices are going up strongly in the Conejo, those price increases are restricting the number of homes sold. Those price increases can be considered a direct consequence of the theory of supply and demand. This should be especially true in the below-$750,000 price category, with only one month of inventory available for sale.
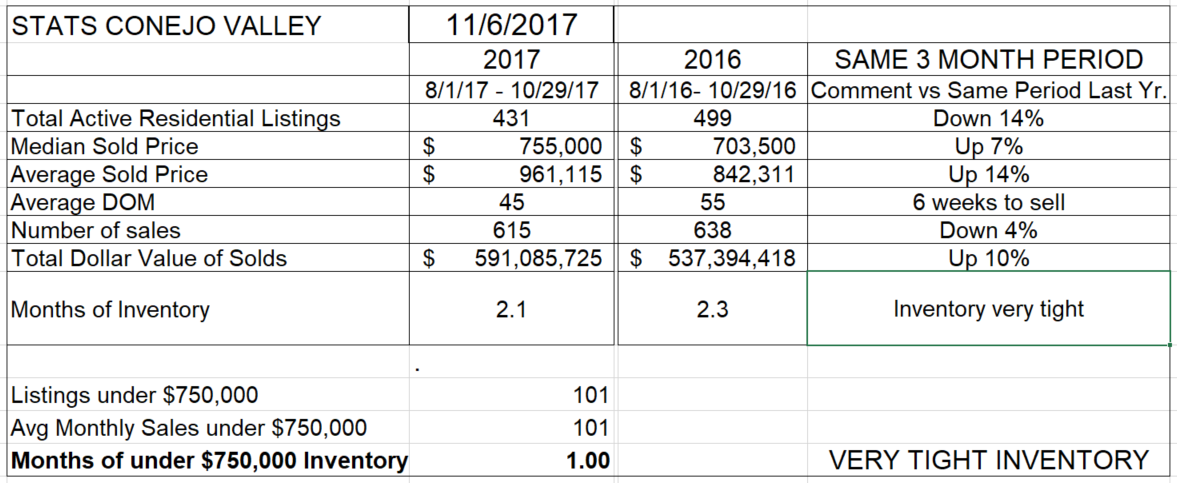
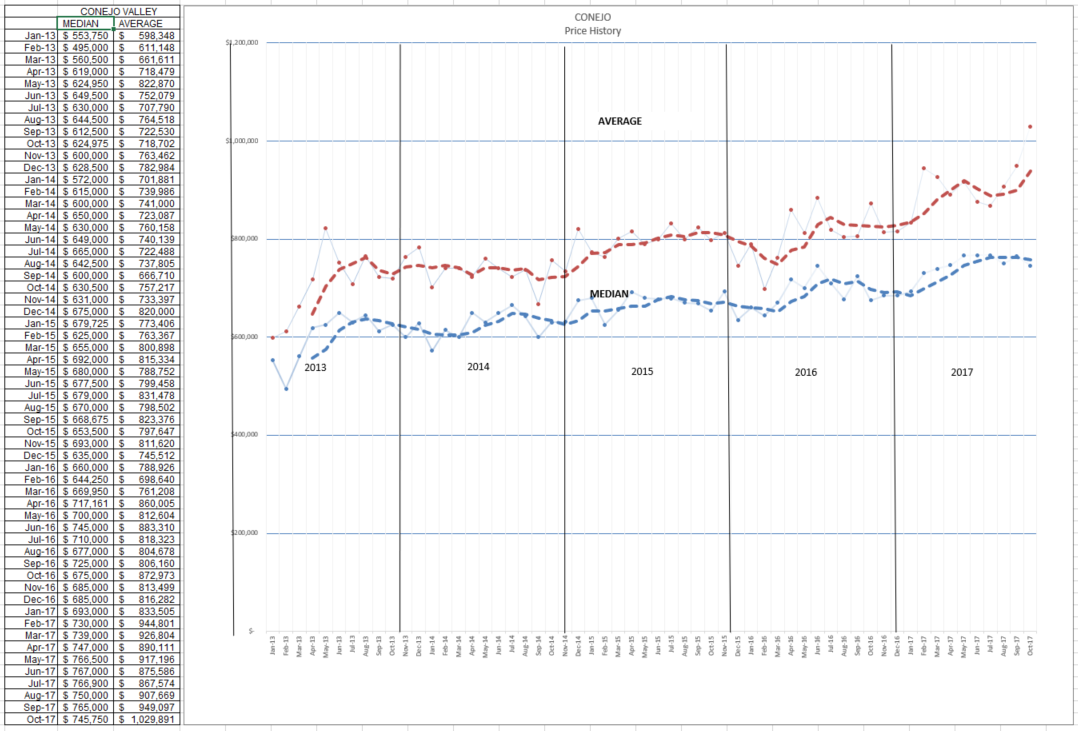
For Conejo, the inventory is 14% lower than it was at this time last year, and the number of sales down 4%. Median prices were up 7% and average prices up a startling 14%. Let’s look at the graph of prices for these two statistics. Notice that the (red) points for the average price have been skyrocketing, while the average (blue) median price has been leveling out and dropping. More homes are being sold in the higher price range than in the lower price range.
The sales figures from Conejo show a 4% dip versus last year. This is based on the August-September-October period this year as compared to the same months last year. As you can see below, Conejo never achieved the peaks of the past two years, and sales volume is now dropping as expected at this time of the year.
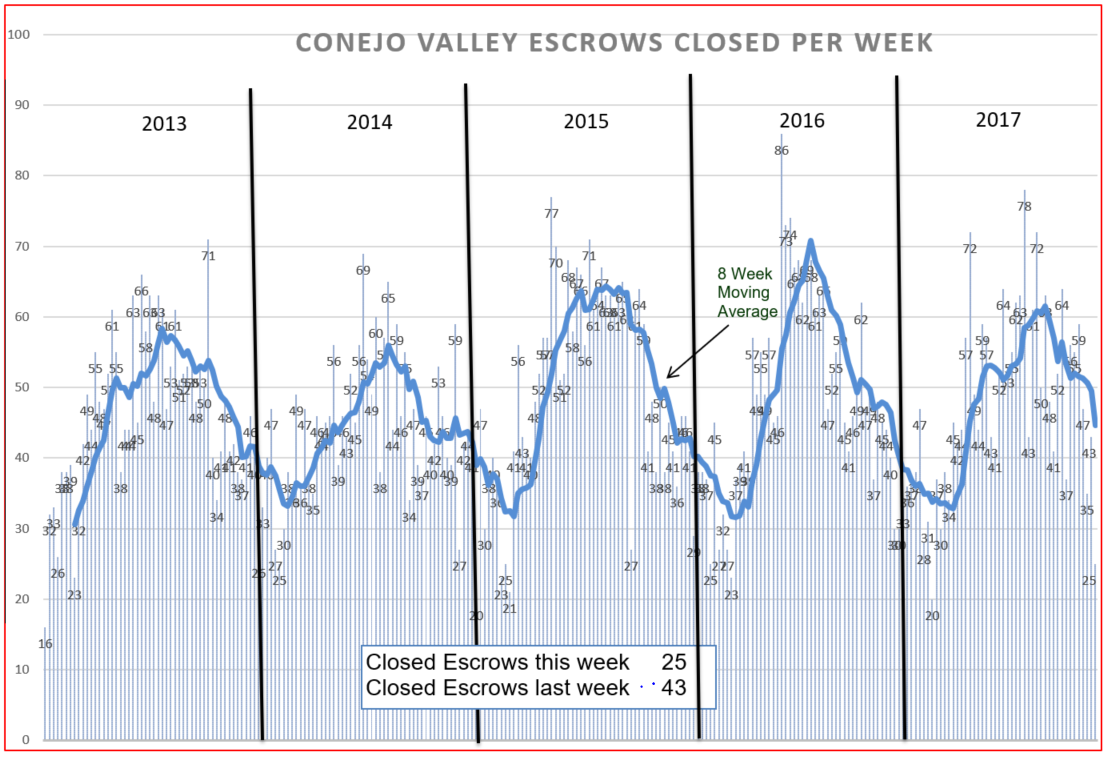
Let’s compare that graph to sales in Simi/Moorpark. Home sales have been very strong the past few months. This graph should be turning downwards, instead it is remaining at a very high level. That is not what usually happens at this time of the year. Two different markets. Simi/Moorpark sales seem to have gotten a booster shot.
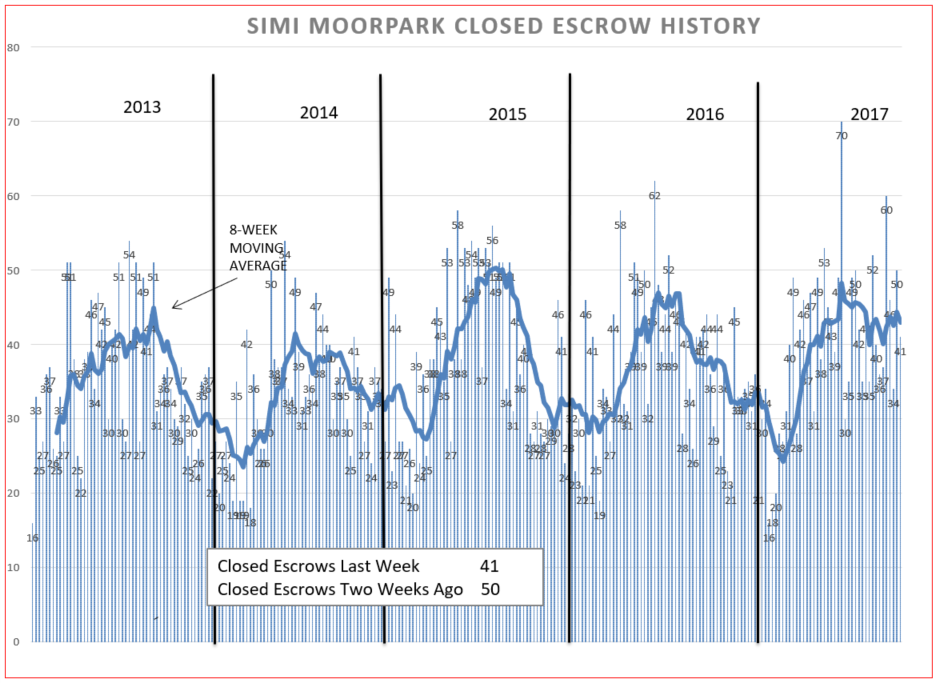
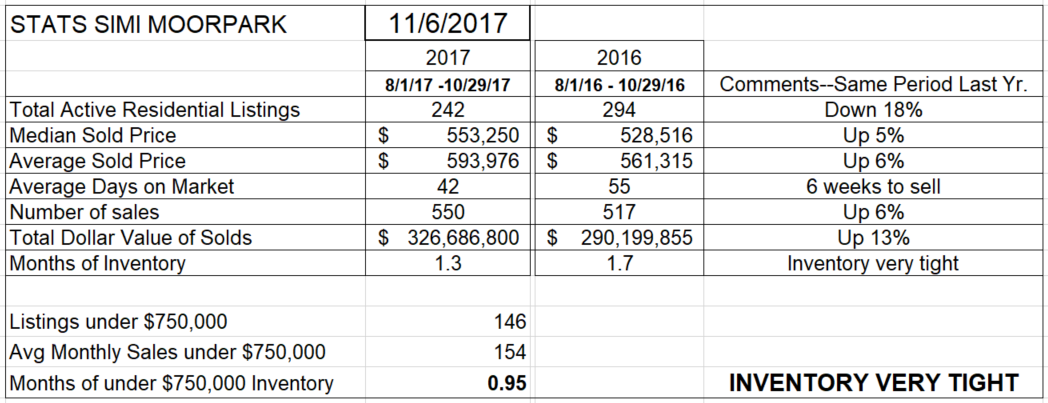
Simi’s price increases compared to the same three months last year are much more consistent with inflation in general, up 5 or 6%. This even though inventory is down 18% compared to last year. The increase in prices should slow sales down, but sales are actually 6% greater than last year at this time. The inventory of homes priced below $750,000, the strongest part of this market, is actually less than one month. That should be causing prices to escalate dramatically in the months ahead. Should be, but recent history has fought against that assumption.
Finally, let’s look at the price chart for Simi/Moorpark,
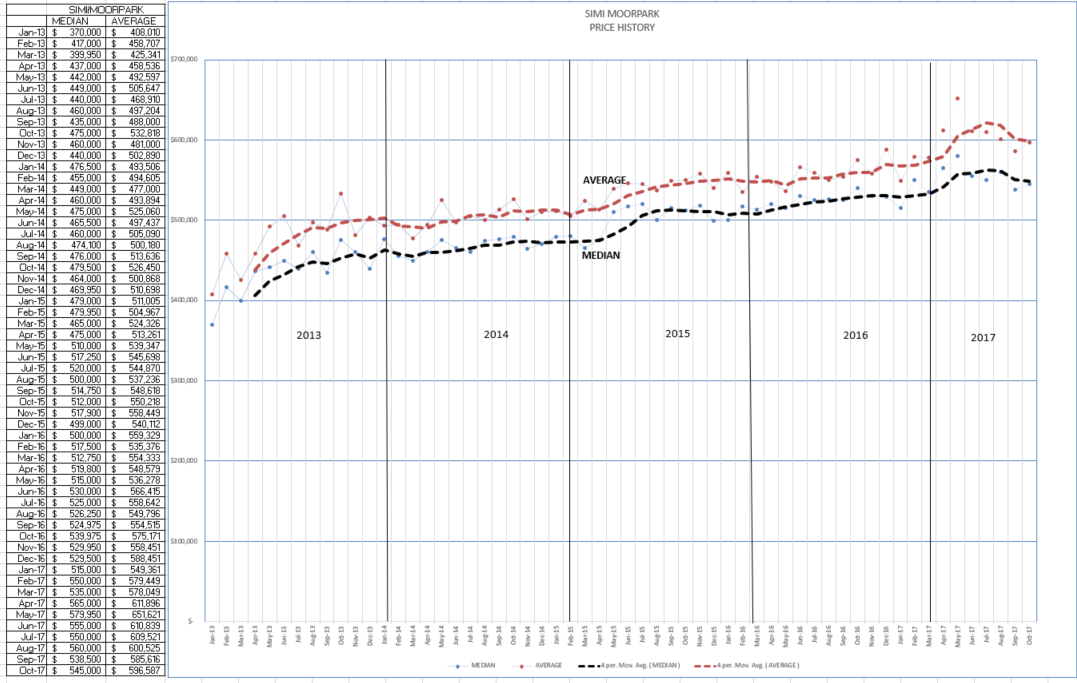
Hmm. No indication here of prices jumping. Instead, they are leveling out and declining as we approach the end of the year, as they normally do.
Anyone out there know a good mechanic than can fix the supply and demand function?
Chuck