Let’s play a little game today.
I am going to give you some data, on inventory and sales levels, with comparisons to last year.
I will compute how long this inventory should last, based on the current level of sales.
Then you will use that information to make your estimate as to what you think should be happening to prices based on these factors.
OK, let’s begin with the Conejo Valley.
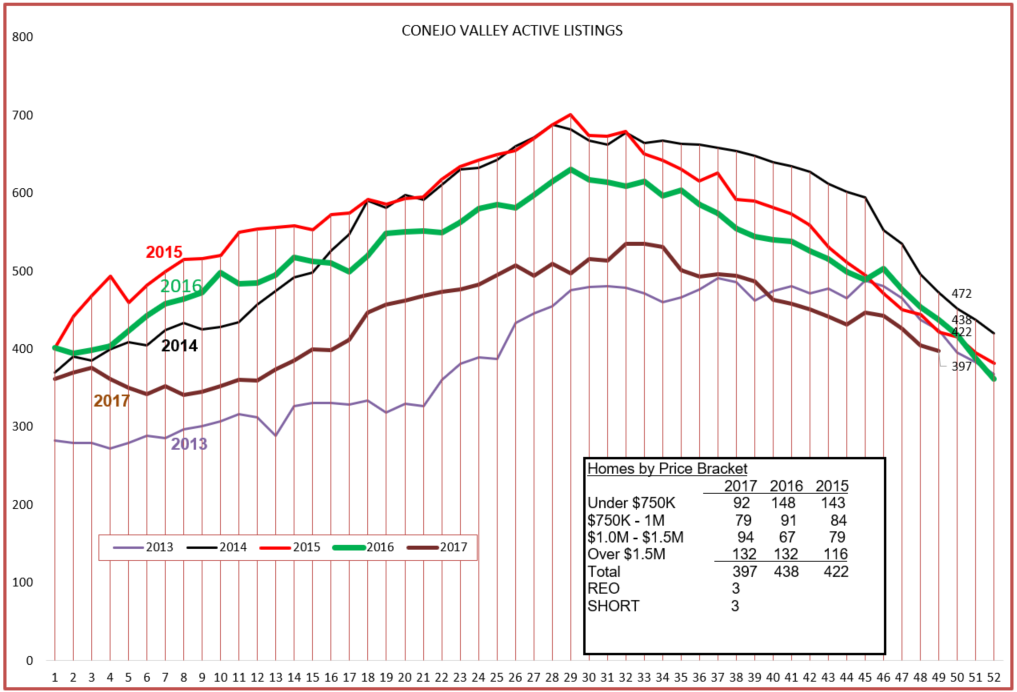
The dark brown line representing 2018 displays the lowest inventory in 5 years, except for 2013. Recently, the inventory line dropped below 2013, making the inventory this year the lowest in 5 years. The inventory is down 9% from last year. Fully 1/3 of the inventory is represented by homes priced in excess of $1.5 million, and 57% is priced in excess of $1 million. Based on the current level of sales, the number of homes priced below $750,000 represent less than one month worth of sales. In previous times, the industry thought that an inventory of 6 months worth of sales was considered standard. At less than a month, no matter what you consider normal to be, this is a very, very tight inventory level. Is the inventory so low that it actually impacts sales? If we had more inventory, could we sell more homes? Very likely. Now let’s look at the sales level, represented by the number of closed escrows each week.
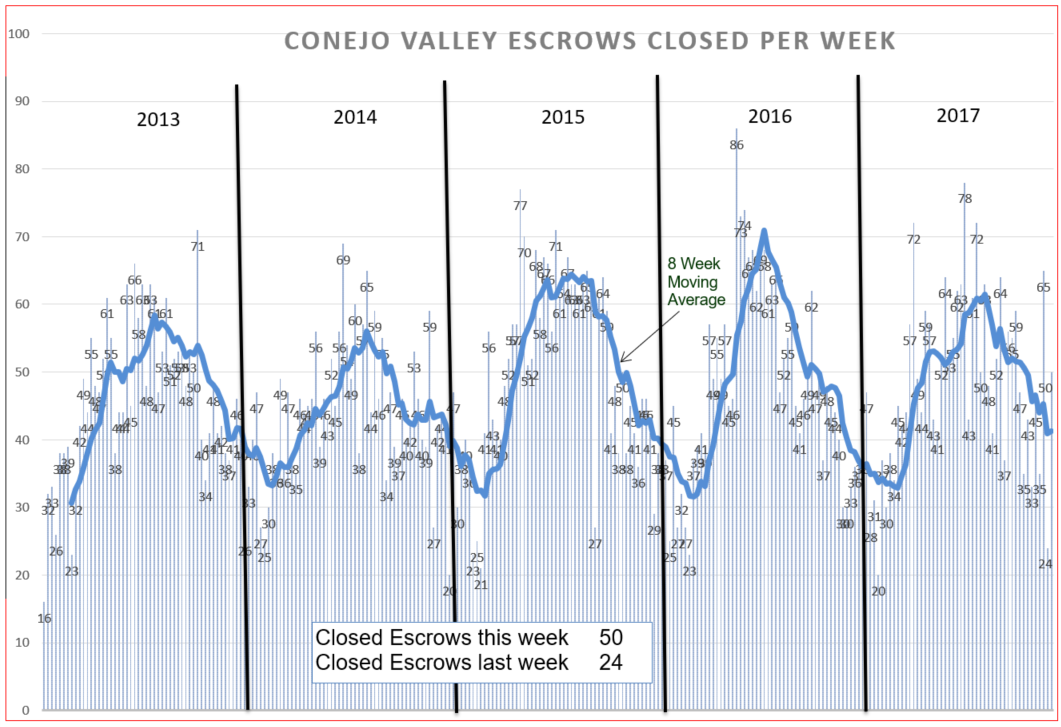
The 2017 graph lacks the peak reached in 2016, but is wider, spreading sales over a longer span of time. Total sales for September, October, and November 2016 are practically exactly equal to sales in September, October, and November in 2017. (604 vs 608, and 2015 sales were also in the same area at 622,) With the numbers this close, one could assume that sales volume for all three years was stable.
Now comes the test part. If the inventory is down 9% from last year, and sales are consistent with last year, what should happen to prices?
Prices are the third part of the supply and demand equation. Prices can influence the number of sales to be higher or lower, inventory can influence the number of sales and prices to be higher or lower, and the number of sales can influence prices, and consequently inventory. If prices are too high for buyers, inventory begins to build.
So tight and lower inventory combined with stable sales should push prices up. Let’s see how those results compare.
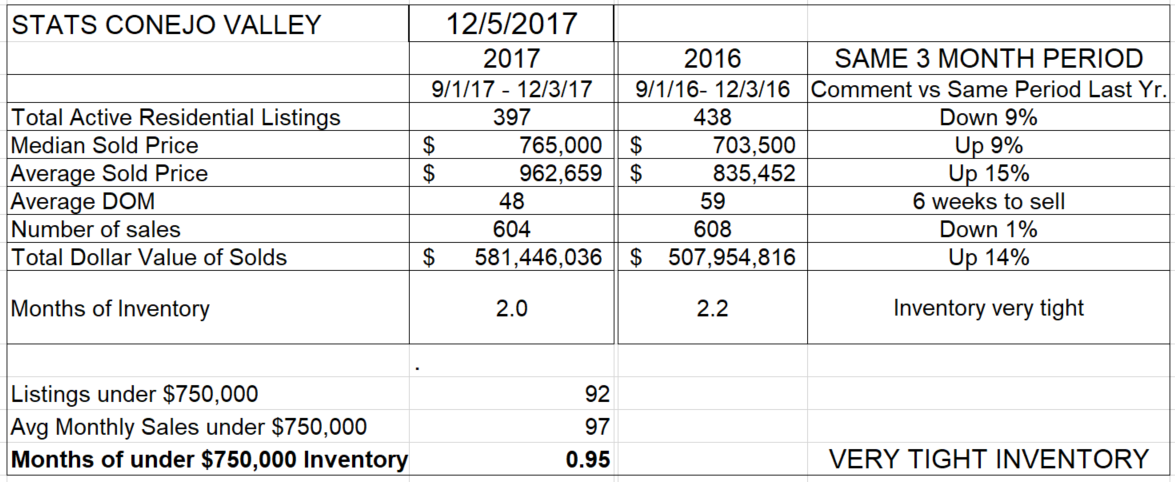
Inventory was down 9%, and sales were down, but only 1%. As expected, prices jumped, with the Median up 9% and the Average up a whopping 15%. The average is higher due to the number of high priced homes sold.
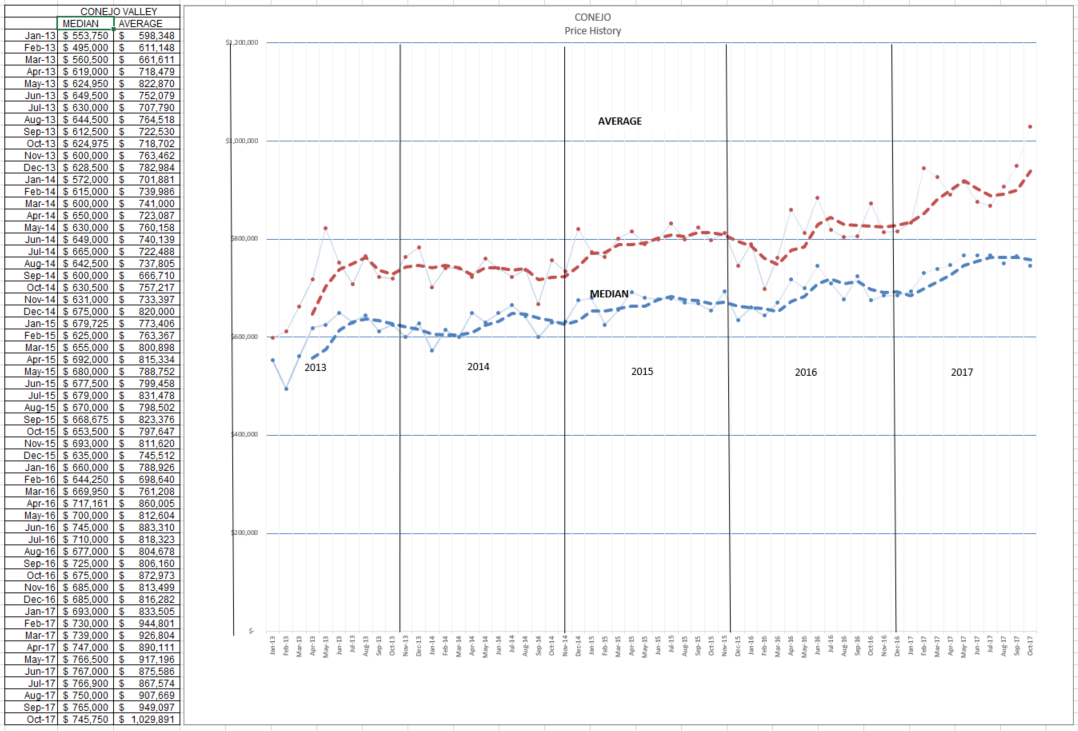
Now let’s look at prices a little differently. The chart below does not show averages over three months. It shows each month as a point, and the trend line is an average over 4 previous points.
Note the last four red points (Average Price) entered on the right side of the graph, prices shooting skyward. However, the Median price points are stable, trending slightly downwards. But comparing both charts to the previous year, you can spot the strong increase.
So, you do understand supply and demand and price. This all seems very rational, inline with the concept of Supply and Demand.
Great. Now let’s look at Simi Valley/Moopark and make sure this concept works everywhere.
First, the inventory.
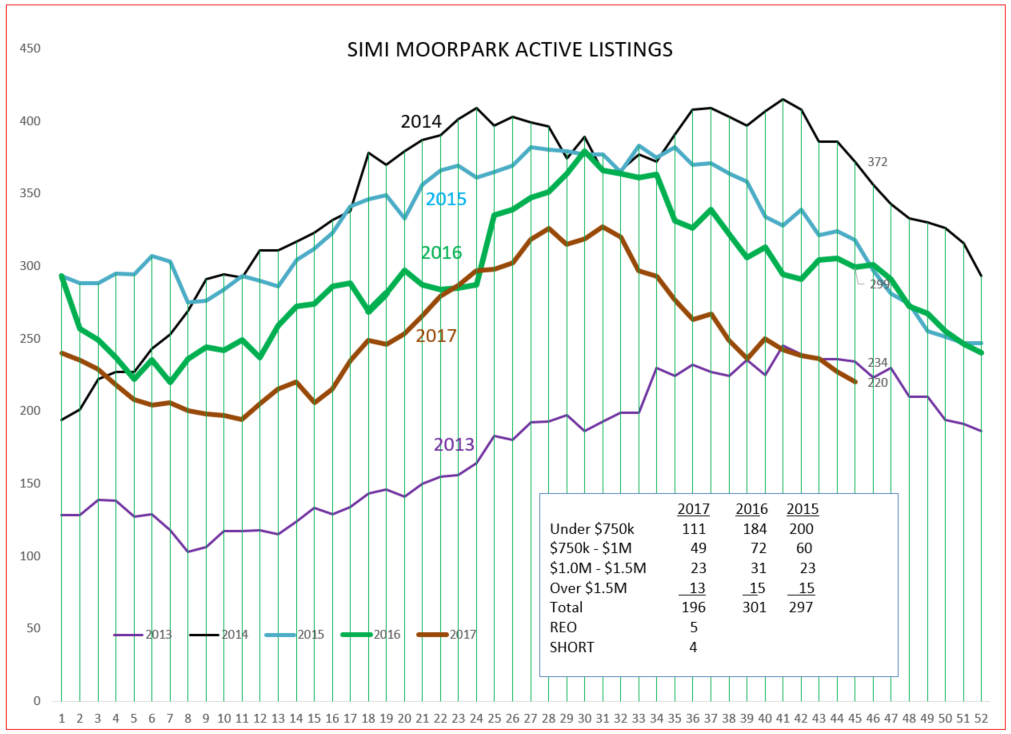
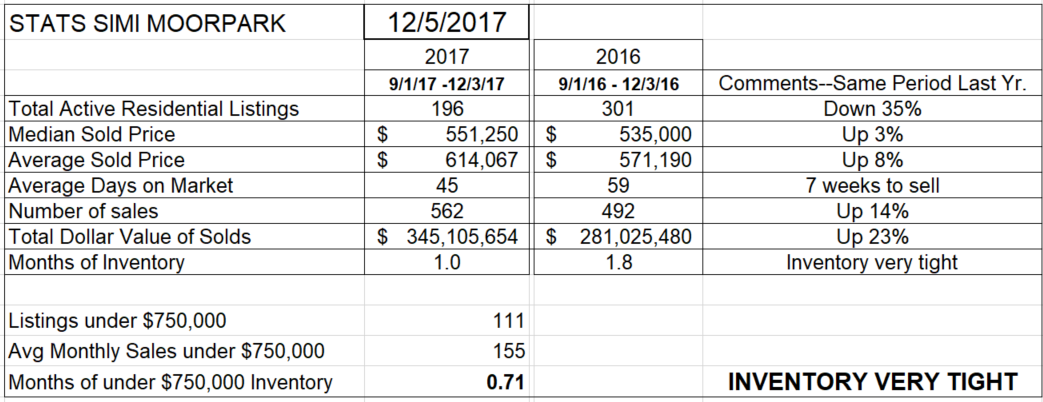
Same situation, the dark brown line representing 2017 displays the lowest inventory in 5 years, except for 2013. However, the inventory line now has dropped below 2013, making the inventory this year the lowest in 5 years. Compared to 2016, the inventory is down a whopping 35% from last year. But Simi/Moorpark inventory is very different from Conejo. 82% of their inventory is priced below $1 million. Based on the current level of sales, homes priced below $750,000 represent only 3 weeks worth of sales. It would be hard to describe that inventory as anything but extremely tight. If we had more inventory, could we sell more homes? Very likely. Now let’s look at the sales level, represented by the number of closed escrows each week.
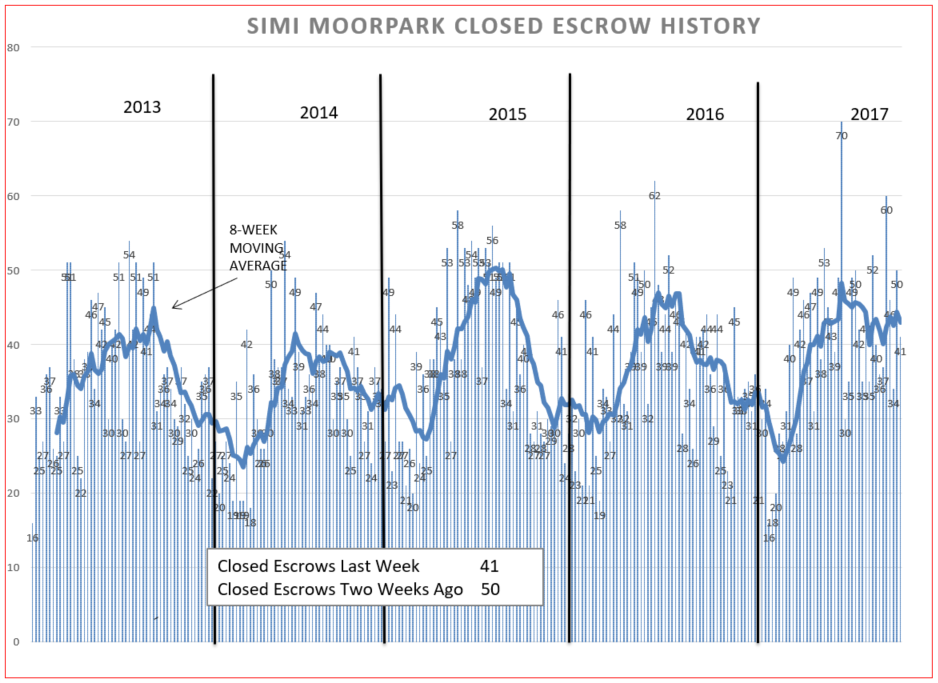
The peak reached in the summer is similar for the past three years. What is very noticeable about 2017 versus 2015 and 2016 is that the normal downturn in sales, that usually occurs in the middle of the year, is completely missing. Sales in November are continuing at a pace normally seen in August. We continue to wait to see the expected downturn in sales. This is a very strong sign that demand is not being met by the supply of inventory. Comparing sales in the months of September, October, and November in 2017 compared to 2016, the number of sales is up 14%. The law of supply and demand is screaming for prices to rocket upwards.
So you now have this strong scenario, even as compared to Conejo. The inventory is considerably lower than last year, sales are considerably higher than last year. With an inventory decrease of 9% in the Conejo and sales declining 1% versus last year, Conejo prices went up 9% (Median) and 15% (Average). In Simi/Moorpark the inventory is down 35% and sales are higher by 14%.
Now it is time for you to prognosticate. Where should prices be headed in Simi/Moopark? Certainly upwards, probably much higher percentage increases than in the Conejo.
What’s your guess?
OK, you now have your guess. Now let’s see what the record shows.
Median prices are up a close-to-inflation figure of only 3%, while Average prices are up only 8%. Versus 9% and 15% for the Conejo. With 35% lower inventory and 14% higher sales numbers. Color me confused.
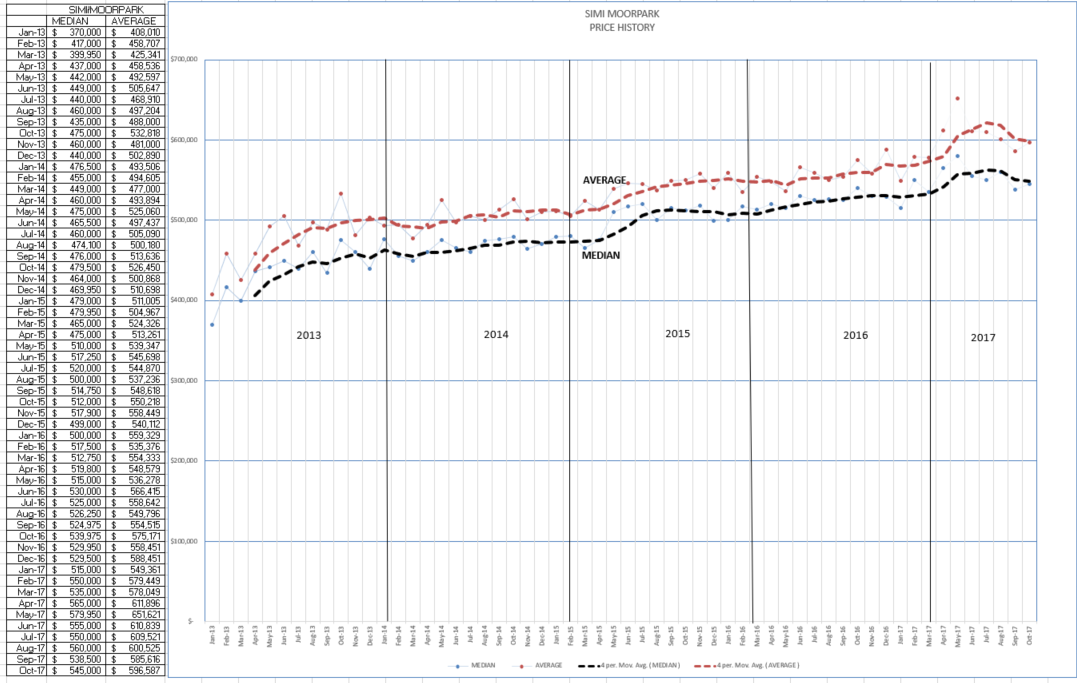
How can this be? Let’s look at the chart of prices. The chart below does not show averages over three months. It shows each month as a point, and the trend line is an average over 4 previous points. Compared to last year, prices have increased. But they took a summer bump, and are stabilizing at a lower level, more in line with inflation.
So there you have it. The Law of Supply and Demand works. Or not. Or maybe not yet.
This is what I think is going on. What do you think is going on?
One of my friends, Rick Gaviati, thinks Simi/Moorpark is different because most buyers who are trying to buy their first home are limited to what their mortgage approval allows, and are unable to bid more, even though they might like to.
What do you think? I would like to hear from you.
Have a wonderful holiday season, and may Santa leave hopes for an excellent 2018 under your tree.
Chuck