“Yesterday is history, tomorrow is a mystery, today is a gift of God, which is why we call it the present.”
Isn’t that a great quote? Obviously, this is not the first time this confluence of feelings has taken place.
Let’s take a look at how inventories behaved in 2017. Where they ended the year can be an indication of where they are headed in 2018.
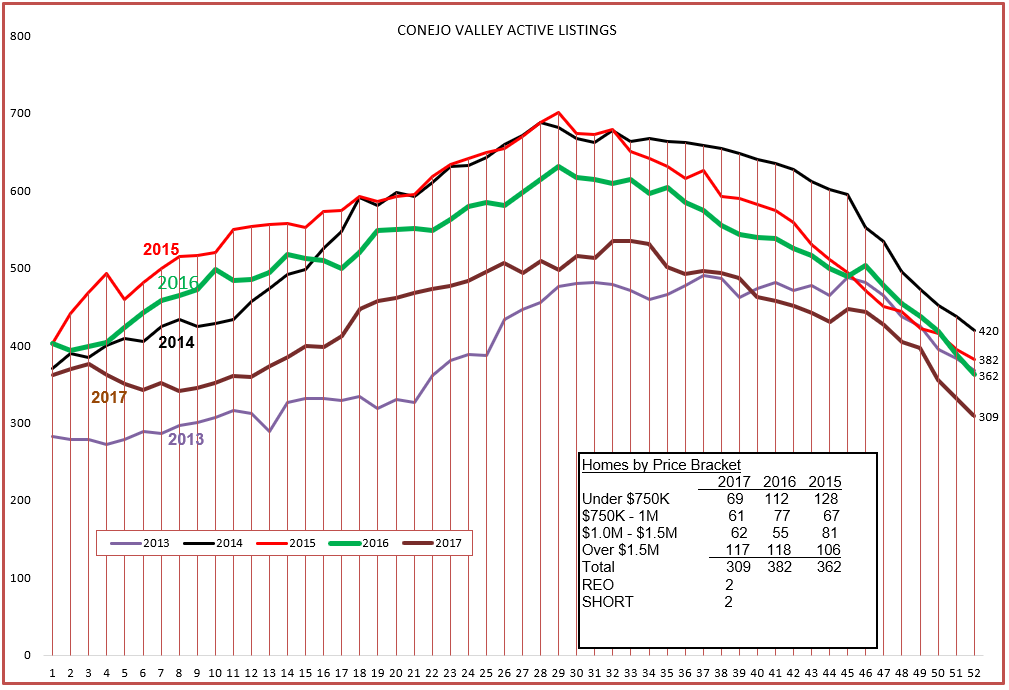
We ended the year with the lowest inventory in five years, almost as low as the number where we started 2013. The low inventory in 2013 produced a very strong upward price movement during the year. All else being equal, we can expect the same thing. But all else is not equal. Supply and Demand and Price now will be influenced by the new Tax Plan. This new major factor has been addressed by a lot of concern, but we won’t really know how it will effect home ownership demand until the market speaks. The tax plan least affects homes priced under $750,000, and as you can see from the box in the chart above, that segment has the lowest inventory numbers of all compared to the past two years.
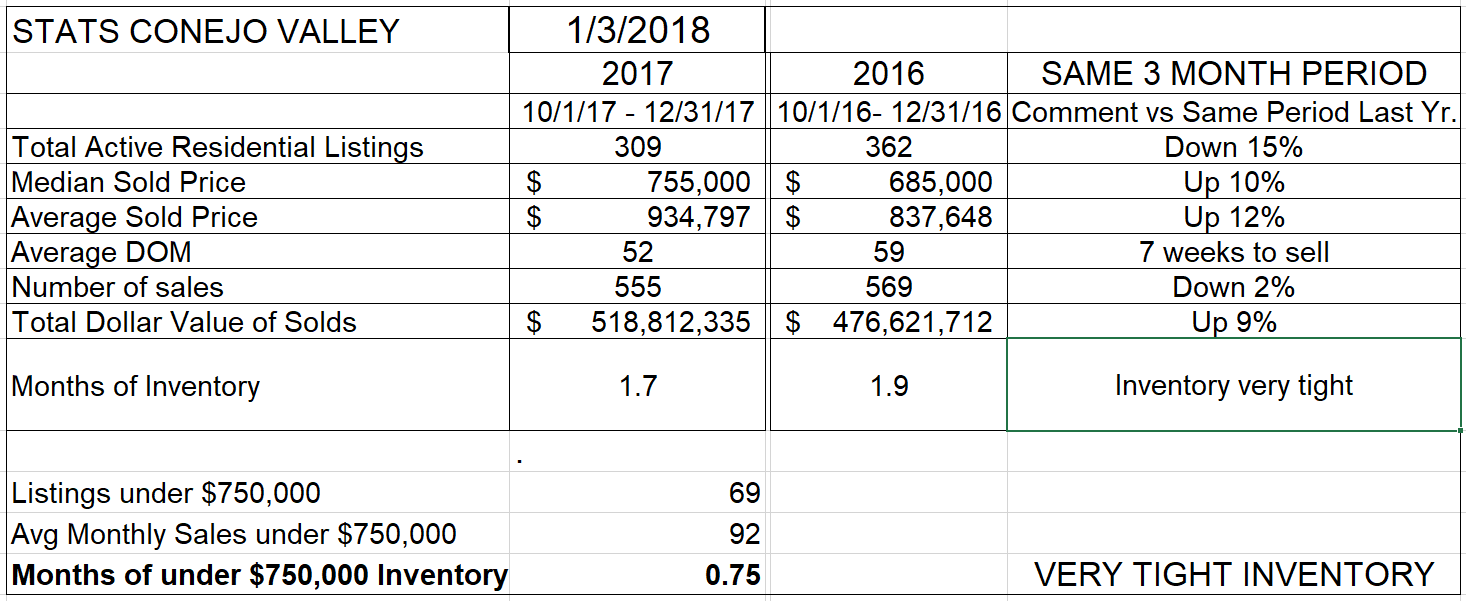
The low inventory (down 15% year over year) and relatively high demand (down only 2% in light of lower inventory and high prices) generated price increases of 10-12% year over year. Will this change? Will taxes make Conejo Valley homes less attractive? What do you think?
And notice the months of supply of homes priced below $750,000. Or actually weeks of supply. Only three weeks.
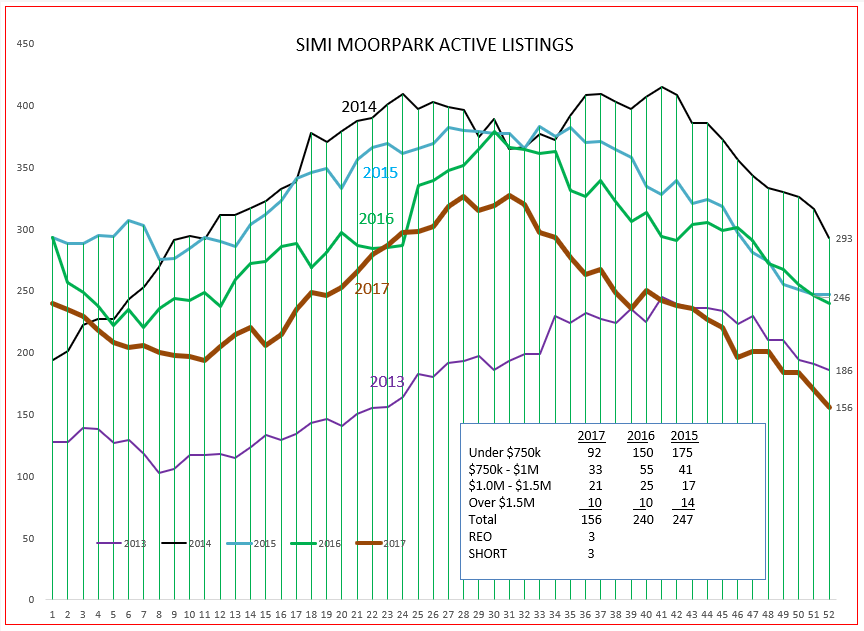
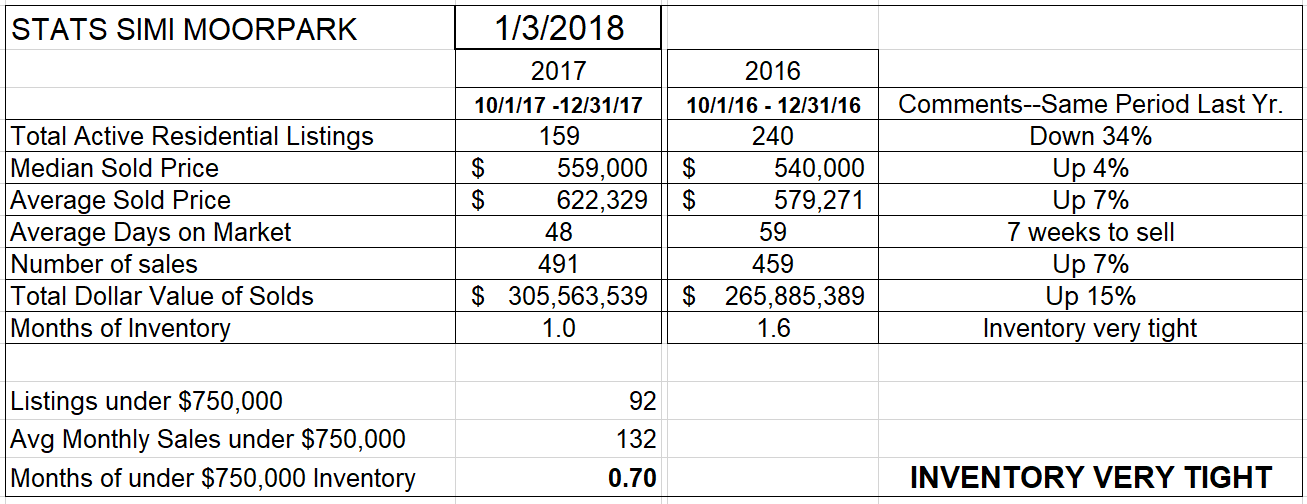
Similar comments can be made for Simi Valley/Moorpark that the inventory ended the year at the lowest level of the past five years, almost as low as the number where we started 2013. The forces for higher prices are even stronger than in the Conejo. As seen in the chart below, inventories are down 34% from the previous year, even with sales up 7%. Although these inflationary prices are stronger, prices only increased between 4-7%, lower than in the Conejo. Lots of pent-up pricing pressure here. The home values in Simi Valley and Moorpark are much more in line with the new tax bill numbers when discussing the potential restrictions on mortgage interest deductions.
Finally, let’s look at the charts of monthly prices. We tend to compare year to year, or this time this year versus the same period last year, but these charts show the monthly price movements as measured in median and average prices.
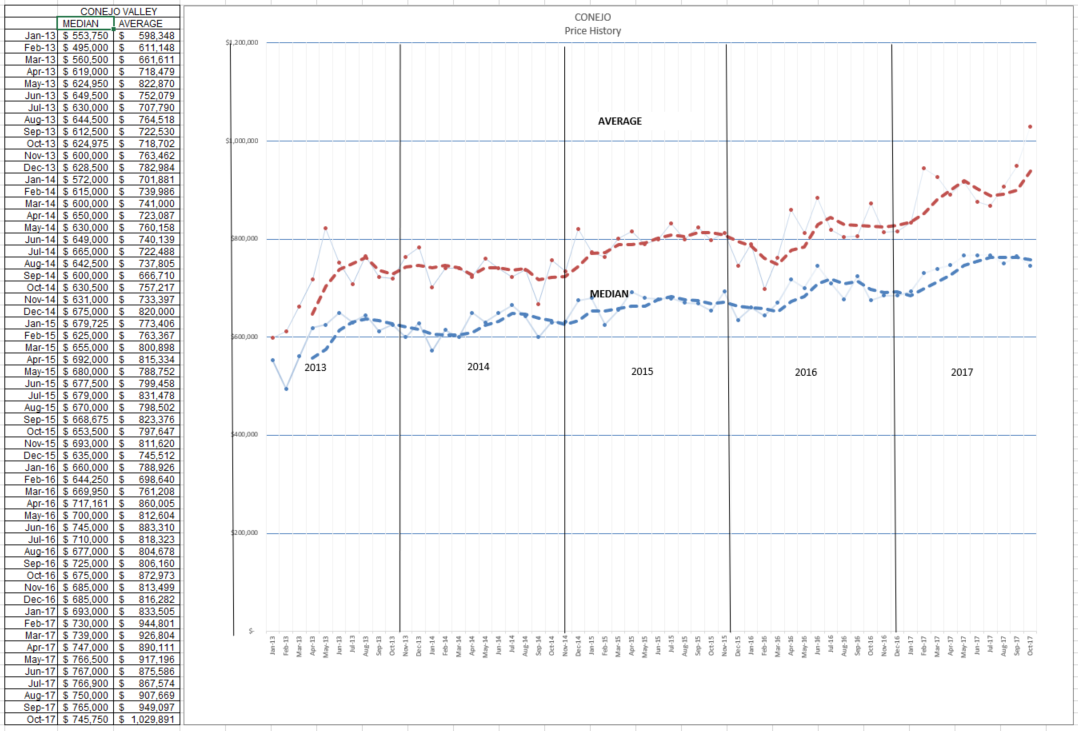
The average price is rising strongly, influenced by a large number of higher priced homes closing escrow. The median price, where half the homes are higher and half are lower, is much more moderate. You can look at the numbers and grab statistics that you want to use when you talk to clients. For example, since 2013, the median price has risen by $200,000, from $550,000 to $750,000, an increase of $40,000 per year on average. People want to know their home investment has done well. Letting them know they made, on average, $40,000 per year on their investment will bring smiles to their faces. This is also a good example to use when discussing renting versus buying.
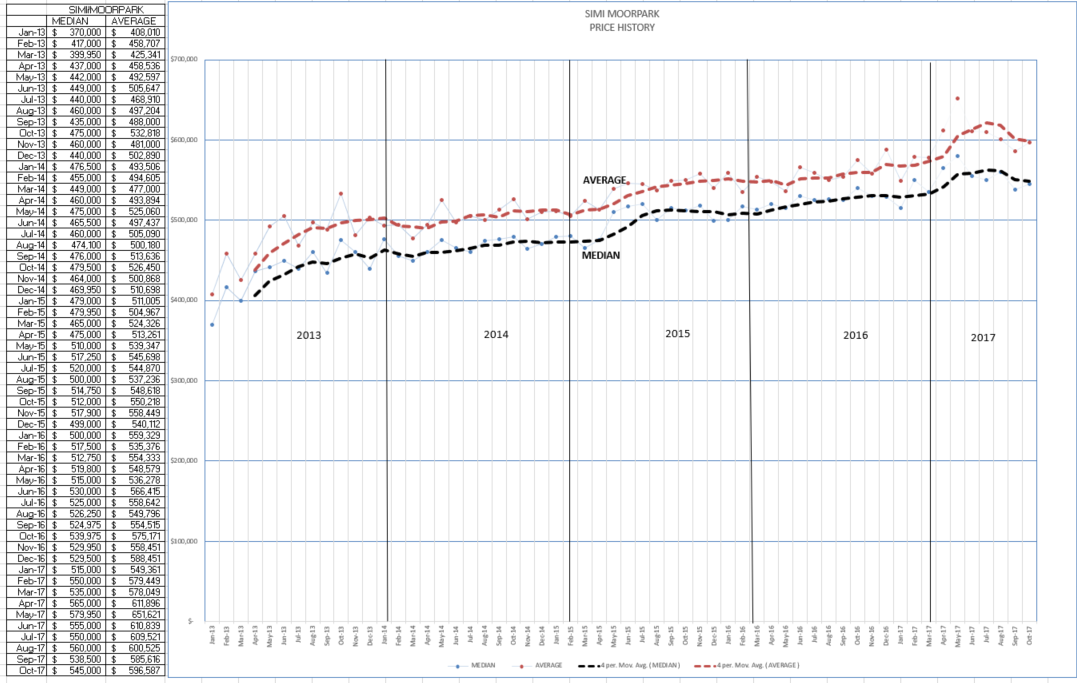
For Simi Valley and Moorpark, the average and median prices move more in lockstep, due to the larger segment of homes priced near the average and median price points. They have more expensive homes, but those homes represent a smaller percentage of sales.
SInce 2013, the median price has risen from $400,000 to $550,000, an increase of $150,000 over 5 years, or $30,000 per year on average. While the total dollar increase is not as high as measured in Conejo ($30,000 vs $40,000), the increase is percentage is the same, 37% over 5 years or 7% per year. Again, you can use this statistic in discussing home price appreciation with your clients. 7% per year appreciation over a five year history makes home ownership an excellent investment, and one you can live in.
This year will continue to be, well, interesting. Listen to the market more than the pundits. I don’t see any housing price crisis. In past years, we used to work at trying to explain how tax benefits of home ownership convinced people to buy rather than rent. It was always a difficult explanation, hard to put into real numbers. Based on today’s market, there is a shortage of place to live. This will push housing prices higher, and this will push rents higher. Unemployment figures are solidly in the area that most economists consider full employment. Inflation is about to happen. Wage inflation will make these high home and rental prices more affordable.
Will this be a good year? It looks like it. The market will tell us, be sure to listen to what it is telling you.
Have a prosperous year.
Chuck