Many industries have charts which portray history. Some people, “chartists”, use these charts to try to foretell the future. Commodities brokers often do this, looking for a “head and shoulders” to give them indications of the right time to make a strategic investment.
Of course, not everyone believes in forecasting with charts. They believe in fundamentals.
My charts say things are slowing down.
Then there is the present, daily reports I hear from my agents. Open houses are still extremely well attended, multiple offers, full price offers and more.
Which one to believe? What is going on?
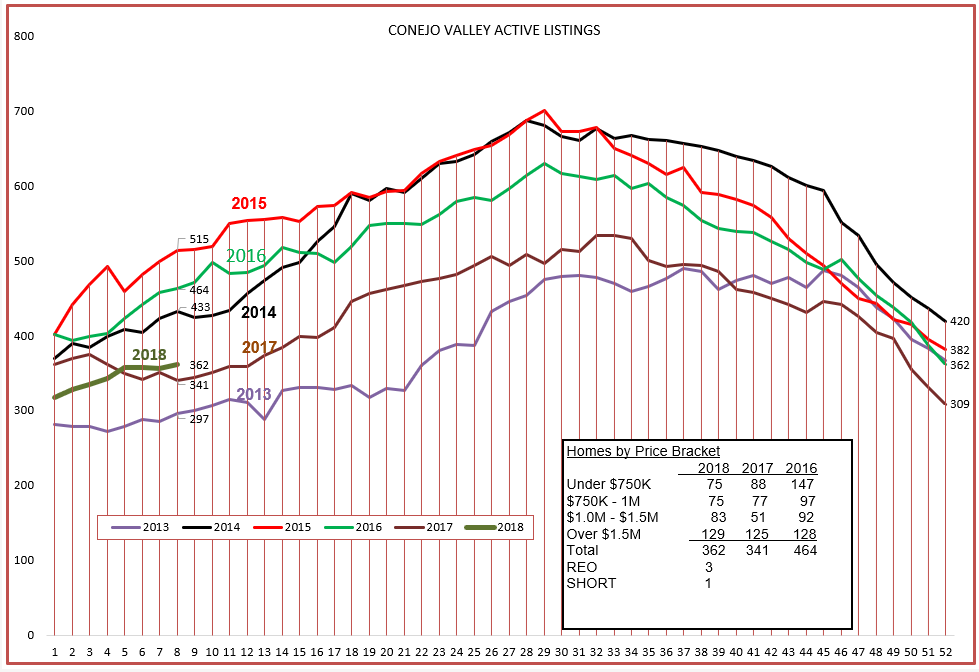
First, the inventory. Certainly no indication of trouble here, unless you are looking to buy a house. The inventory remains low, as low as last year, as low as a very low 2013. And no indication that the inventory is growing. If the inventory grew strongly, we would be concerned that the market is slowing down.
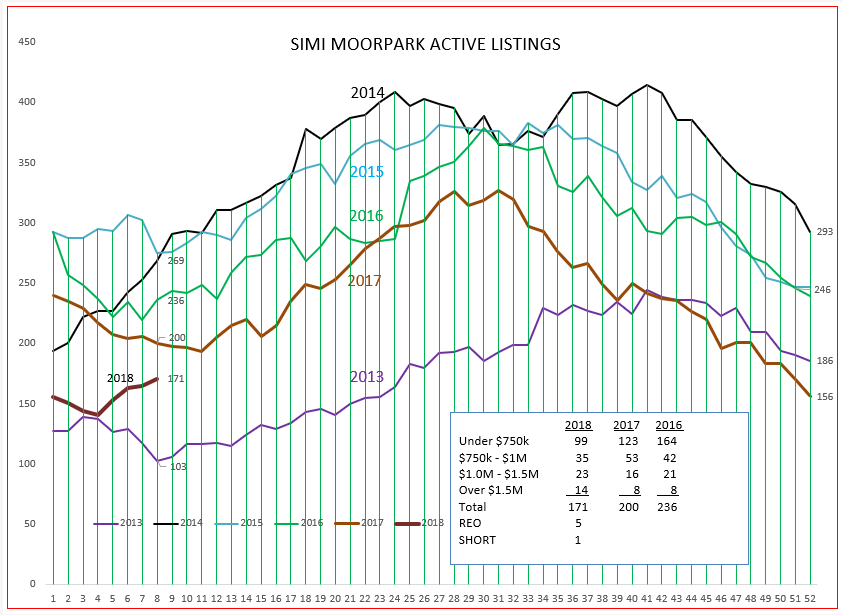
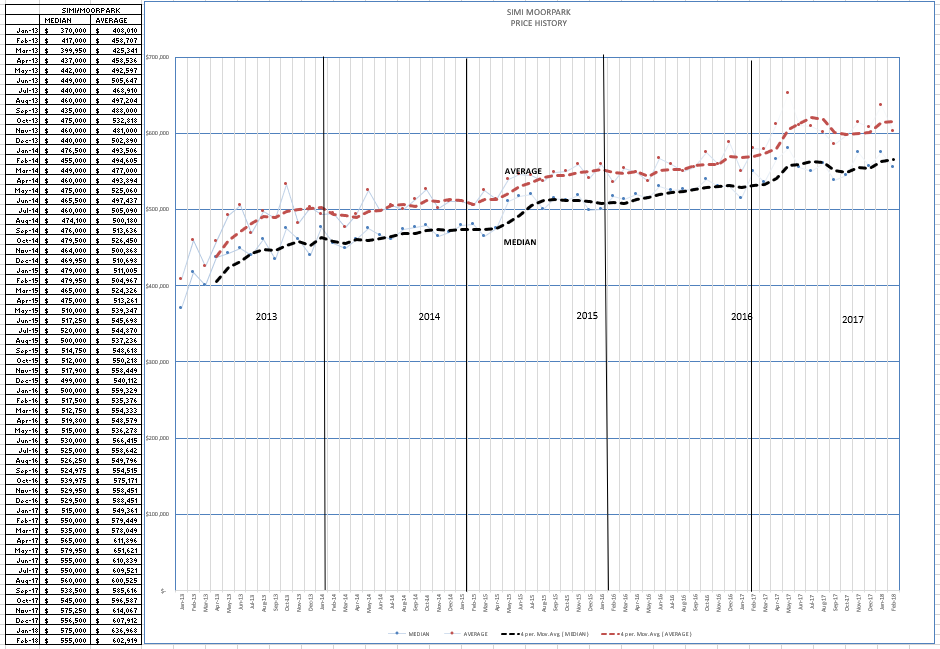
The same is true of Simi Moopark. In between 2017 and 2013 figures. A low inventory. Nothing here to indicate a slowdown in the market, although the slope of the line is strongly upwards. Chartists may worry about that.
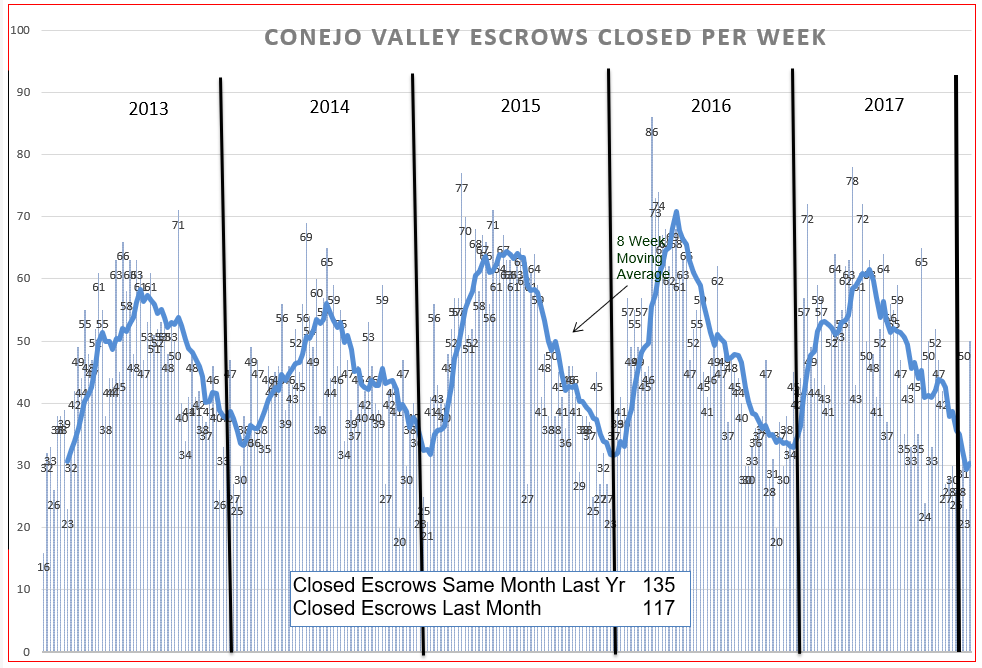
What about sales? The heavy line below is made up of individual points that represent the average of the previous 8 weeks. Otherwise, the points would be all over the place, haze of points, week to week. The end of the month, with the strong push to close escrows, would be very high. The beginning of the month would be lower. Taking an 8-week average smooths out the data and gives us a more reasonable picture of what is going on. Graphically, we can see that the tip of the current line is the lowest in the past 6 years. That gives us pause to think. Yes, sales are declining, as they usually do this time of year. But is this dip, lower than previous years, due to a slowing of buyer interest, or is it due to the lack of inventory available to buy?
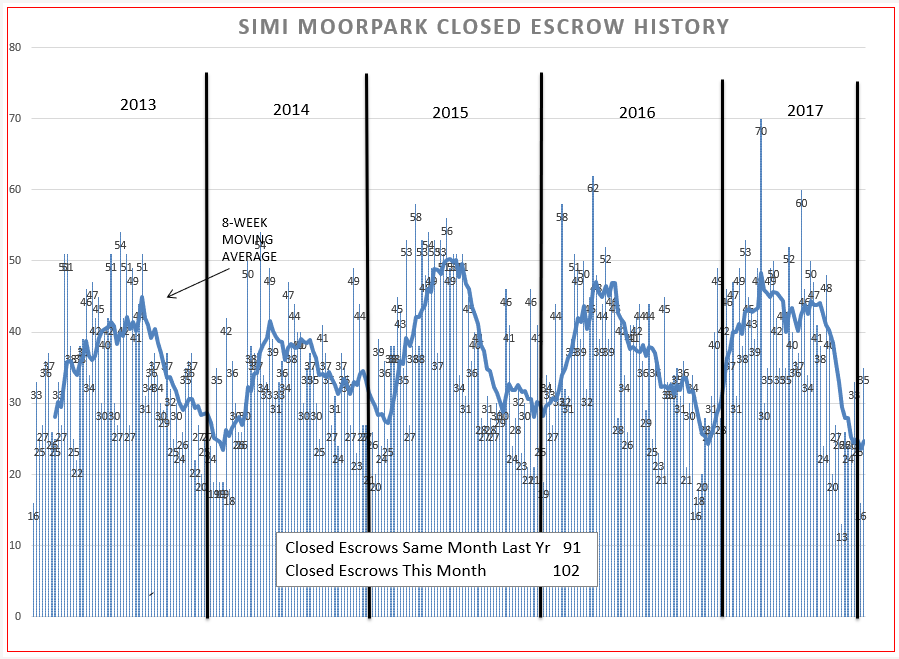
The same with Simi Moorpark. Simi Moorpark had a very strong sales year. It is measured not by how high the 8-week line goes, but by the area underneath the line. For 2017, that area was very wide, sales were strong over a long period of time, a plateau rather than a peak. Strong sales. But followed by a dive in activity, currently also lower than previous years. Low inventory or lack of interest in purchasing?
Keeping these graphs in mind, let’s now look at the actual numbers. The inventory is up 6%. Growing. Median prices are up 6%, lower than the figures (10%) recently reported by others. All real estate is local. But the Average price is the same as it was this time last year. That is due to the mix, more lower priced homes, less higher priced homes. That is why statisticians usually favor the Median prices. The number of sales is down 3%. Sales down, inventory up.
The computation for Months of Inventory is the inventory divided by the sales. Inventory up 6%, sales down 3%. Higher inventory (the numerator) divided by lower sales levels (the denominator) gives us a higher number. 2.4 months of supply is not outlandish, but this number has recently been growing. Again the question, is the slowdown in sales due to lack of inventory or lack of interest?
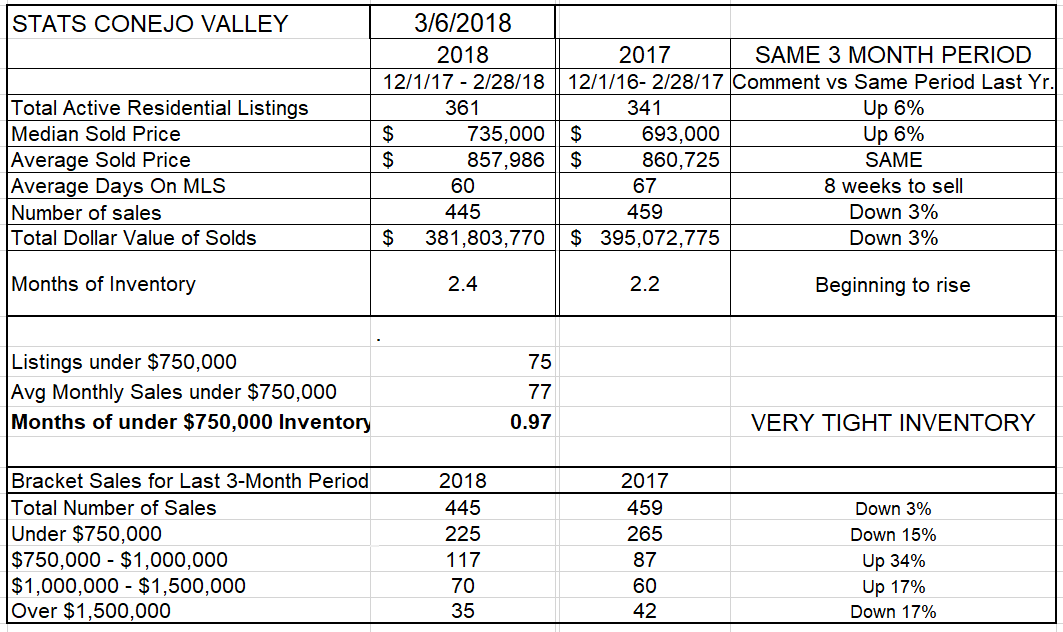
A new addition to the table breaks down the sales numbers by brackets, and compares the numbers to last year. Sales have increased in the $750,000 to $1,500,000 brackets, and are down in the lowest and highest brackets. For Conejo, this is mainly due to the average pricing levels for homes. For this year, 40% of the homes are sold in this level, while 50% were sold in the lowest bracket. Last year, 57% of the homes were sold in the lowest bracket, and 32% in the bracket $750,000 to $1,500,00. The consistent increase in prices has moved sales into higher brackets. Still, sales are down 3% overall. Is that significant, should we be worried?
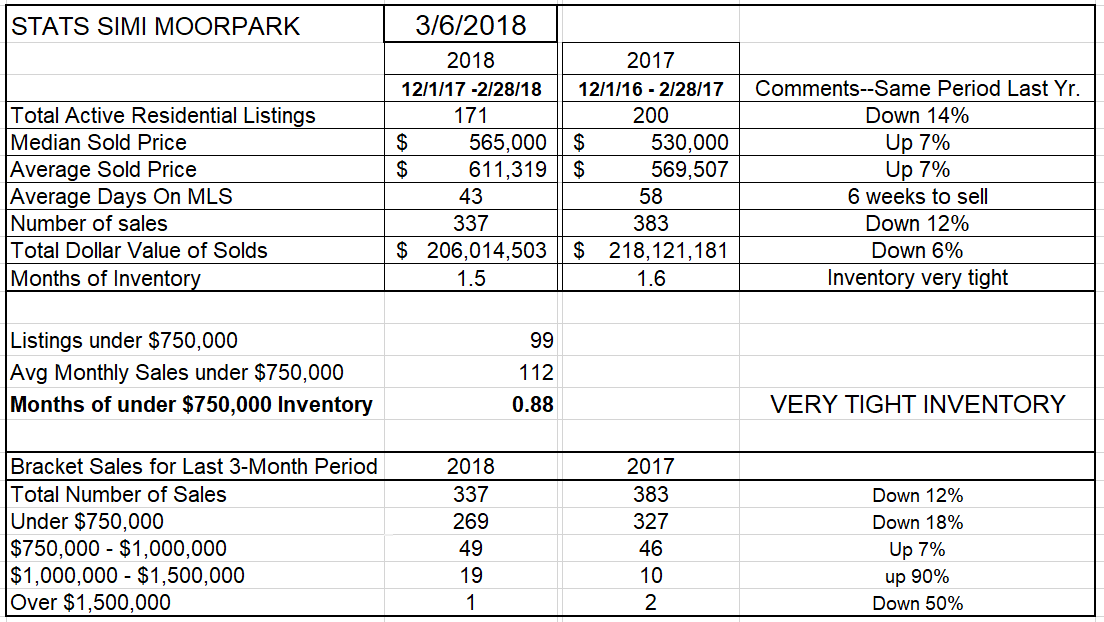
Simi Moorpark sales are predominantly (80%) in the under-$750,000 bracket, and those sales were down 18%. Sales in the higher brackets are not as significant, and sales for the entire market sales are down 12%. With inventory down 14%, this supports the idea that if we had more homes we could sell more homes. The months of sales remain very, very low at 1.5 months.
With inventory so low, and sales so strong, we would expect prices to skyrocket. A 7% increase is very strong, but not a skyrocket. Skyrockets rise quickly and then explode, or some prefer the term bubble. The foundation for higher prices is very strong, yet they have risen reasonably, so no bubbles appear to be in our future. However, there still is that steep decrease in sales on the charts.
Lastly, let’s look at prices over the long term.
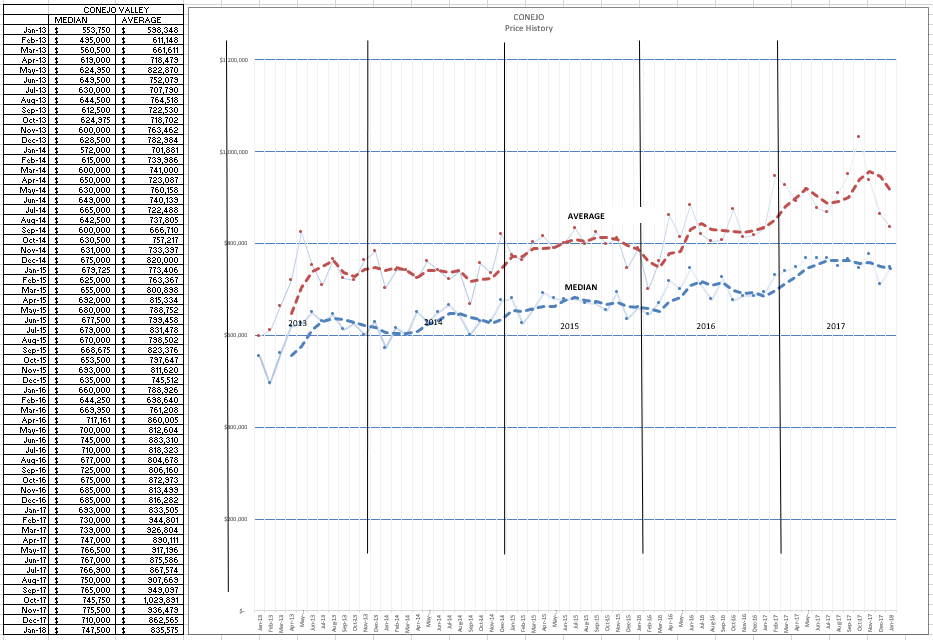
For Conejo, you can visually see the dip in the average price, but the median price is receding also. Comparing that chart to Simi Moopark below, their steady increase continues.
So what is the final result of all these charts and figures?
The market remains healthy. It is under control due to lack of housing in general. There are a lot of factors preventing us from being certain about the future.
One is inflation. Inflation will be increasing in the coming months, prices will be going higher. With the tax bill creating major deficit spending, added to the recent budget increase creating even more pressure, there will be lots of need for borrowing by the government, and that will cause interest rates to rise. The Fed will have to figure out how to deal with this inflationary pressure. They usually do that by raising rates. There does not seem to be any reason why inflation should not take hold and rates rise. That will influence mortgage rates, and that will create a problem in affordability for home buyers in the future.
When is the best time to buy or sell? Probably right now. And, according to my agents, a lot of home buyers feel the same way.
Have a wonderful month.
Chuck