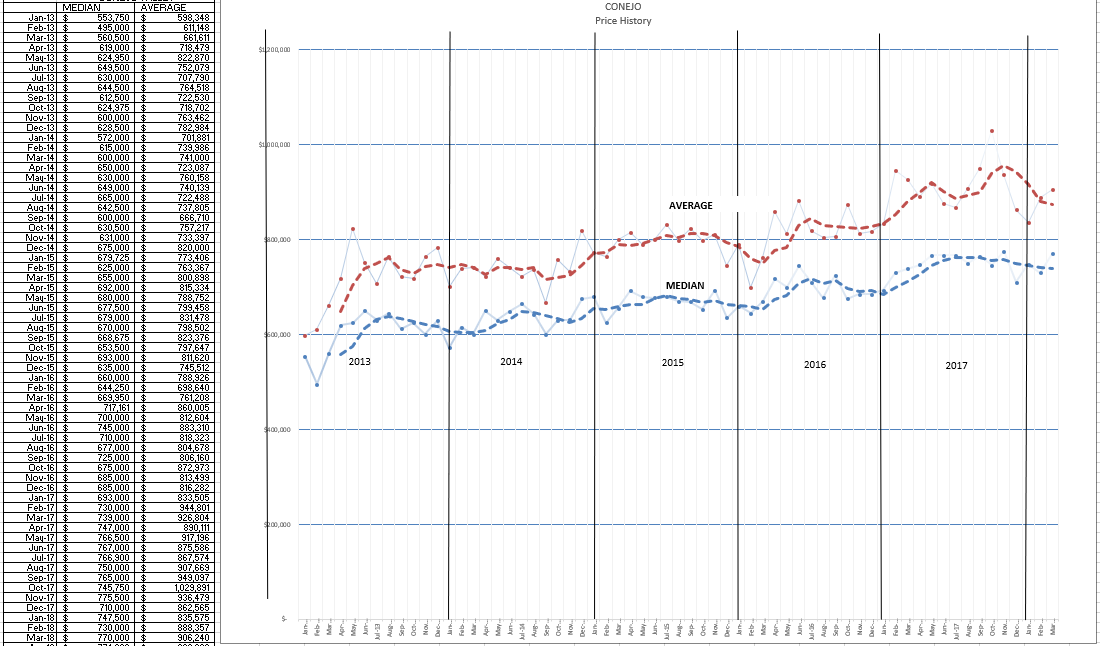
Economists tell us there is a relationship between inventory, demand, and price. Usually we analyze inventory and demand, with the resulting pressure affects the price. In the past few years, we have had low inventory and high demand, as expressed by sales. Prices have been rising, but nothing out of control, more in line with normal inflation.
Our inventory has been so low that we postulated a lack of inventory was actually a governor on sales. If we only had more to sell, we would sell more.
The way to test that hypothesis is to change the variables. This year has done that for us. Inventory has been growing. The ability to sell more homes is now available. Have sales gone up, now that we have more to sell? That theory has been blown out of the water. Based on the three months of February, March, and April, this year compared to last year, our inventory is up 16%. But instead of sales going up, sales for that period went down 12%. To measure inventory by comparing the strength of sales against the inventory available to fulfill those sales, we divide inventory by the average number of sales per month, and we see a figure climbing to 2.7 months, versus 2.1 months last year. Actually, for the past many years the months of inventory figure has hovered around 2.1 months. These figures all combine to show a definite slowing in the market.
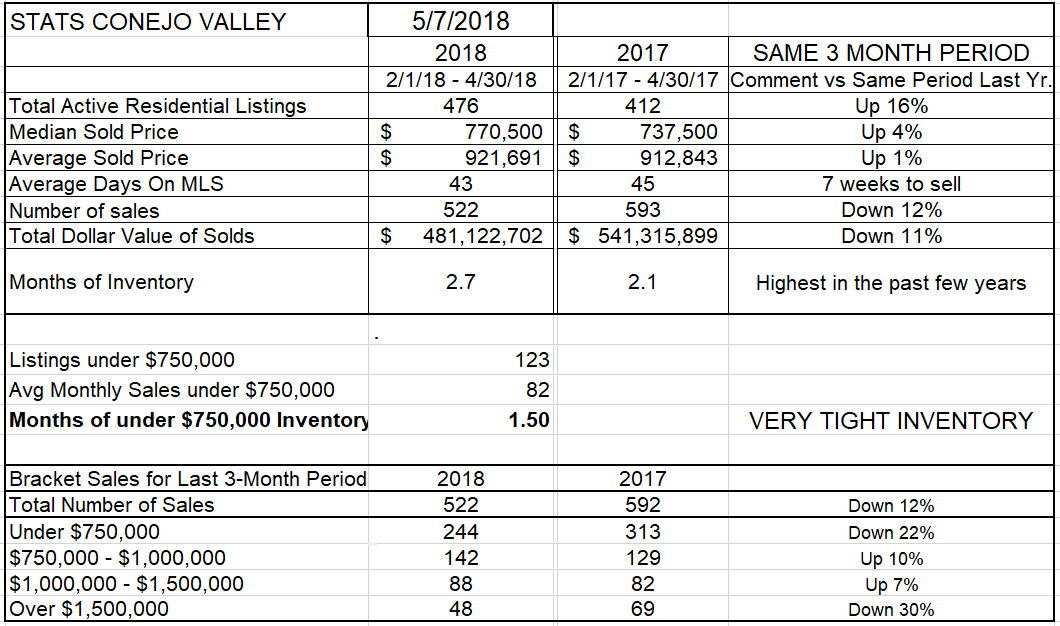
We thought prices would surely increase, but they have been anemic, with median pricing up 4%, and the average only up 1%. The difference between average and and median prices is dependent upon the price mix. Look at the bottom of the above chart to view how my four price categories have changed, again comparing 3 months this year to three months last year. The low priced tranche is down 22%, and the highest is down 30%. The real selling action is in the two middle areas, up 10% and 7%. Housing inflation is under control, there is no bubble, and the reason for prices not going up dramatically is due to supply and demand, 16% higher inventory and 12% lower sales.
Tha’s the Conejo Valley story. Is the same thing happening in Simi Valley and Moorpark? No, not as far as inventory and sales are concerned.
The Simi/Moorpark inventory is not up, but down 14%, a total reverse of Conejo. And sales are down 4%. Considering the lack of inventory, it could be limiting sales. And if we had strong demand, and not enough inventory to fulfill that demand, prices would be climbing strongly. Prices are up only 1%. Not even equivalent to general inflation. Is there enough inventory? The Months of Inventory calculation is only 1.4 months versus 1.5 months last year. If we continued to sell at the current rate and no listings were added, we would be totally out of inventory in a month and a half. And for homes priced in the lowest price tranche, the inventory only represents one month worth of sales. That is still a strong market when considering those factors.

Looking at the different price segments, comparing sales figures in 2018 versus the same three months of 2017, the largest segment of sales is down 2%. There was a jump in the $1 million to $1.5 million area, but the inventory and sales are so low as to make it hard to analyze correctly.
To complete the report, let me show you the graphs of inventory and sales, as measured by closed escrows.
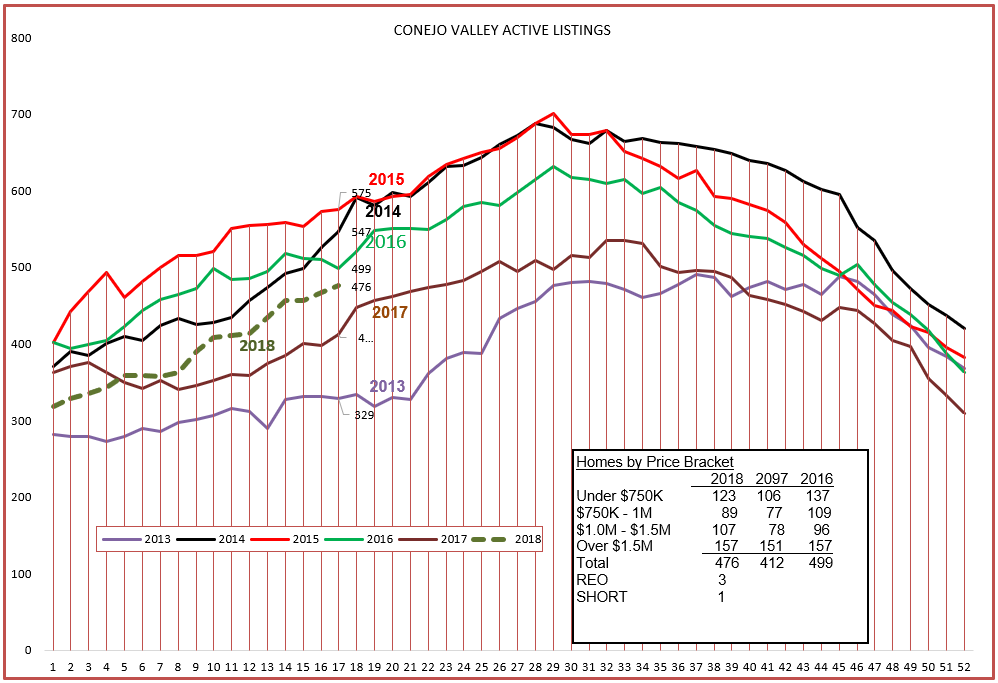
For Conejo, a normal curve for the year, with inventory climbing as we approach the summer months.
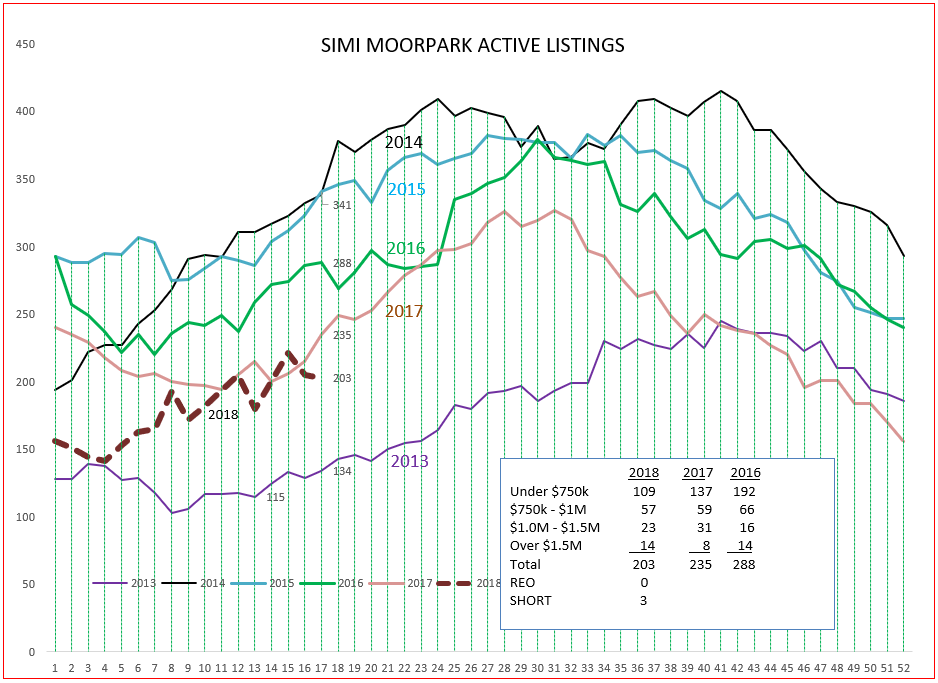
For Simi/Moorpark, a zig-zag course, currently the lowest since 2013.
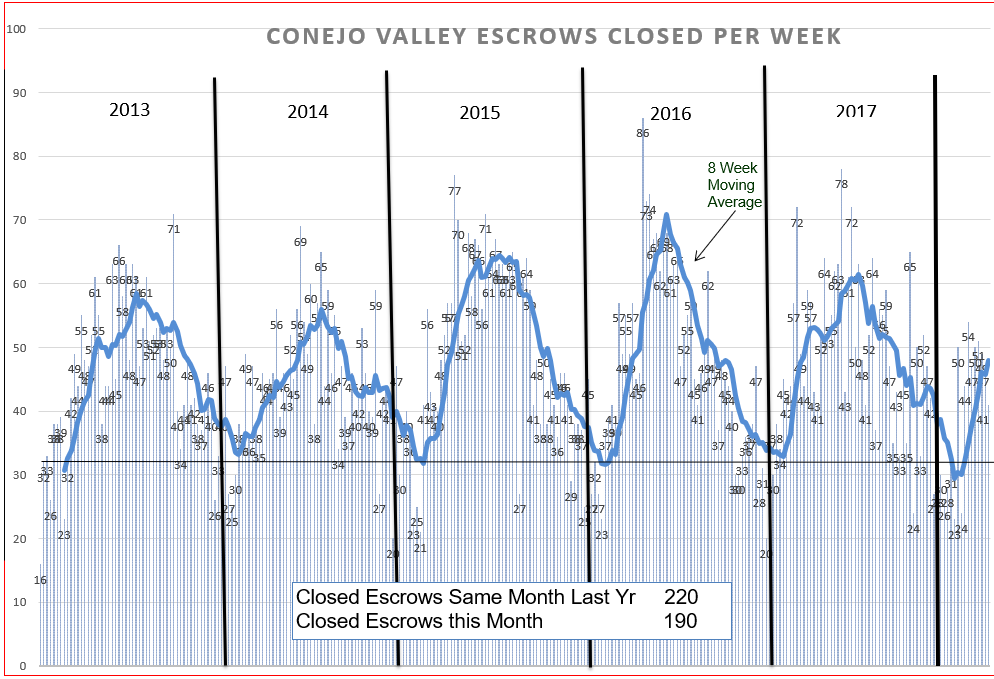
For Conejo, note that sales dipped below the average for the past 6 years, lower inventory, 190 sales in April 2018 versus 220 sales in 2017.

And for Simi/Moorpark, sales that fell off dramatically at the end of 2017 and then climbed dramatically at the beginning of 2018.
So what do we tell people when they ask us that question, “How is the Market?”
The market is strong, but not quite as strong as last year. Prices are up from last year, but only 2-4%.
Mortgage interest rates are increasing, but no higher than they have been for the past 20 years. The limitations on mortgage deductibility are most likely a factor.
Factors on the good side: unemployment is the lowest since the 1960s. The economy is growing, consumer confidence remains at its highest level in a generation. Millennials are entering the market to buy, and seniors are looking to downsize. Owning a home has long been the best investment for the vast majority of Americans. But all real estate is local. There are hot markets and cool markets. First neighborhood is hot, Dos Vientos is cool. It all depends where you live, and where you want to live.
Where do you live?
Have a prosperous month.
Chuck