There are a lot of statistics printed every day that provide insight into the real estate market. Some are national, some are statewide, some are countywide, and some are more local. They all provide statistics that are based on recorded sales and the Multiple Listing Service (MLS). While the data is very reliable, and is the same data used by almost everyone, there is a science, and maybe an art, to how the data is sliced and diced and turned into a report.
According to NAR (Lawrence Yun), the Median price of a home in the U.S. is $258,100.
The Median is the price at which half the homes sell for more, and half the homes sell for less. The Median tends to be more useful than the Average, which is all the prices of all the homes sold divided by the number of homes sold.
In California, that $258,100 is the price for maybe half a house.
According to CAR (Leslie Appleton-Young), the Median price of a home in California is $575,800.
Dilbeck was recently privileged to have Leslie Appleton-Young present her 2019 forecast to our company of agents. Since it is published by many, many news sources, I am also publishing it here. While it may be interesting to read about the number of single family home resales and the affordability index, most of you will be attracted to the Median price and the percentage change in that price, from year to year.
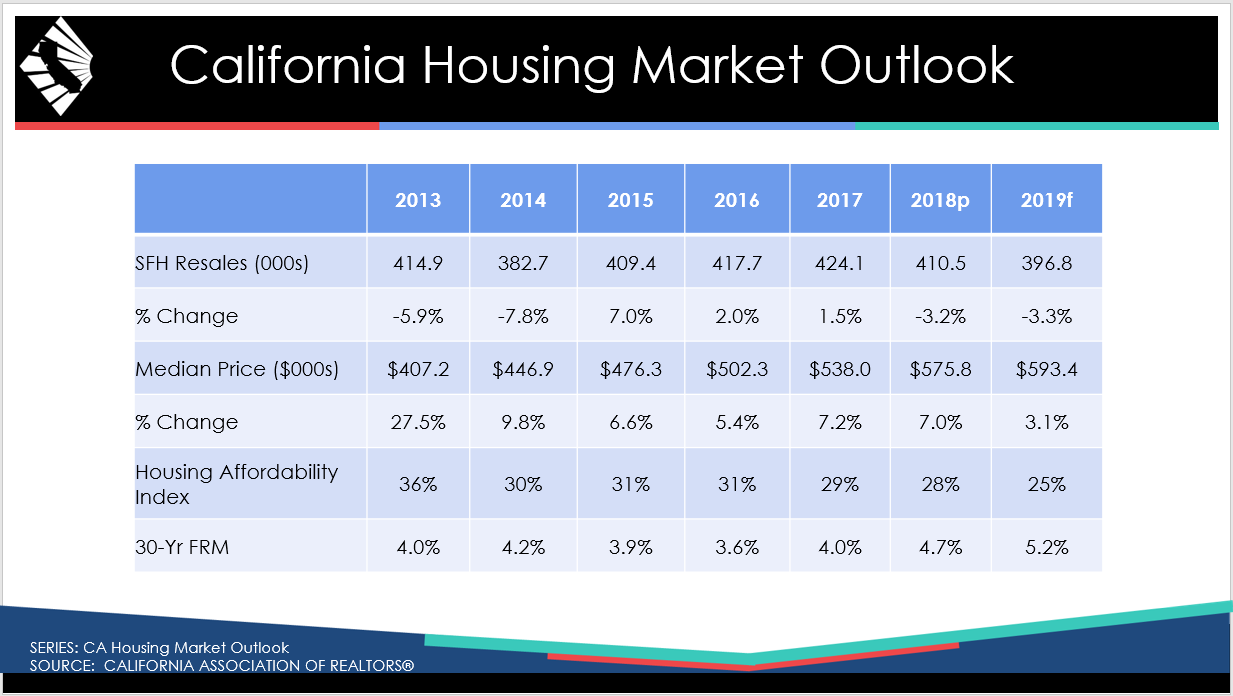
As you can see, the percent change has been very strong, particularly when viewed against a fairly stable inflation rate of only 2% per year. Real estate has done very well indeed. But why is the forecast for price appreciation for 2019 only 3.1%, less than half the previous two years?
The answer lies in the word we usually use to describe real estate, “Market”. Markets have ups and downs, and are affected by an enormous number of factors. That is why we go to the most respected economist in California Real Estate, Leslie Appleton-Young, and let her consider all the factors, and provide us with a forecast.
Perhaps the most interesting number is the forecast fora 30-year fixed rate mortgage. Compared to what we have been used to for the past 8 years, that seems a little high. It isn’t, not when you consider longer past history. The chart below is from Freddie Mac, a government-owned corporation that buys mortgages and packages them into mortgage-backed securities. Its official title is the Federal Home Loan Mortgage Corporation or FHLMC. Banks sell mortgages to Freddie and then use the funds received from Freddie to make new loans to homebuyers. The numbers below are from November 1, 2018.
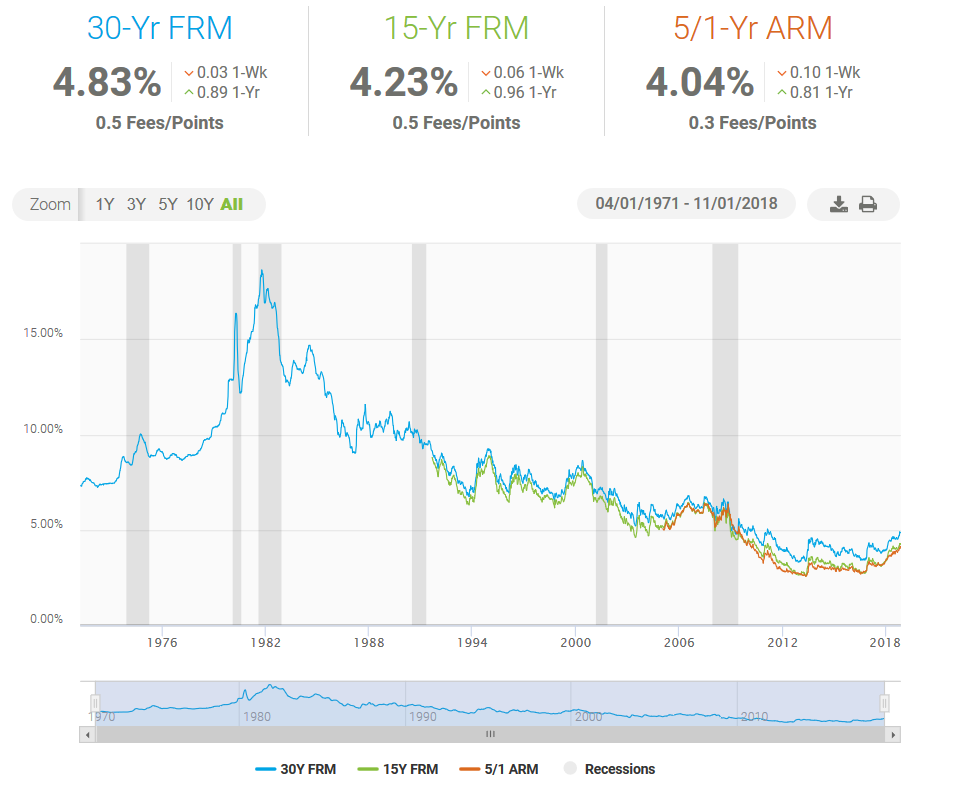
So you can see from past history that today’s mortgage rates are still very low. This is an influence that makes home ownership attractive that too few pay attention to. For what else can you get a 30-year fixed rate loan, a loan that basically freezes your living costs (your rent) for 30 years? Compare that to the home appreciation on the chart above for the past few years. If you come across a safer investment please let me know. And, you can live in your investment.
Now, back to the numbers in the forecast. Why do you care what home prices are doing in the U.S.? Why do you care about what home prices are doing in California? What you really want to know is what your house is worth. If you buy stocks, that is easy to find out. You can look online or in a newspaper, the prices are published. One share of stock is exactly like all the other shares of stock in a company. They are all worth the same. But your house is one-of-a-kind, there is not another house like it. They may start out the same when a development is built, but over time they change due to many factors. And it depends on where it is. ALL REAL ESTATE IS LOCAL.
Anyone putting out statistics about housing knows this, and you should know it. The only good way to get an idea what your individual home is worth is to get an estimate from a realtor that really knows your area. And even then, it is only an estimate. The only way to really find out what your house is worth is to actually sell it after offering it to a large amount of buyers. All these statistics that we talk about start with you. Individual sales provide the information which all these economists utilize.
Now that you understand how things work, let me analyze our particular marketplaces, drilling down from those state numbers into our neighborhoods.
What is our Median price? Again, depends on where you live. Let’s look at both valleys.
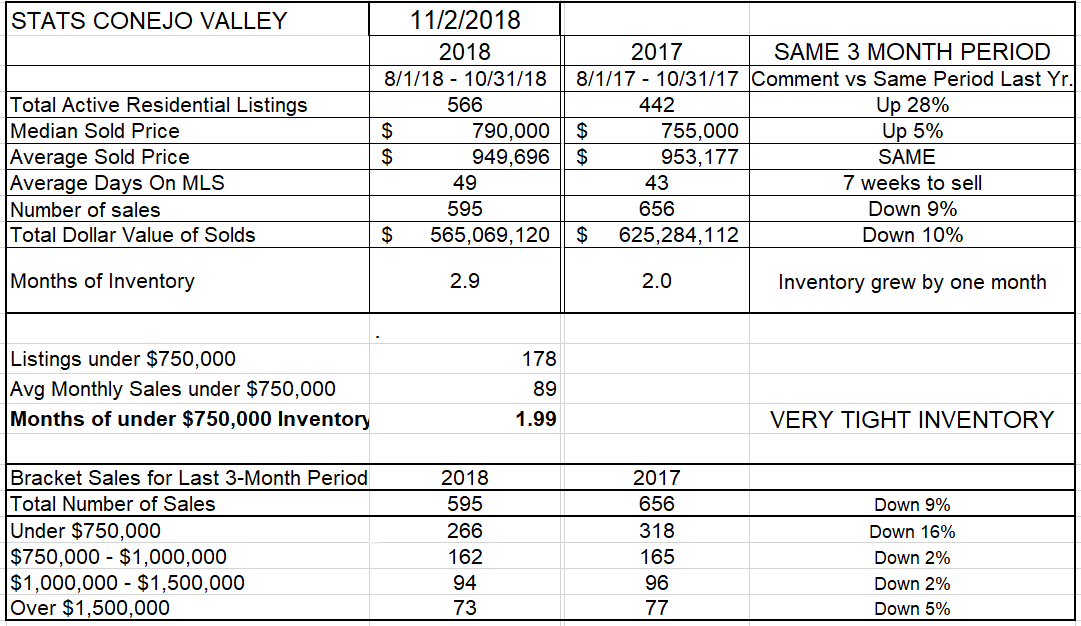
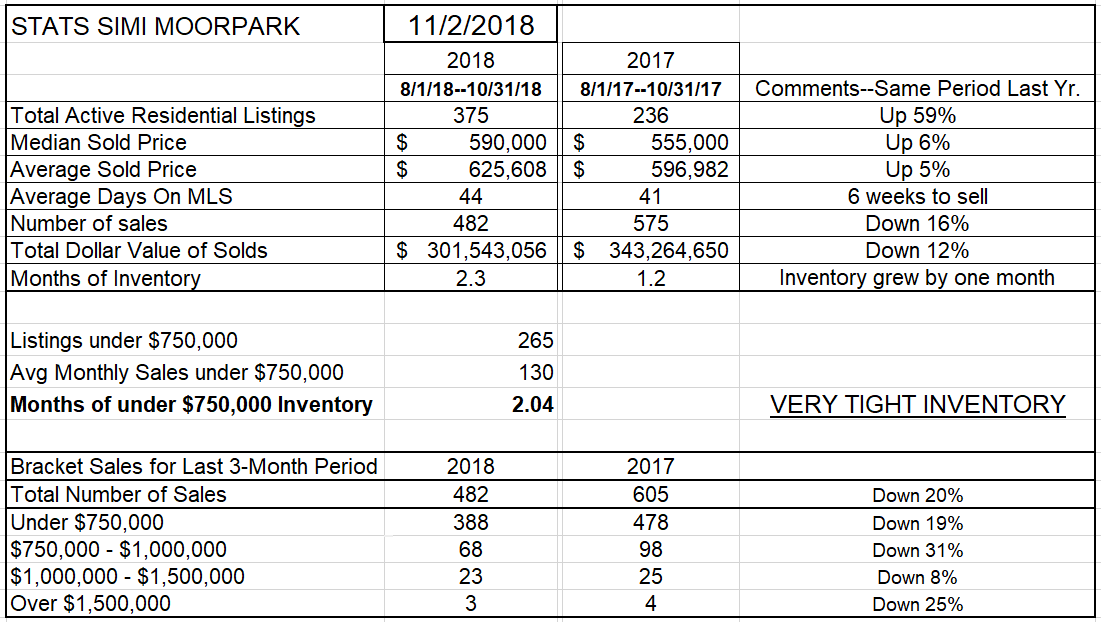
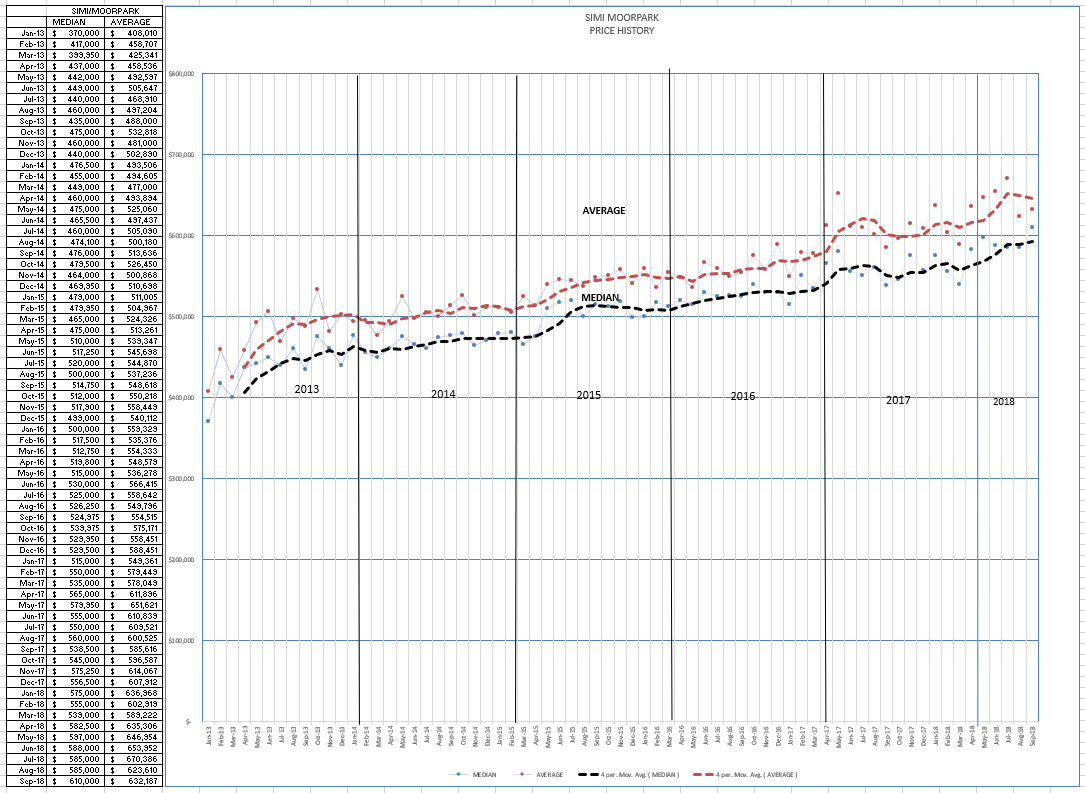
If you live in the Conejo Valley, the Median price increased by 5% from last year, and is now $790,000, much higher than the California Median of $575,800. If you live in Simi Valley/Moorpark, the Median price increased by 6% from last year, to $590,000. Why are they different? As realtors say, when describing what is important to home pricing, Location, Location, Location. But it’s not just the location in a valley, or in a city, or even in a development tract. Your home value is literally determined by your neighbors, the ones who recently bought and sold in your area.
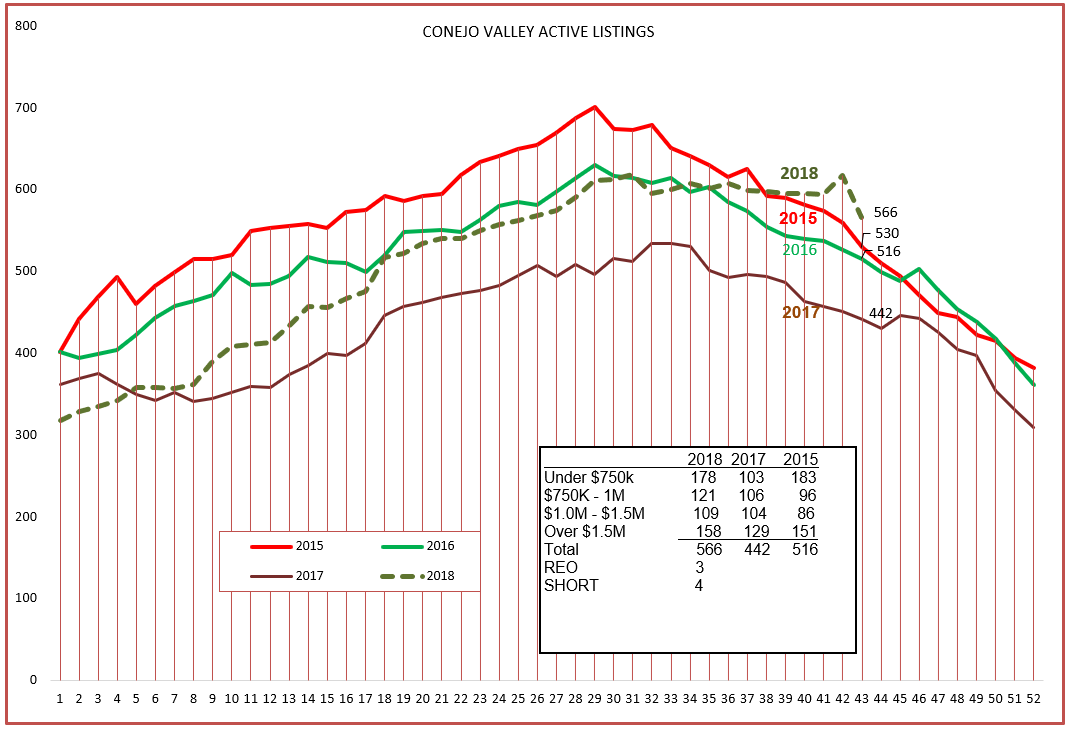
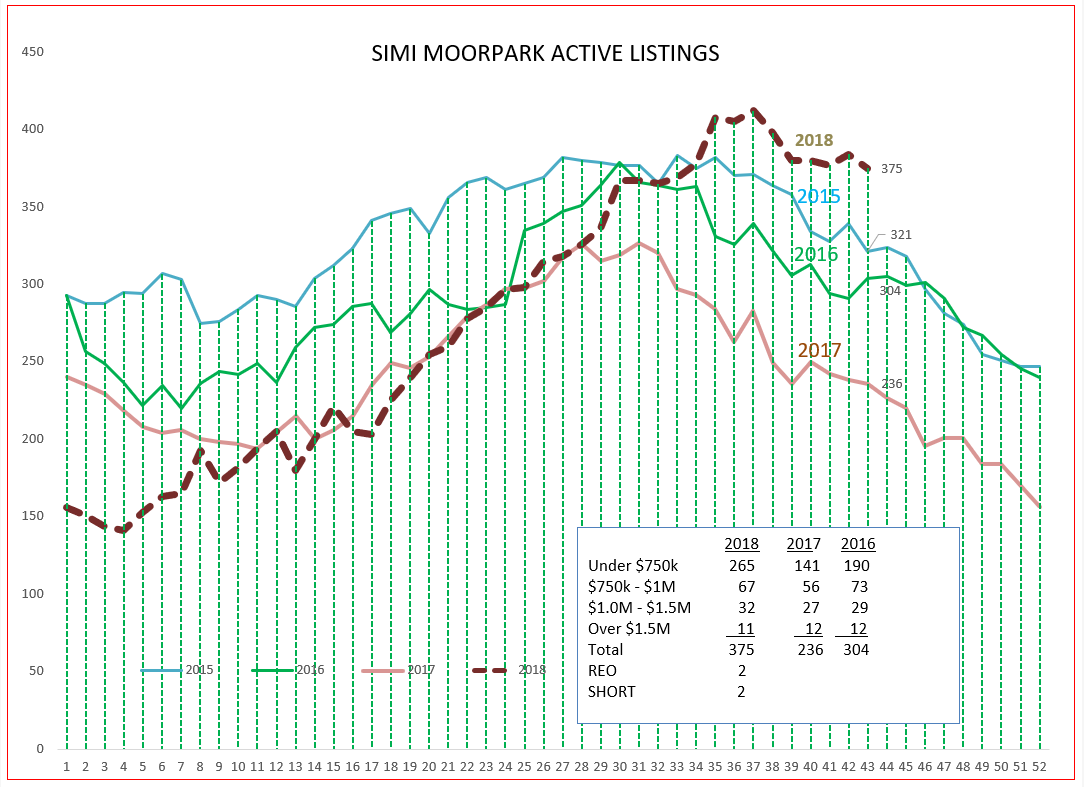
The market is slowing down. There are fewer homes being sold compared to a year ago (10-12% fewer), there is more inventory to choose from today than there was a year ago (28-59% more). That slowdown in sales and the increase in inventory follows the law of supply and demand. Housing price appreciation has recently slowed down. That’s healthy, we don’t have to worry about a “bubble”.
Perhaps the most graphic way to see this slowdown is to look at the inventory level of homes for sale. In Conejo, instead of decreasing as is usual this time of year, the inventory stayed strong, 28% higher than last year. When owners put their homes on the market, and buyers decide to buy less, the inventory increases. Simi Valley/Moorpark reacted the same way, but the numbers were more radical, 59% higher than last year. Not a crisis, just what is happening.
The result of all this should be a softening of prices, of the market. Sometimes that takes some time to take effect. Let’s see what is happening right now.
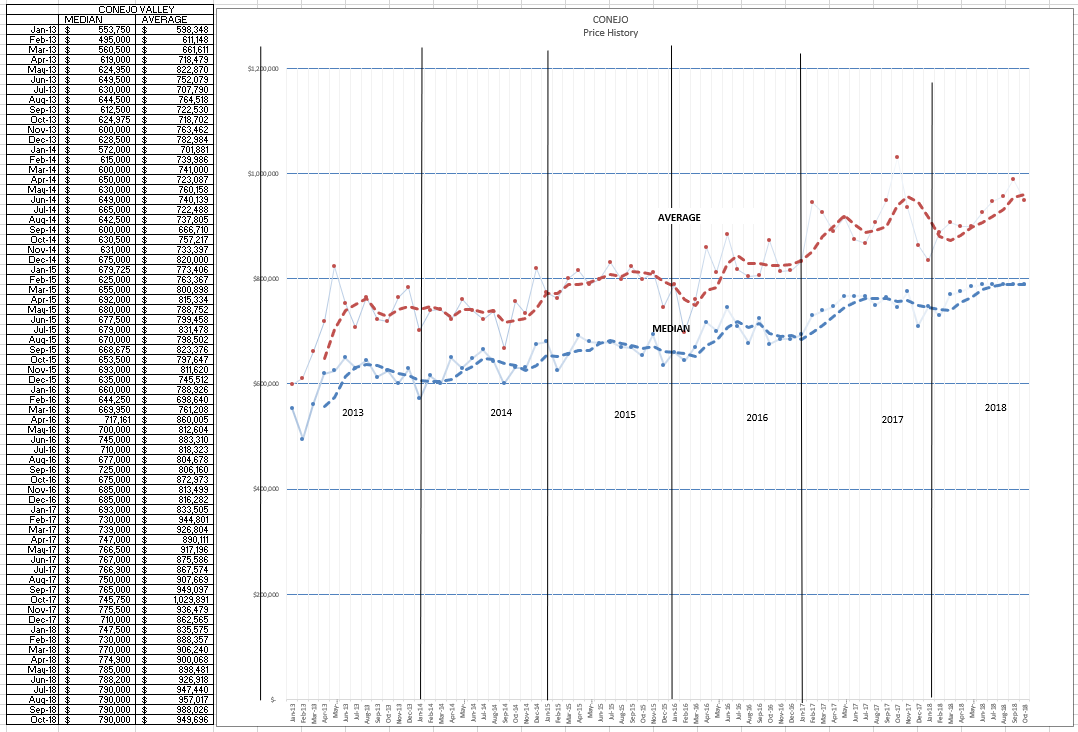
We can see above that prices are leveling out (not dropping), but that usually happens at this time of the year. There is a large space between the Average and Median lines in the Conejo chart, but a much smaller space in the Simi Valley/Moorpark chart below. That’s because there is a wider range of prices in Conejo, whereas a large percentage of homes in Simi Valley/Moorpark are sold closer to the average price. The price graphs are leveling out, price increases are cooling down, there is more of a balance between what sellers expect and buyers are willing to pay.
So what is your house worth today? Ask a realtor you trust. No reason to be concerned, it is just a market, and it is acting like it.
Have a fabulous month.
Chuck