I closely follow two economists, CAR Chief Economist Leslie Appleton-Young and The California Forecast Chief Economist Mark Schniepp. This week I was blessed to attend an event at which they both spoke. Like the Jack Palance line in City Slickers, it just doesn’t get any better than that.
Leslie began with a readers digest version of the housing market and ended with her forecast of where things will probably end up this year. The presentation will be on the CAR website shortly, it is well worth your time to view the charts, even without her verbal commentary. Current information shows the number of single family home sales receded by 5.2% from 2017. For 2019, the outlook is for a 6.9% drop in sales from 2018.
Mark usually begins his presentation by questioning the audience about their feelings on where the economy is headed. The first choice was that we would be in a recession by summer. I was one of two that raised their hands. Certainly I was not in the majority, and if I was an economist I would be sent back to classes. But I am not an economist. I run a real estate company. In 2008, one tale making the rounds was the difference between a recession and a depression. The answer was that a recession happened when your neighbor lost their job, a depression happened when you lost your job. Mark went on to describe many positive factors in the economy. We are not in a recession, usually identified by two quarters of negative GDP. But when you live in the real estate sector, and you see two years of 5-7% decreases in the number of sales, I would argue that our industry is definitely in recession territory.
Lawrence Yun speaks for NAR about the US economy. Leslie speaks for CAR about the California economy. One of the reasons I follow Mark is that he drills down to the Ventura County economy. Like our clients, we are very interested in an even smaller segment of the economy, the valleys in which we live. Let’s see how things are going locally.
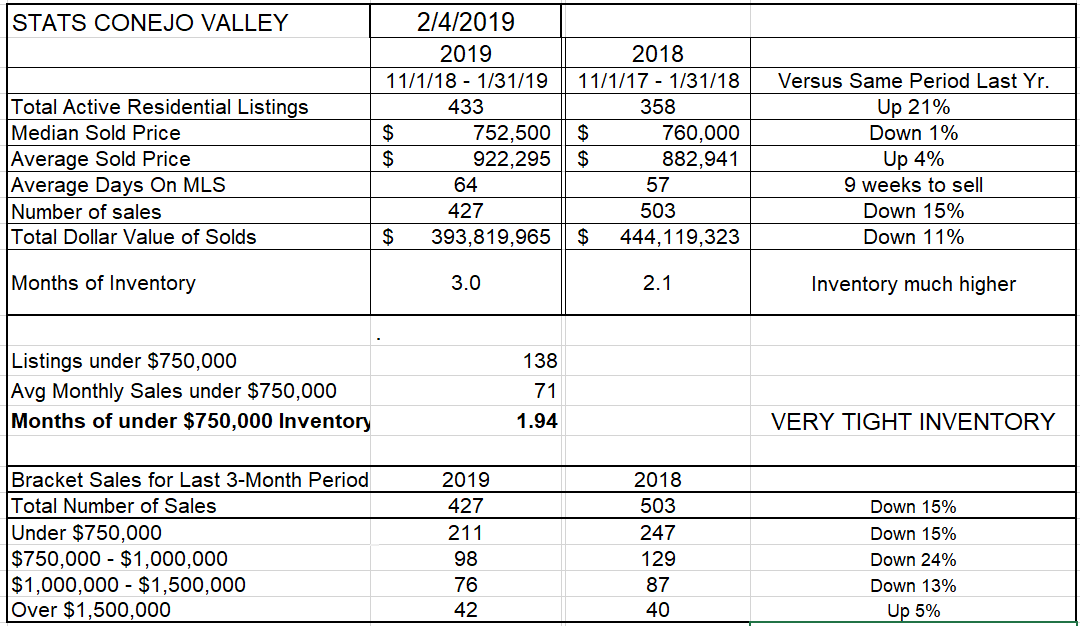
With a couple of exceptions, my figures compare the past three months with those same three months a year ago. These are not year over year figures. Comparing the past three months with the same ones a year ago, in the Conejo Valley our inventory is up 21% and our sales are down 15%. The months of inventory figure is computed by dividing the inventory by the average monthly sales. That figures has gone up by an entire month, from 2.1 to 3.0 months of inventory. Median sold prices are down 1% when comparing these time periods, while Average sold prices are up 4%. If you look at the bottom of this chart, you can see that all the pricing segments had lower sales except the highest category. The sweet spot segment of $750,000 to $1,000,000 showed sales down 24%. Excluding condos, that is the area where most of our single family homes sell. The Average price is higher due to the influence of selling more higher priced homes than last year, versus reductions of 11-24% in the other pricing categories.
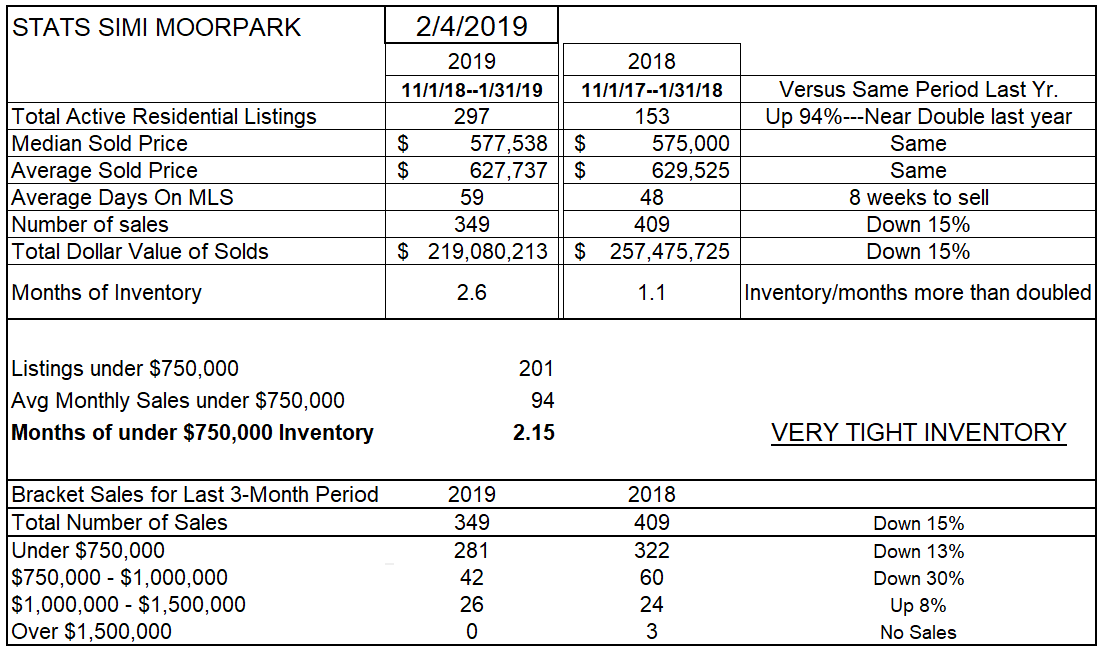
Simi Valley and Moorpark have a different inventory blend of housing. Compared to Conejo, prices tend to be not as influenced by a high-priced category. Even though one exists, the percentage of homes in the higher categories are less of an influence. Last year, homes in Simi Valley/Moorpark were selling like proverbial hotcakes. The inventory was anemic, only 153 homes on the market. Today’s inventory is nearly double last year, up a whopping 94%, but that percentage increase is highly influenced by the unusually low number of active listings last year. Similar to the Conejo Valley, sales for this three month period compared to the same three months last year are down 15%. The computed figure for months of inventory has changed drastically, with the current inventory representing 2.6 months of sales, compared to only 1.1 month last year. And prices, both mean and average prices, are basically the same as last year.
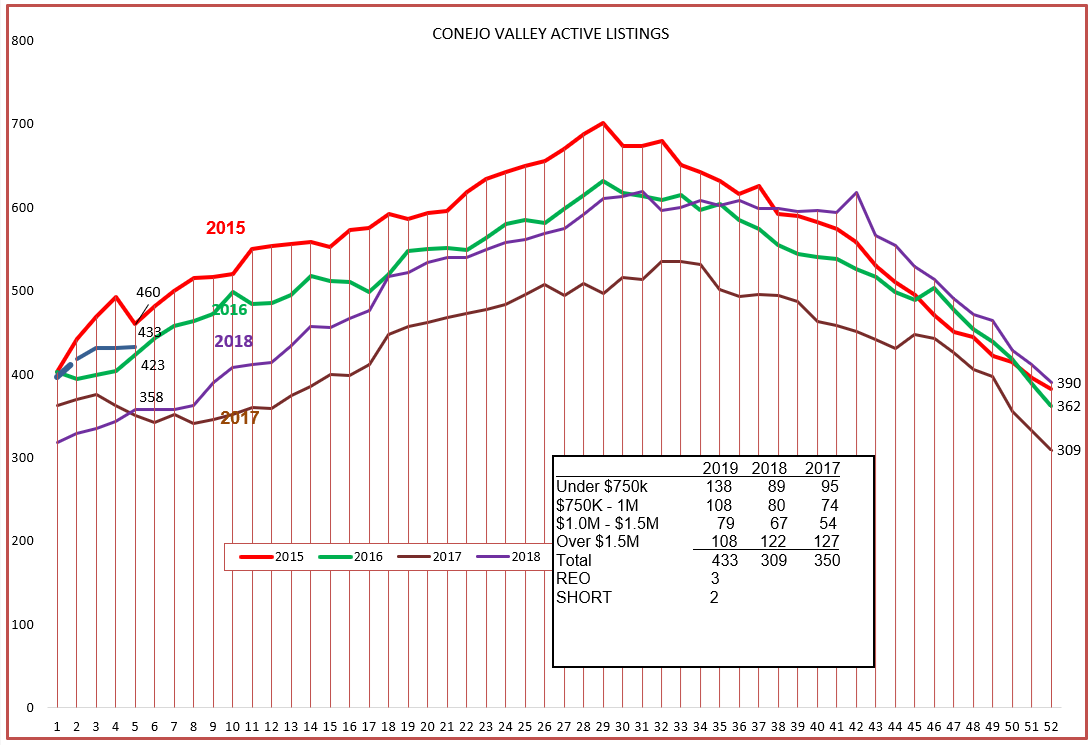
Let’s compare the inventory charts to see how this year is starting out compared to past years. In Conejo we are starting out similar to 2015. The inventory at the beginning of the year only varied by about 100 listings for the past five years, so nothing to really worry about here. Call it average.
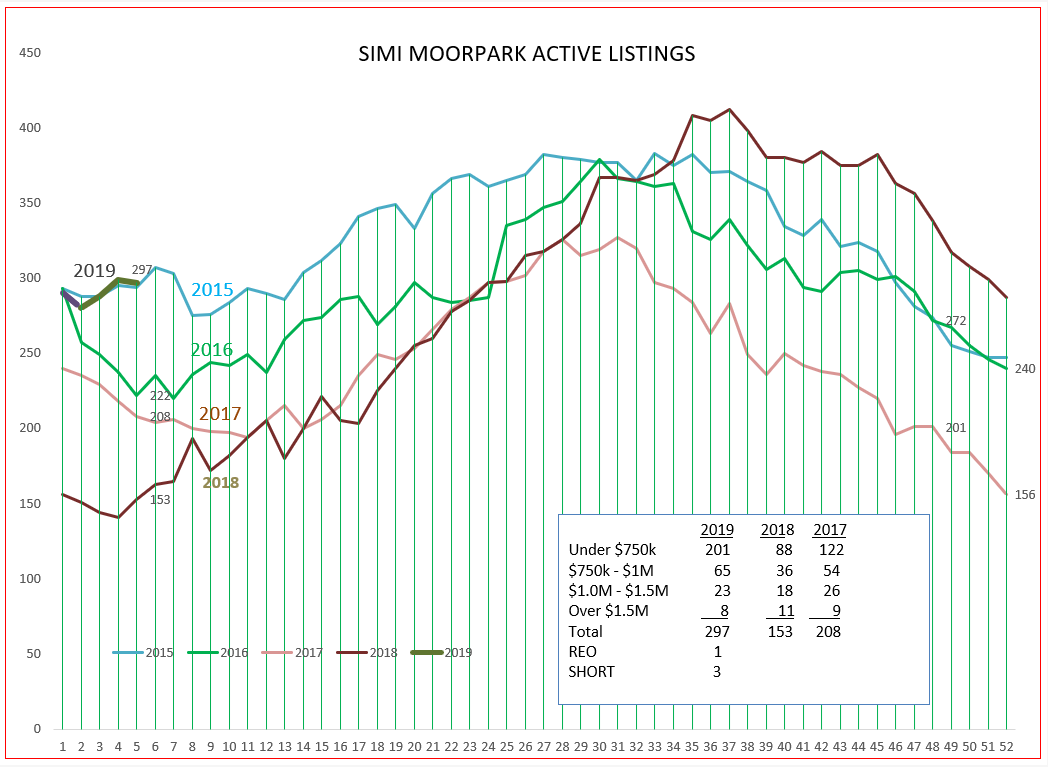
Simi/Moorpark is also starting out on track with 2015. This graph helps you see how low the inventory began last year, 2018. But the inventory grew through the September October period where it usually declines, basically wiping out the low inventory problem. Too early say that the inventory growth will continue, it will bear watching.
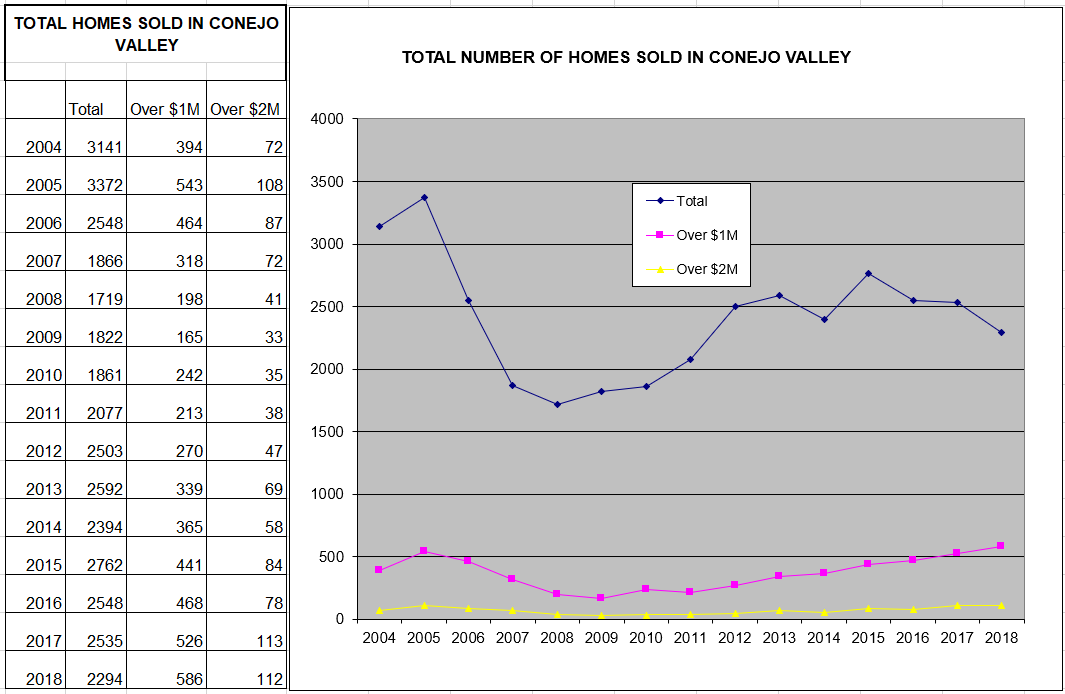
Let’s look at the number of transactions for our valleys over the past several years. The graph below shows the downward trend of the past three years, and the forecast is to continue that trend. Please note that while the number of total homes sold has been decreasing, the number of homes sold in the higher-priced categories have been increasing.
The history for Simi/Moorpark also shows the decline of the past three years.

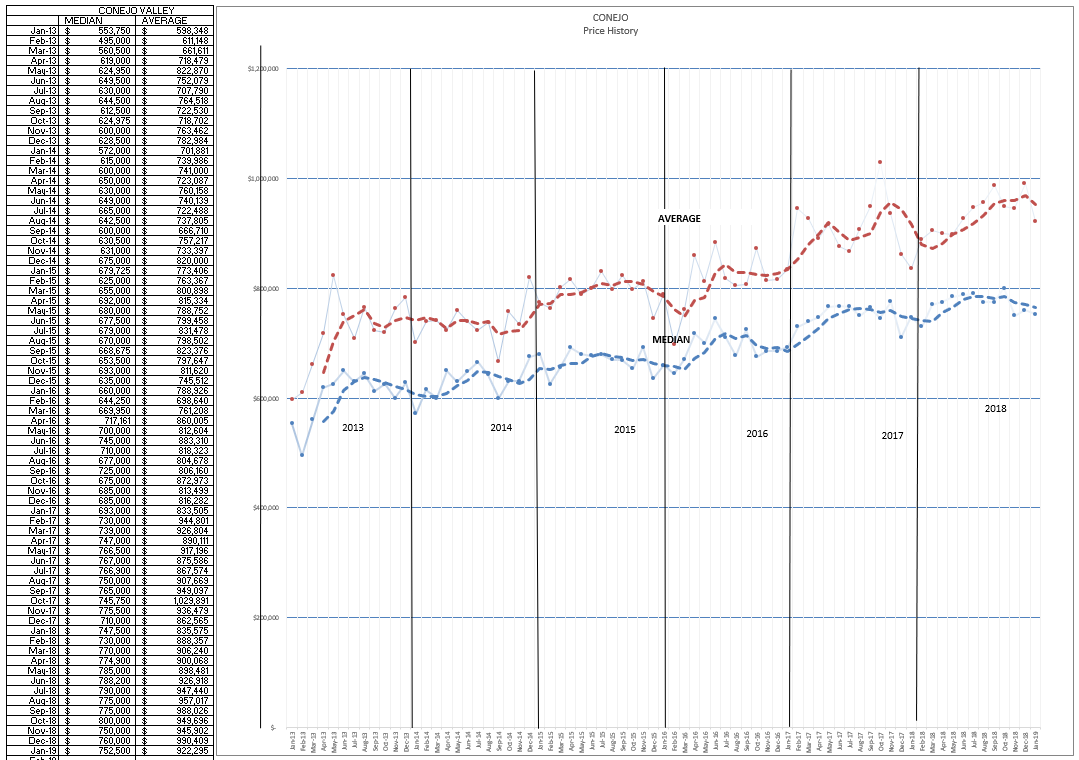
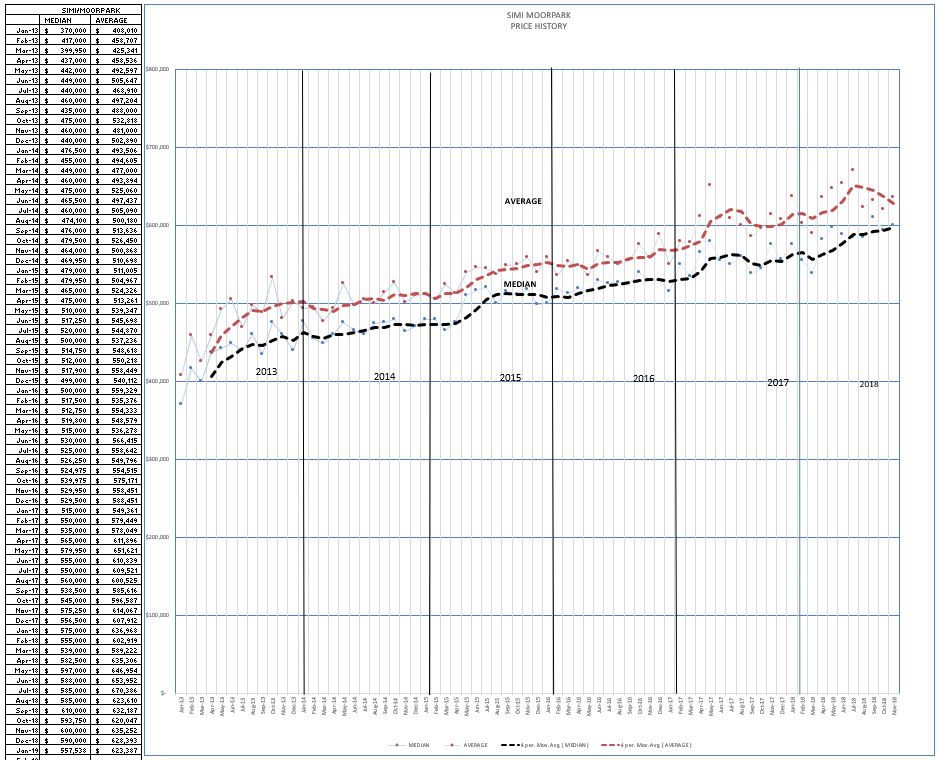
And finally, let’s look at what pricing has been doing by looking at the graphs of monthly (not 3-month) sales prices. As expected, prices have declined from the high of last year, not unusual for this time of the year.
So are we in a recession? No, the country is not in a recession. But housing is one of those leading economic indicators, it tends to foretell the future. The formal announcement of a recession may be a year away, and of course could be influenced by lots of unknowns. As far as our local housing market is concerned, the future is not worrisome. Let’s describe this market as balanced, favoring neither the buyer or the seller.
Please let me know what you think. This is how I read the market, but your view may be entirely different.
Have an excellent month of February.
Chuck