Some economicsts have been forecasting that a recession is coming. One day they will be correct. Every period of growth in our economic history has been followed by a period of recession. This current period of growth is now the longest in our history, over 10 years. The stock market is up a lot, then the market is down a lot. We have hope that we will solve the trade disputes (tariffs) with China, and then the talks fall apart. We hope for peace in Korea, and then new missiles are fired to emphasize new threats. The Fed provided some stimulus with the first cut in interest rates in 10 years, and Congress passes yet another 2-year budget with even higher spending, ignoring the previous limits. We are printing lots of money. And then there is that inverted yield curve. The very high (Conference Board) consumer confidence rating, which decreased in June and rebounded in July, is at its highest level this year.
The economy is not simple. It is no longer based on what the FED will do. Even the Fed is not sure what they should do. On July 11, 2019, Fed Chair Jerome Powell said the relationship between unemployment, interest rates and inflation has collapsed. That used to be the main tool used by the Fed for decades. The so-called Phillips Curve, which the Fed relied upon to guide its policy direction, seems to be broken. The link between unemployment and interest rates is broken.
Congressional deficit budget spenders previously were balanced by conservative members concerned about the amount of deficit spending. However, Congress just agreed to a second huge 2-year deficit budget. The 2017 budget pushed annual deficits toward $1 trillion per year, and Congress just reached an accord on the 2019 budget that would raise spending by $320 Billion over existing caps. The new guidepost is Modern Monetary Theory (MMM), which states that in advanced economies issuing their own currencies, government debt does not carry credit risk. Is this voodoo economics?
Next someone will tell me that the law of supply and demand has been rescinded.
The economy is not simple.
And while reports are rosy in the general economy, our local California housing market has been is a recession for the past two years.
Year 2017 2018 2019 YTD
# CA SINGLE FAMILY HOMES SALES +1.7% -5.2% -5.1%
But these are California State numbers. All real estate is local. Let’s see what is going on in our market, the one you most care about. How do our valleys compare to the overall state numbers?
Year 2017 2018 2019 YTD
Conejo Valley -0-% -9.2% -2.7%
Simi/Moorpark +6.3% -10.9% +1.1%
So while the state took two years of 5% lower sales to reach 10% lower sales, Conejo and Simi/Moorpark were much more efficient, achieving their 10% drop in 2018. Yes, all real estate is local. Perhaps related, but definitely local.
Last month saw the sale of the highest priced home in the history of Ventura County. $35 million. Congratulations to Jordan Cohen.
I have tried to explain the difference between the median price and the average price by discussing the impact of the higher priced homes. This gives us a chance to see the real impact.
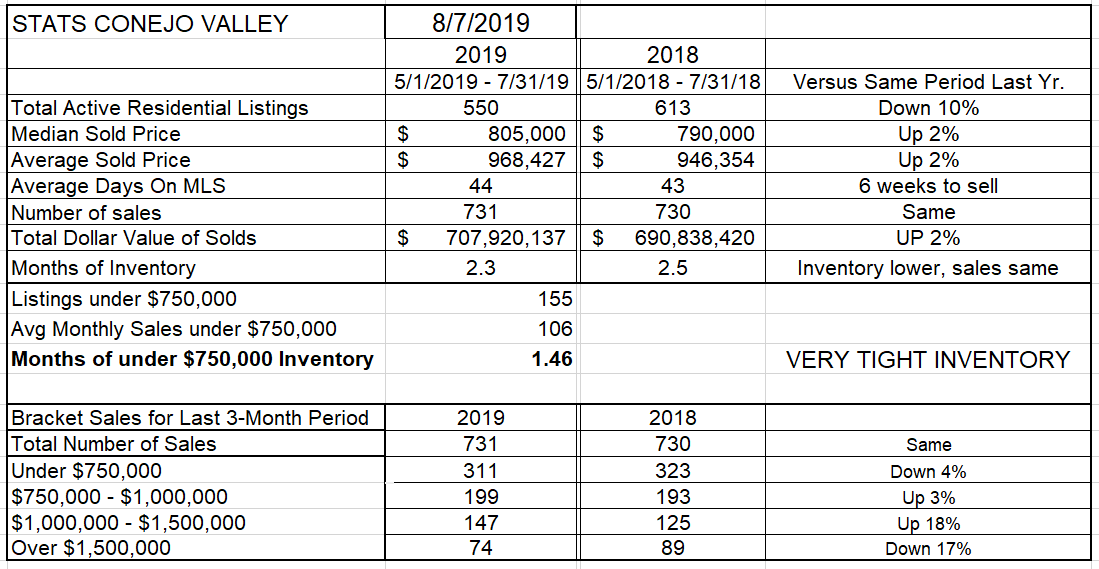
For the three months of May, June, and July, Conejo saw 736 home sales. The median price was $805,000 and the average price $925,303
Adding in that one sale changes the total to 737 homes, but while the median price remains at $805,000, the average jumped to $971,537. The high price of that one spectacular house did not change the median, but the average price jumped by almost $50,000. High priced homes affect the average, but not so much the median price.
We know we are not California average, and we know we took a big hit in 2018, but where are we now?
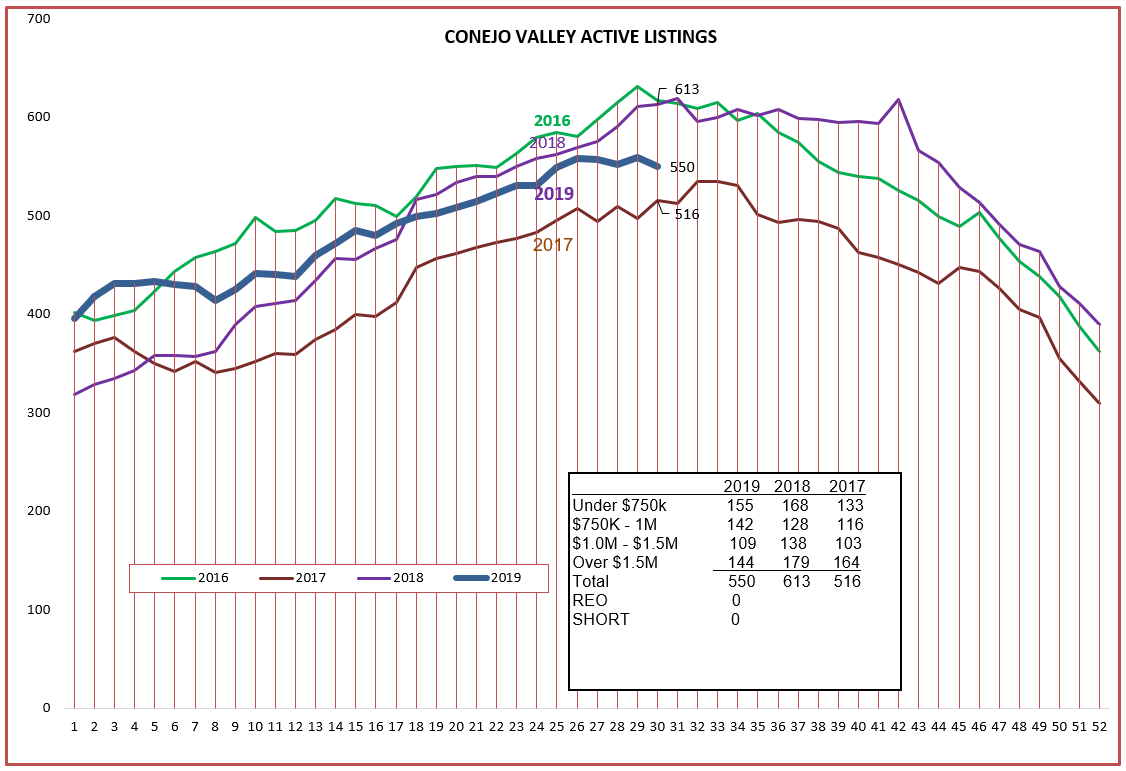
First, the inventory. Conejo is behaving as if on tracks, fitting right between previous years in both numbers and shape of the curve. No surprises here, a goldilocks inventory. Not too hot, not too cold, just right. As far as the inventory is concerned. However, it does appear to be entering the fall downturn a bit early this year.
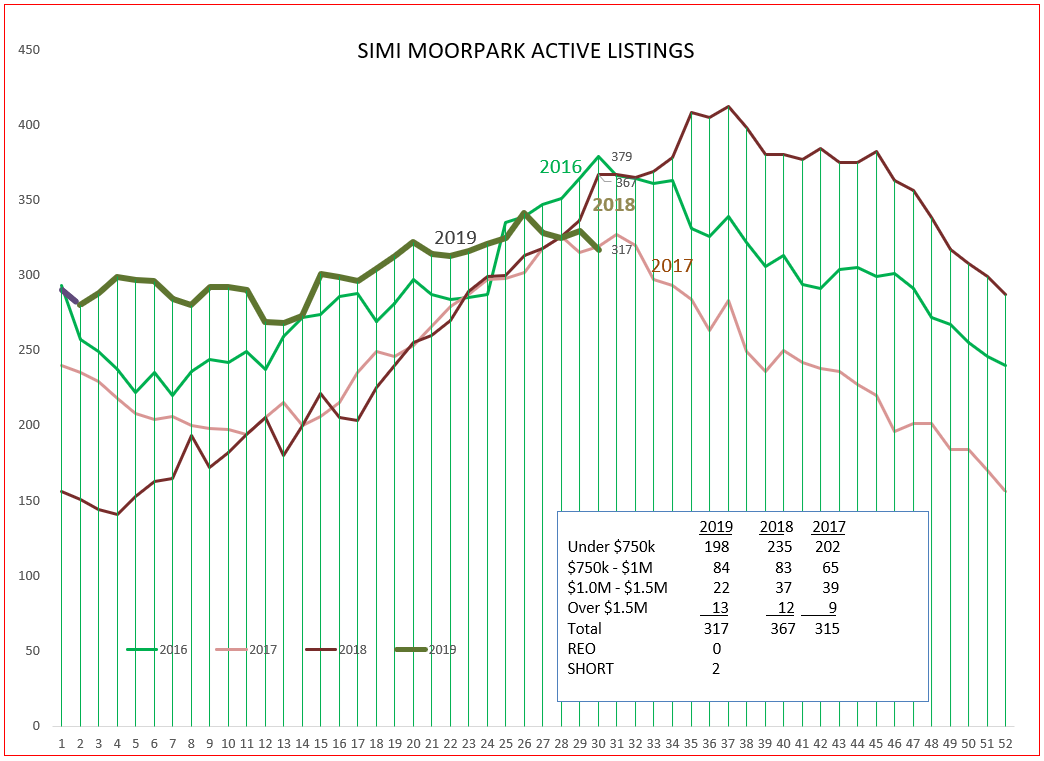
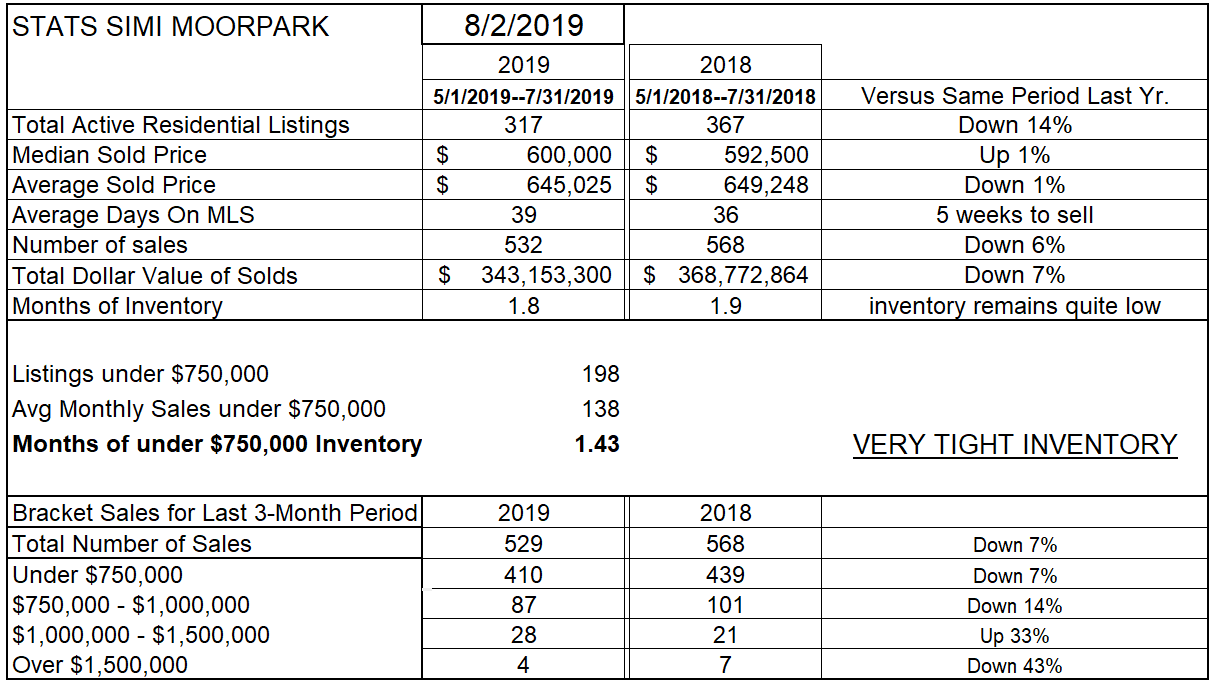
Simi/Moorpark inventory charts new territory, acting unlike any previous year. It is now pretty much where it started the year, and has rambled along to get back to the starting point. But inventory is only half the score. It’s like saying Dodger 6. We need to look at the other end of things, sales.
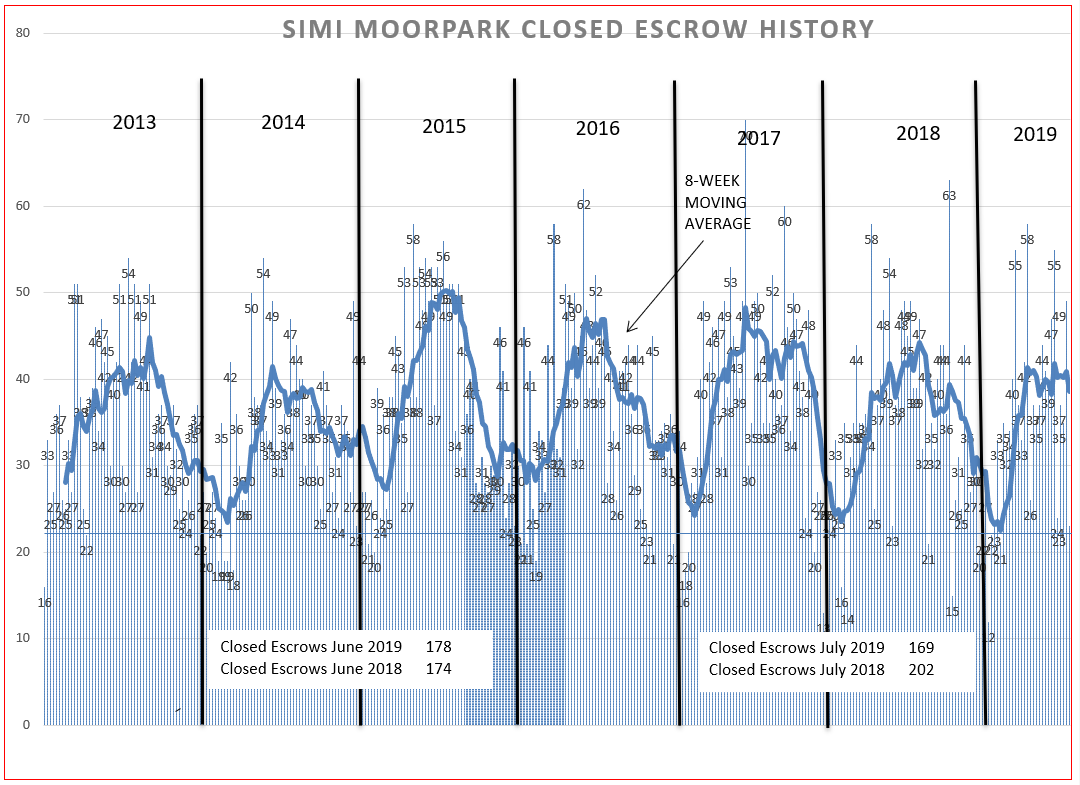
Simi/Moorpark started out the year with very robust sales. Compare the slopes of 2018 to 2019. Simi/Moorpark was on track for a very strong year, and then things calmed down. In the early part of the year, sales rocketed, and then they slowed down to normal, and now they seem to be struggling. Comparing that to the usual inventory climb, the early high sales were cancelling out the normal increase in inventory, and then things began to slow, until now, for July, things are significantly slower than last year. So as demand was high, the normal inventory growth balanced out the high sales, then things slowed down, and finally we are below last year. In comparing this July to last July, closed escrows were down 16%.
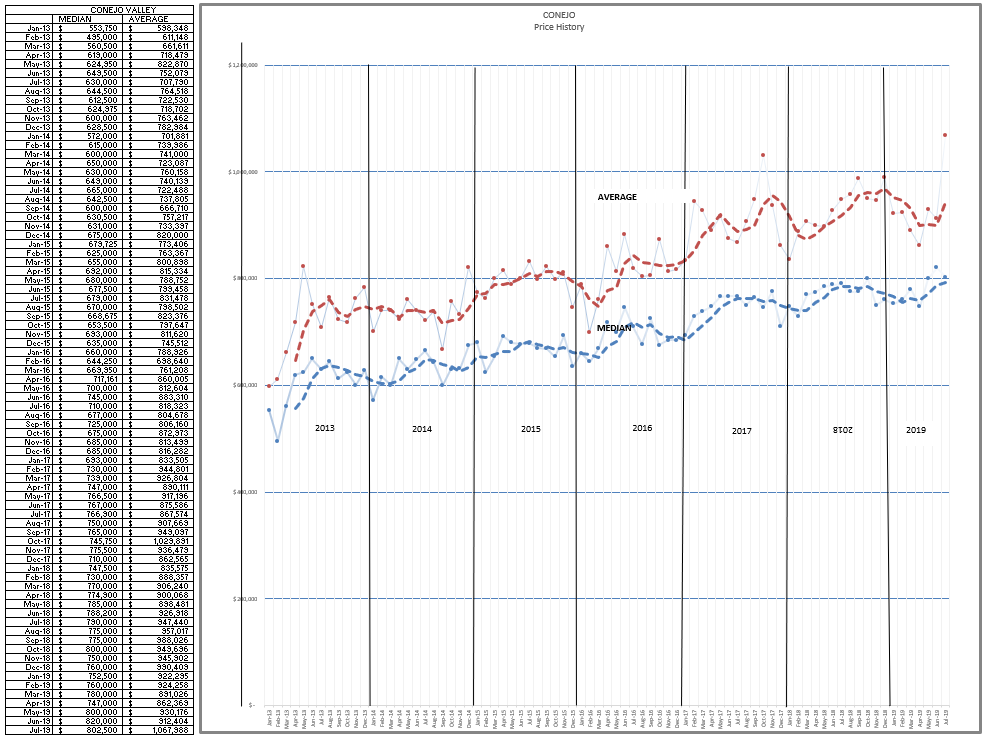
Conejo, which saw a normal inventory growth, also experienced a normal sales chart. However, the year began at a much lower level than normal, and has capped out.
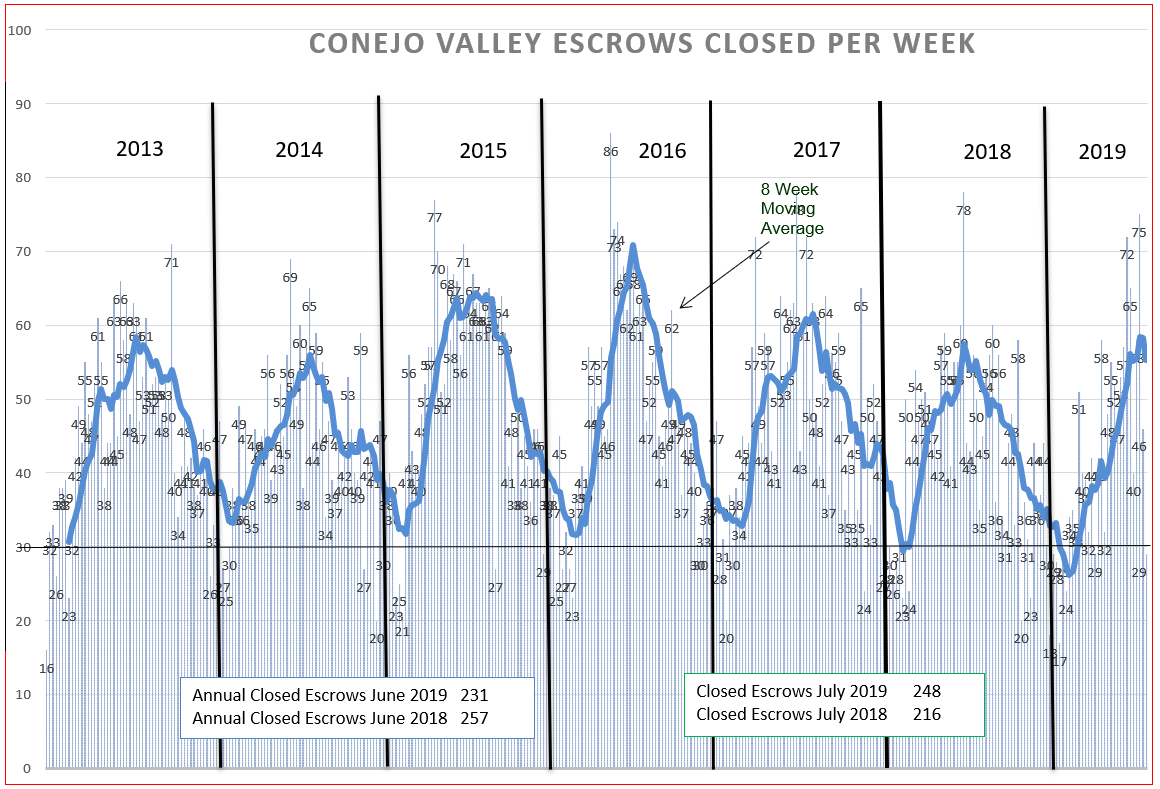
Let’s see how Conejo’s actual numbers help us understand the charts. Inventory 10% lower than last year, prices slightly higher, number of sales the same. However, looking back at the sales chart above, July 2018 was much lower than July 2019. Remember, in 2018 annual sales were down 9% from the previous year. Even though the 3-month year-to-year shows the same sales activity, the lack of inventory will slow sales down. The biggest increase in sales activity over this period took place in the $1 million -$1.5 million range, up 18%. The range above that dollar amount was down approximately the same percentage. New listings are beginning to slow down much earlier this year.
 We have looked at supply, We have looked at demand. Now let’s see how they have affected prices. Conejo has been following the seasonal trends, with both median and average prices trending up in the summer. The $35 million sale pushed the average price up strongly, At the end of 2018, Average prices were up very strongly, reflecting a large number of higher priced properties in the mix. This dropped off precipitously as 2019 began, with fewer higher priced (over $1.5 million) being sold. The Conejo table above lists the past three months as 17% behind last year.
For Simi/Moorpark, the word used too often is DOWN. Inventory down 14%, Average sales price down 1%, Number of sales down 6%, all price categories (except $1 million – $1.5) million, down. The largest number of sales were in the categories below $1 million, the bread and butter of sales in this area. Although Simi/Moorpark began the year with very strong sales, this trend topped out early, and currently the market is slower.
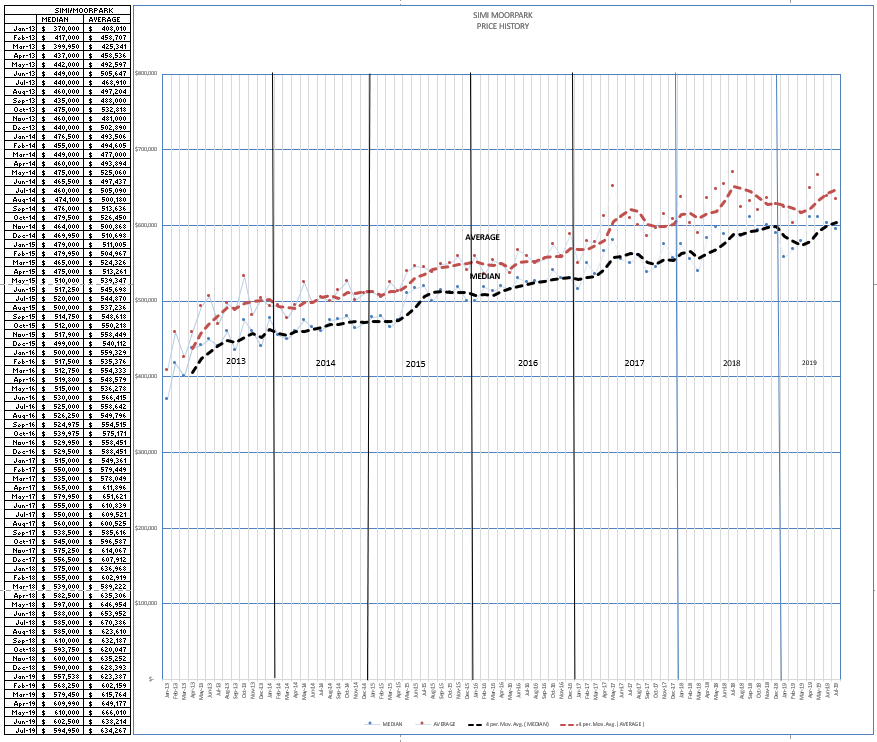
 Simi/Moorpark prices are very consistent, and have not been as seasonal as in Conejo. With all the up and down activity, prices are basically unchanged from a year ago.
So how is the market? I will end with a quote from a friend and fellow blogger, Tim Freund. He said that, “In studying all the economic trends and information, it all points to a sellers market. Except it isn’t.”
Have an excellent finish to the summer season. Things are not rocketing out of control, they are not in free fall, the market is solid, but slowing.
Chuck