Everyone seems to accept that there will be a drop in the volume of homes sold while the COVID restrictions are in place. Navigating through what for many is the most significant purchase in their life is difficult enough to accomplish without these extra roadblocks. A virtual tour is not a visit. We have been very creative in getting transactions closed without leaving our home offices. But marketing homes and creating new transactions and marketing your services are not as easy. In addition, the ability to obtain mortgages has become much more difficult. We are experiencing a drop-off in closed escrows.
Major banks and Fannie/Freddie/FHA have agreed to forbearance of mortgage payments if homeowners lose their jobs/income. They are basically moving the next few months of mortgage payments to the end of the mortgage, extending the final mortgage payment date by that number of months.
This forbearance can cause problems with selling mortgages to Fannie/Freddie/FHA. Customarily, mortgages are quickly sold and a loan servicer takes over the account. However, if during this short time frame the new mortgagee declares forbearance due to loss of their job, Fannie/Freddie/FHA will no longer purchase that mortgage, and the bank must keep the loan on their books. To protect themselves, banks have added additional requirements. They cannot afford to put more loans onto their balance sheet until the economy stabilizes. Jumbo loans have all but disappeared.
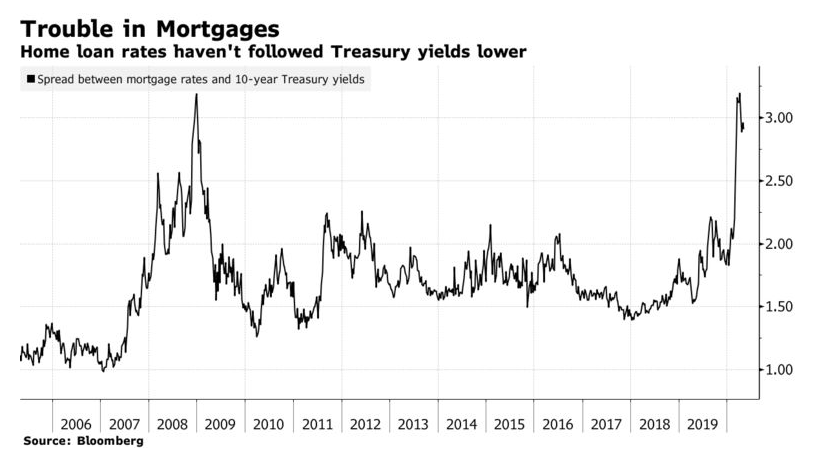
Another financing problem has occurred. Mortgage bankers typically protect their rates by hedging those rates with mortgage-backed securities. These bonds are usually closely tied to the 10-year treasury bill. However, recent moves by the Treasury and the FED to support the economy has caused a major shift in these bonds. Recently there were margin calls made against these hedges, costing banks to pay $5 Billion in overnight margin call payments. Bloomberg Article If the usual relationship between the 10-year and mortgage rates were still in place, mortgage rates would be closer to 2%. (See the article by Bloomberg.) In their chart below, the usual differential between mortgage rates and the 10-year treasury yield, normally 1.5-2%, is currently 3%, a full point above where it normally would be.
Besides the decline in the number of sales, which affects realtors, everyone is concerned about a decline in prices, which affects every homeowner. A recent CAR survey showed that 90% of buyers are looking for price discounts. This shared feeling by buyers will make it difficult to achieve full prices.
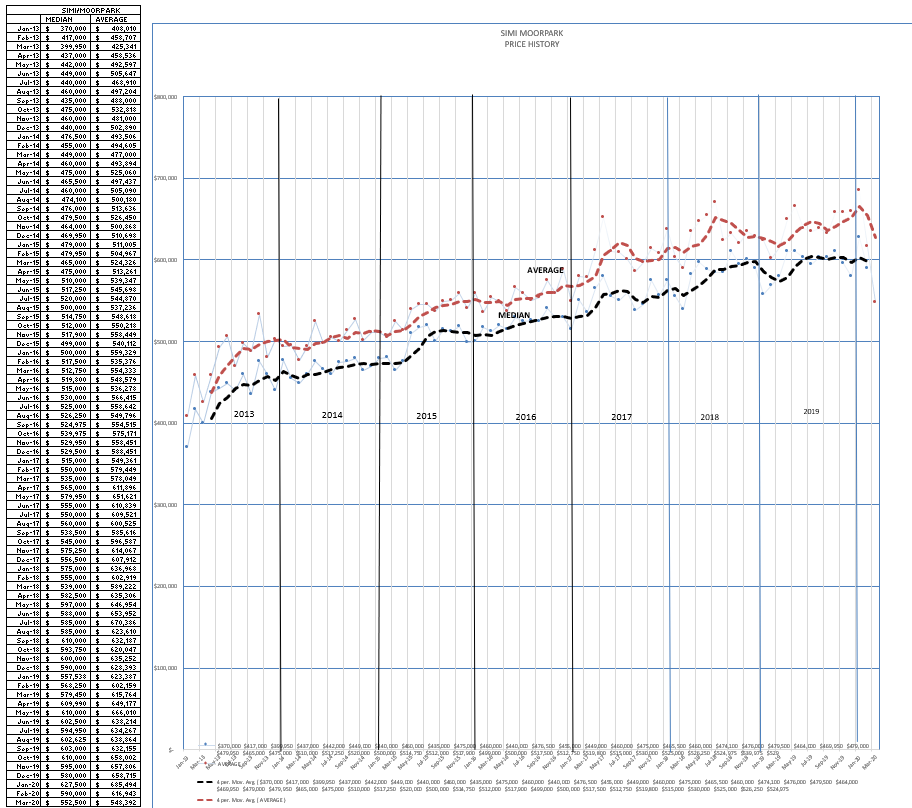
On to recent history. Let’s start with Simi prices. Last year they were being heated in a pressure cooker. Inventory was low, and demand was high. The median price seemed to be pushing against a glass ceiling of $600,000. This year, the 3-month average of median prices broke out. In Simi/Moorpark both average and median prices were 8% higher than last year, for the previous three month period. However, the results for only the month of April show a median price of $552,000. The rate for only one month has too many variables to accurately measure a change, but you can see the severe downward slope of the Average prices. Prices are weak. Not in free fall, but not experiencing the upward push that they were experiencing.
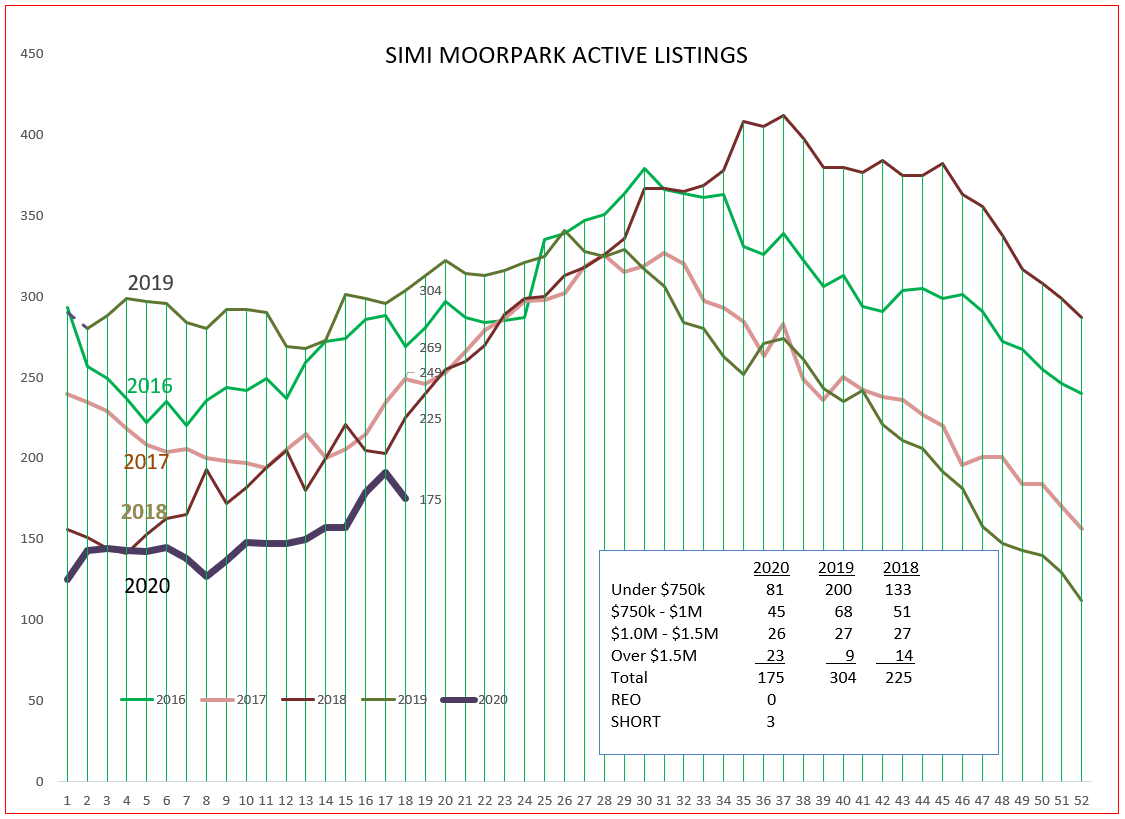
Why did prices rise 8% during the last three months compared to those same months in 2019? The rise was due to high demand and low inventory. The year began with a very low inventory that has basically stayed constant. The fact that inventory is now not growing out of control is a positive factor for the future.
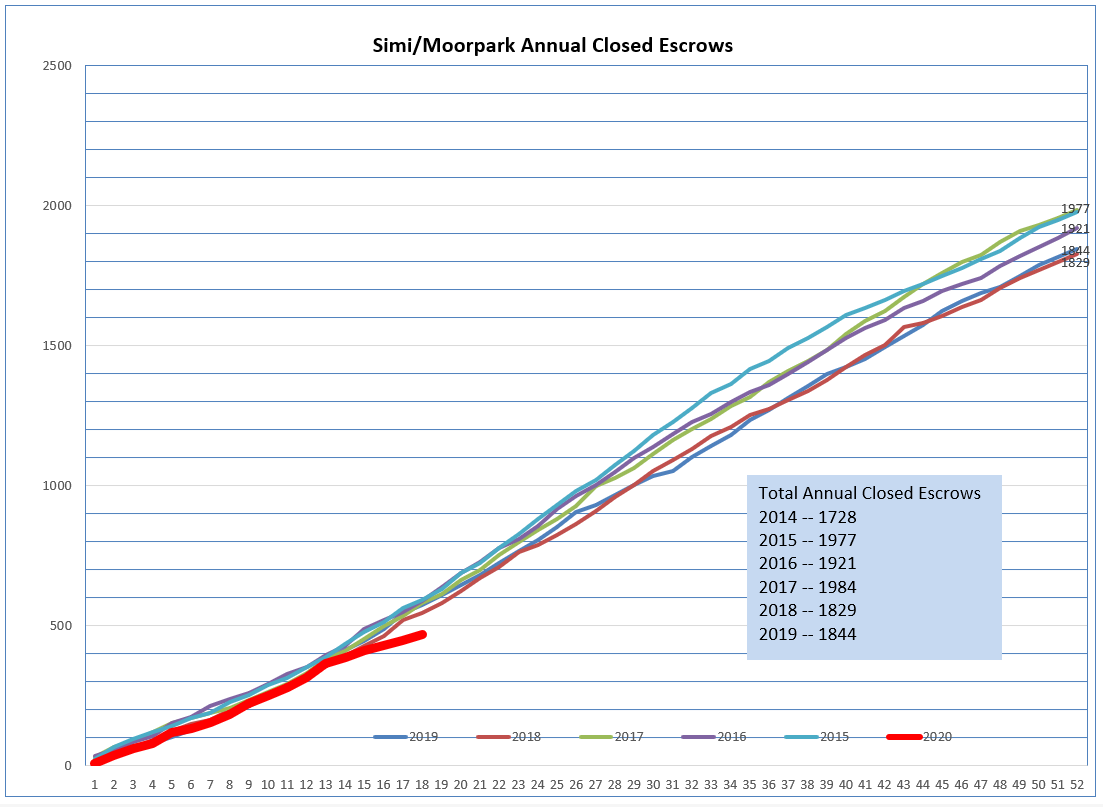
However, we have now seen a major decrease in the number of sales (see the monthly boxes). Notice the dip below. February escrows were the same as 2019. March 23% lower, April was 45% lower. Flights from China were restricted on January 31. The market was doing well, even in the face of a lack of inventory and price increases. The coronavirus shutdown temporarily pulled the plug on a good year.
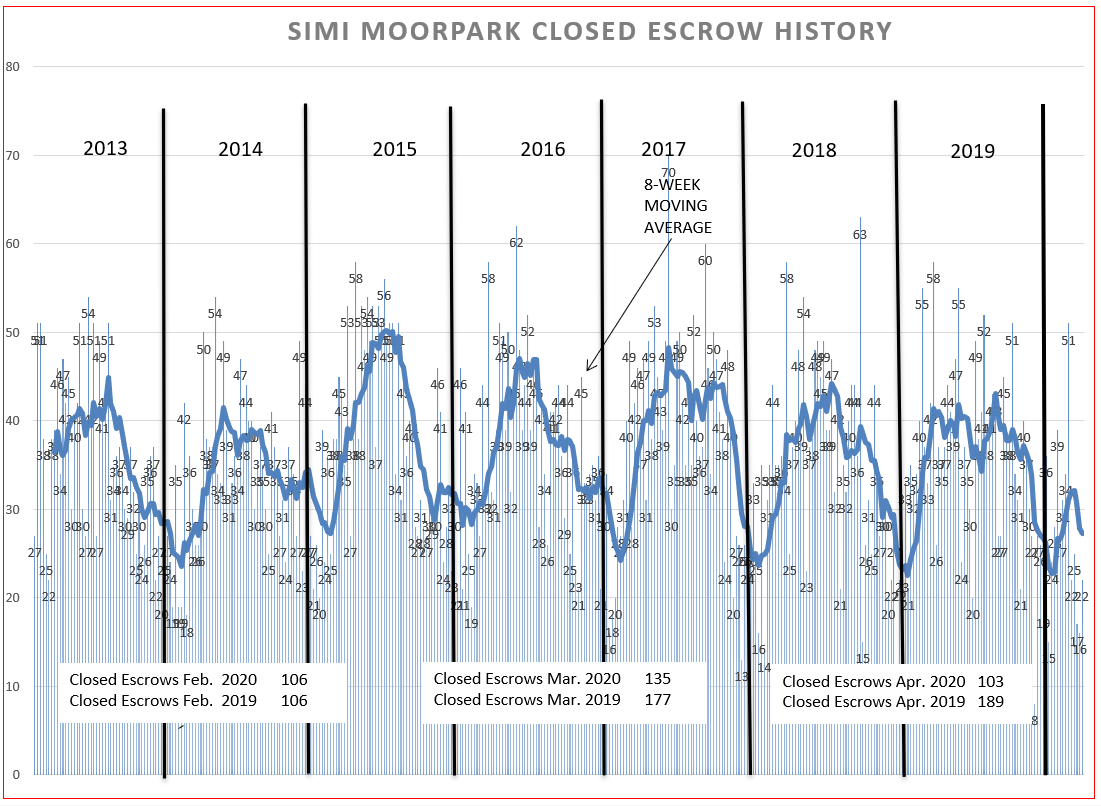
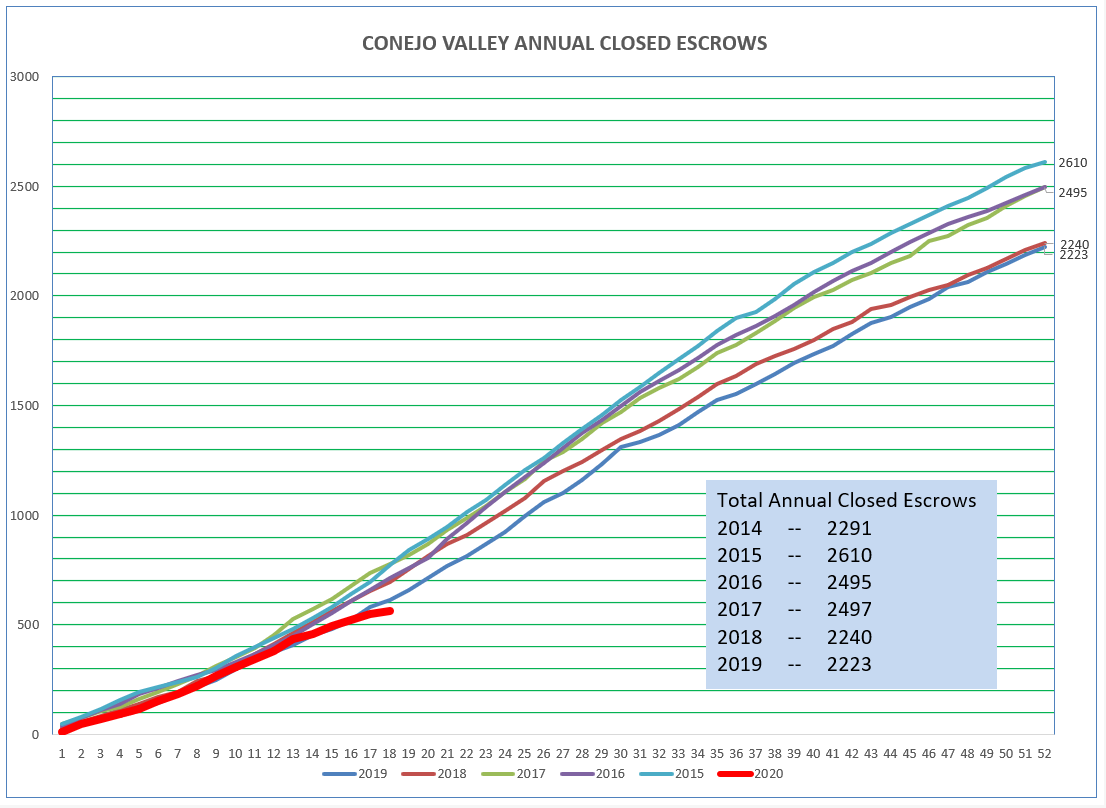
Looking at the cumulative amount of closings gives us a better comparison of how this year is proceeding compared to previous years. The red dip below expresses how we are doing this year compared to the previous 6 years.
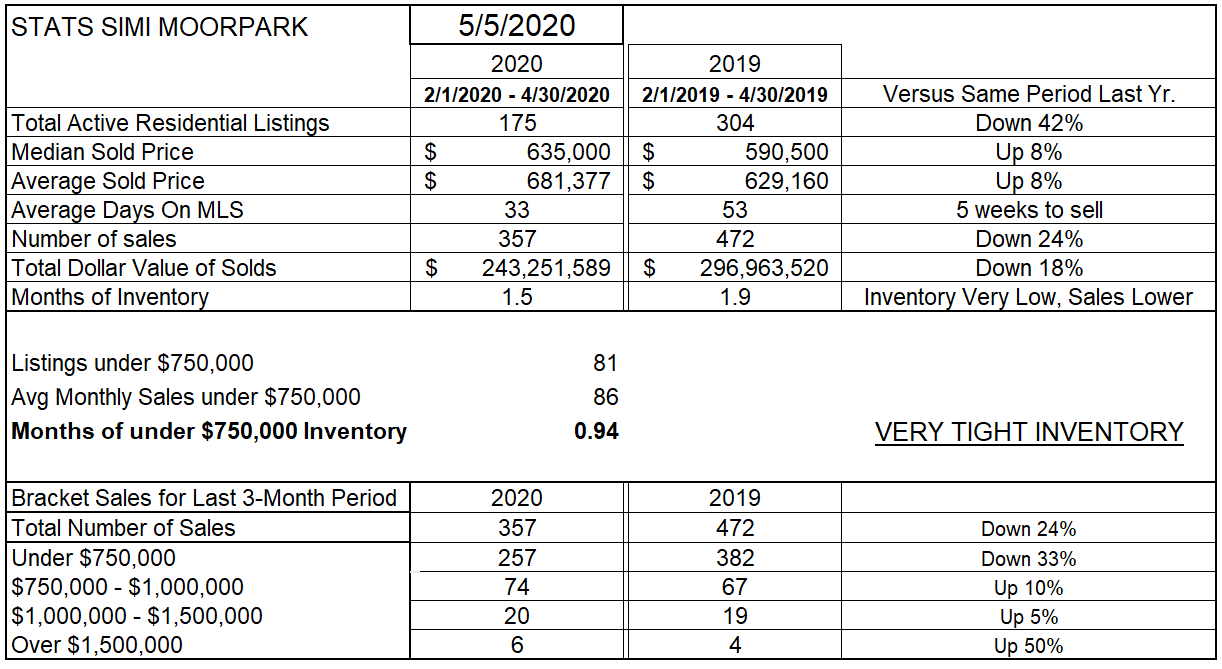
Let’s look at the statistical numbers in the chart below. Inventory down 42%, April 2020 to April 2019. This is what pushed prices upwards. However, we are now showing (over a 3-month comparison) the number of sales is down 24%. Some of this is due to lack of inventory, but we are now feeling the effects of the economic shutdown. The good news is that we have not seen inventory accelerate. As the restrictions come off, and the inventory is still tight, it will support prices. It is also interesting to note, at the bottom of the chart below, that the higher priced homes in Simi/Moorpark are actually doing quite well compared to the same three months last year.
Let’s switch over to the Conejo Valley. The major story there is the number of high priced sales. That has created the large differential between the Median and Average sold prices. (See the bottom of the chart below.)
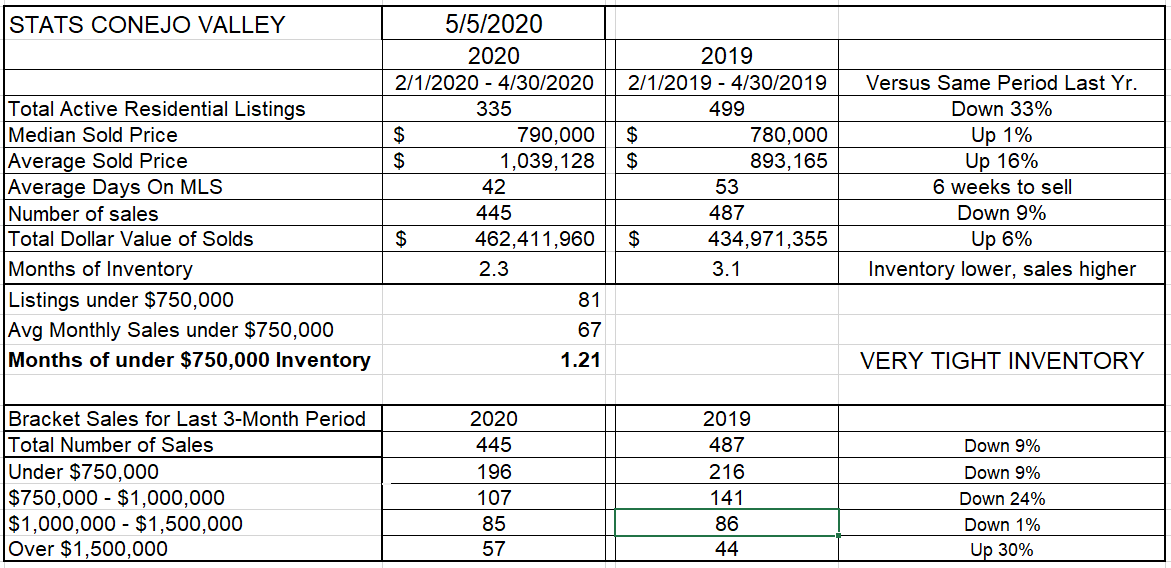
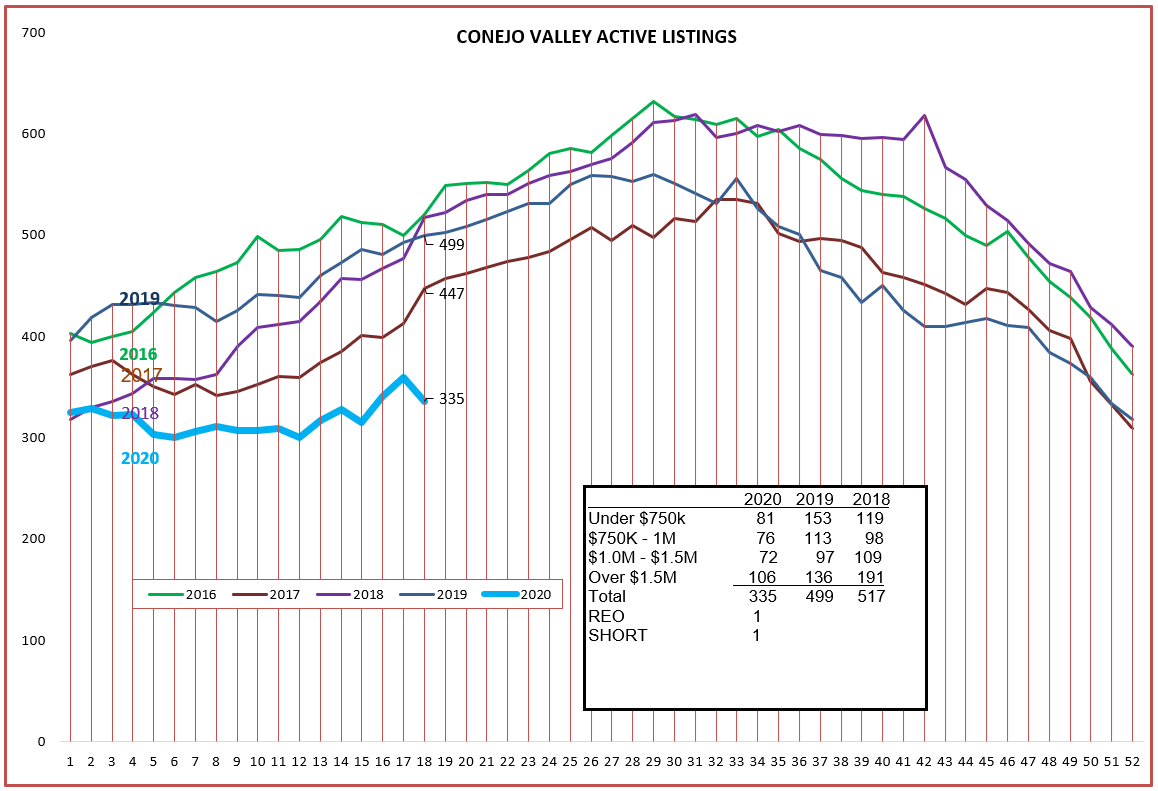
The inventory has behaved much the same as Simi/Moorpark. Every price level inventory is significantly lower than the previous two years. The overall April 2020 inventory is 33% lower than April 2019.
But what about sales? Simi/Moorpark had a 3-month sales decline of 24% in units sold, while Conejo experienced a decline of only 9%. Much of the difference is based on the lack of inventory available in Simi/Moorpark. The Conejo cumulative sold chart also shows a lower rate of sales. This gives you a picture of how this year is going compared to previous years. Not a severe drop-off, and an expectation of returning to normal as the economy returns to a more normal real estate picture. One possible benefit: if people are stuck at home, they prefer to be stuck in a nice home rather than an apartment. This perception may help sales for the future.
However, since Conejo has more higher priced homes, sales will be more restricted by the mortgage availability problems. Yes, we have a lot of problems, but thankfully they are temporary.
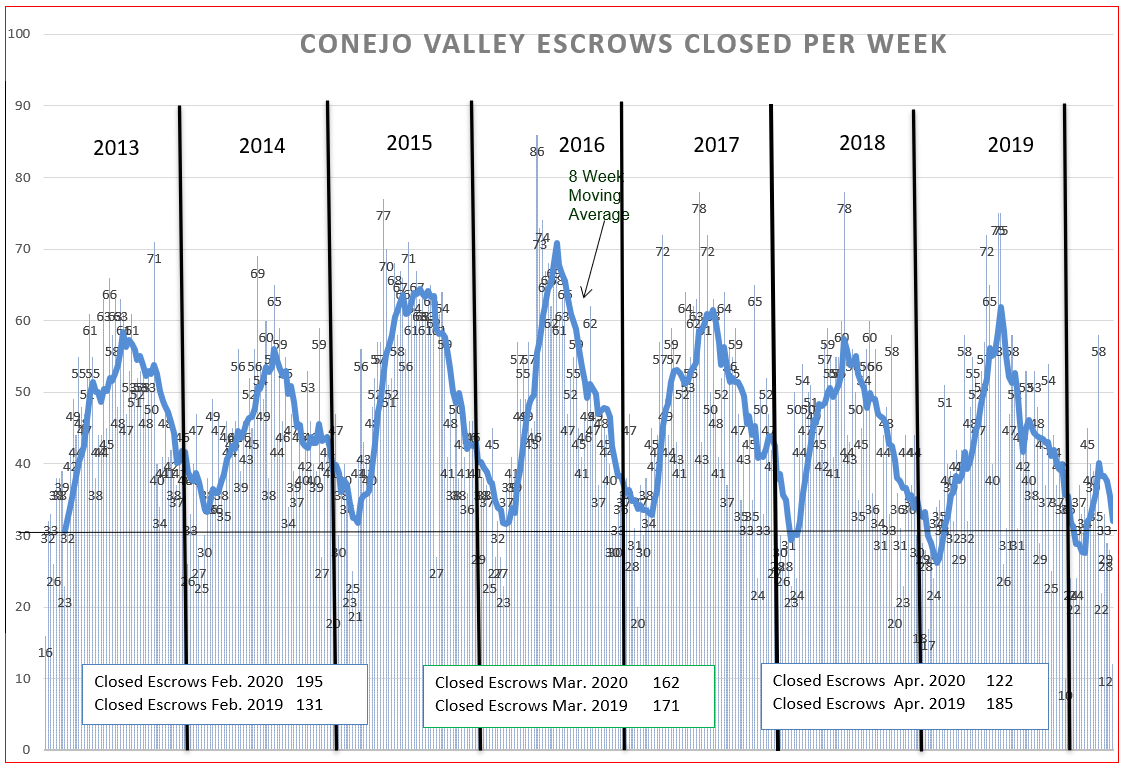
Finally, the closed escrow chart for Conejo. Note that February closed escrows were very strong, since February reflects contracts entered into in January. Flights from China were restricted on January 31. March closes were similar to the previous year. But by late February the country began to realize we were in trouble. April was 34% lower than the previous year. The decline in April closed escrows was for contracts made in the latter half of February and the month of March. A severe downward slope.
So that’s where we are.
As far as where we are going, frankly no one knows. Today on TV they are discussing what is the acceptable number of deaths. We are in a crazy world. We need to get the economy going again, and we need to protect people from dying. Rather than making a projection, I will sit back and watch with great interest as our leaders cope with theseconflicting alternatives. We have never seen such a balancing act in our lifetimes.
Even in these dire times, there are reasons why people need to sell a house. And other people with reasons to buy a house. Our place is in the middle, helping both. This is the perfect time to educate yourself on how to do business remotely. Zipforms and Docusign. Virtual tours, and maybe virtual showings. Setting up your business to be more automatic, more organized, taking advantage of the new tools to make yourself more successful. How many of you even knew of Zoom three months ago? Today we are all experts. These skills will help you in the future as the restrictions ease. Use this time to prepare yourself to be able to handle more business than you previously thought possible.
And remember the words of the sergeant from the series Hill Street Blues: Be Careful Out There.
Chuck