Let’s start out with the good news. This is not a replay of 2008. This recession has not been the result of overpriced housing and stated income mortgages. This time, housing is feeling the effects, but housing is not the root cause. The housing market will recover from these effects much more quickly.
We have been dealing with a health pandemic, at first dealing with it the only way we could, by hiding from the virus until we were better prepared to fight it.
This strategy bought us very valuable time.
Using that time, we minimized social contact to minimize infections, we improved testing, we solved the shortages of masks and PPE and respirators, we kept hospitals from being overwhelmed. We kept the virus from spreading by staying away from work, from friends, from church, from stores, from restaurants, from events. Painful, but it had to be done. It was the only choice.
We are now in the process of testing medicines to treat this virus, and we are developing vaccines to shield us from future infection. The entire world is racing to find treatments and cures and preventatives, at whatever cost is required.
But the cost to the economy has been brutal. 40 million people have lost their jobs. Temporarily. Job losses have mostly affected lower wage earners, particularly travel, hospitality and food workers. This group usually lacks the income level to become homeowners, so those layoffs have not directly affected the housing market. The government quickly reacted by partially replacing incomes with unemployment benefits, even including independent contractors (i.e. Realtors) who have never been a part of the unemployment insurance system. State payments have been supplemented by payments from the federal government. Businesses have been offered loans to help them pay their employees and their business expenses, loans which most likely will be forgiven.
We have been locked in our homes, locked out of our offices. But we survived. We learned to operate using virtual tools only recently created, tools that let us conduct business without being in the same room.
But what of the housing market? How bad did it get? I put it that way because I think we have reached a turning point. The economy, and society, are coming out of hiding. We have made it through the darkest of times. We are looking forward to getting back to normal. Thanks to what we have learned, thanks to what we have experienced, tomorrow’s normal will look different. We have been forced into learning how we can carry out our jobs in different ways, giving us more choices in the future, more ways to accomplish our tasks, more ways to be efficient.
While I have not previously tracked Pending sales, in the past few weeks Pending sales have started to claw back. And Pending sales forecast Escrow closures. That is why I think we have reached a turning point.
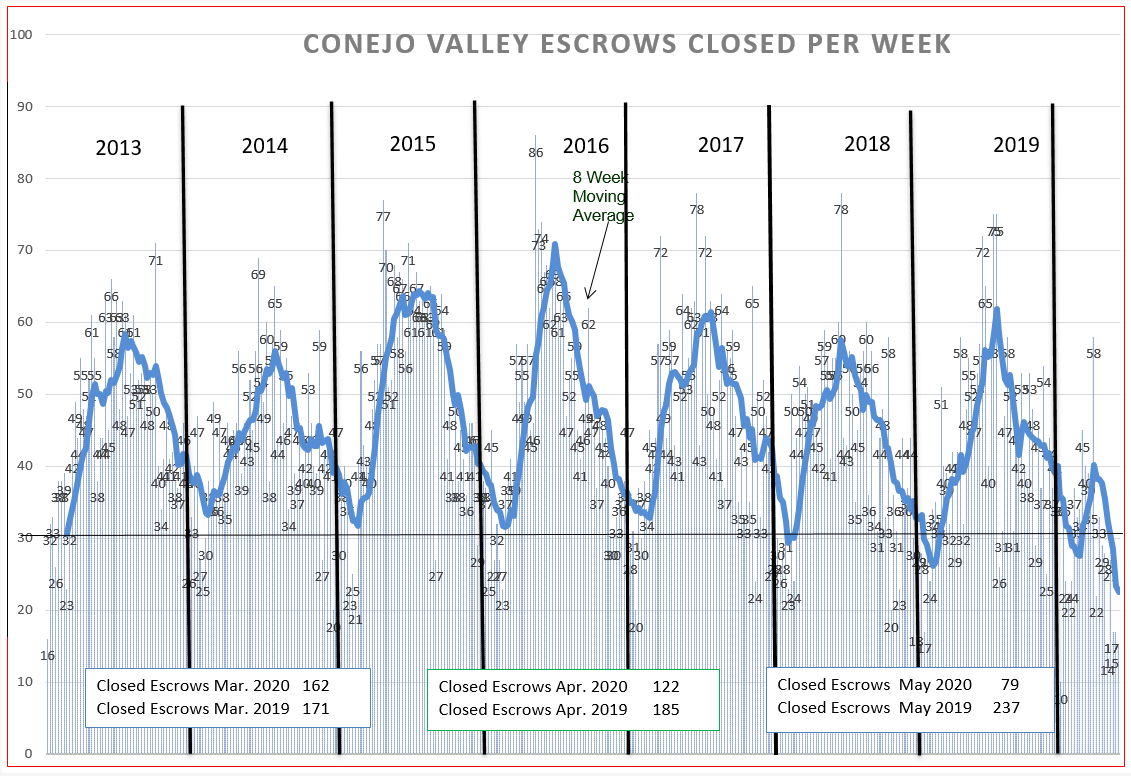
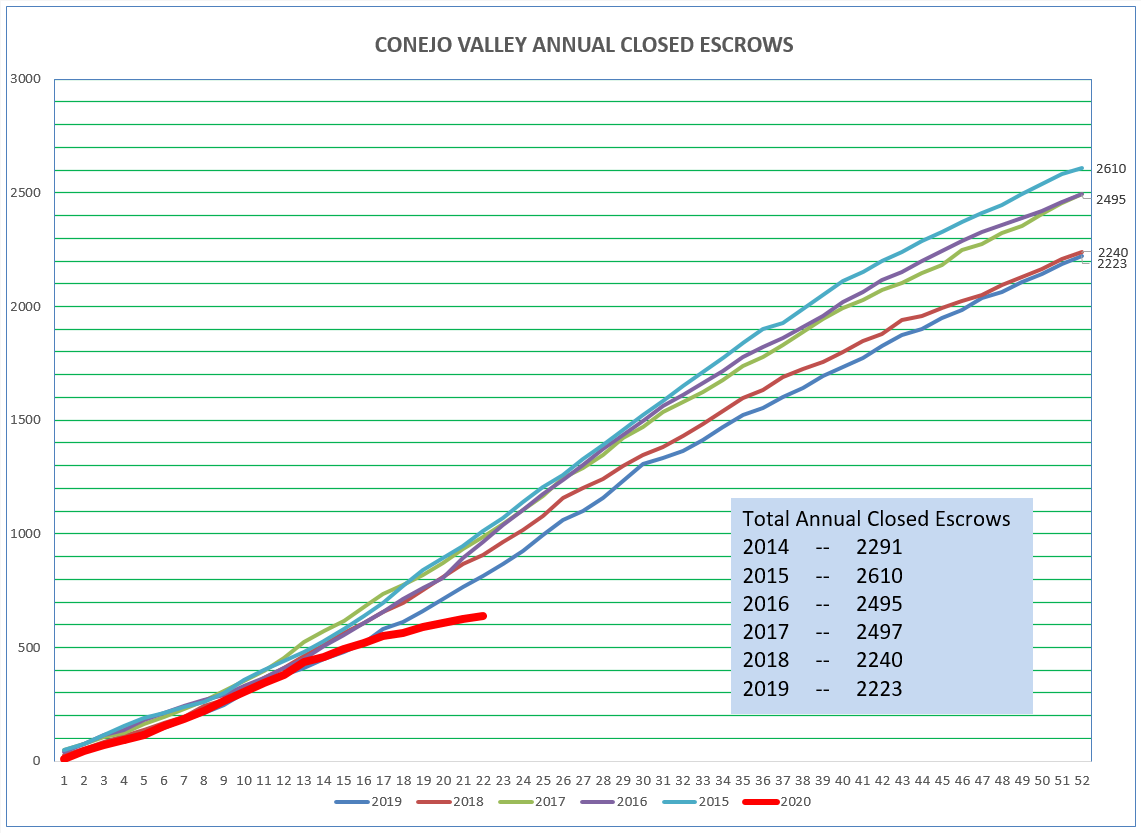
Let’s start out looking at the closed escrow charts. In the charts below, we see the 8-week moving average fall to levels not seen in the past seven years. I expect to see this turn around next month. For the Conejo Valley, the boxes in the chart below show a 35% decrease of closed sales in April 2020 compared to April 2019, and in May a drop of 67% compared to the same month last year. For those two months, compared to last year, 142 fewer homes closed escrow. As the economy improves, we will get some of those back. There appears to be pent-up demand.
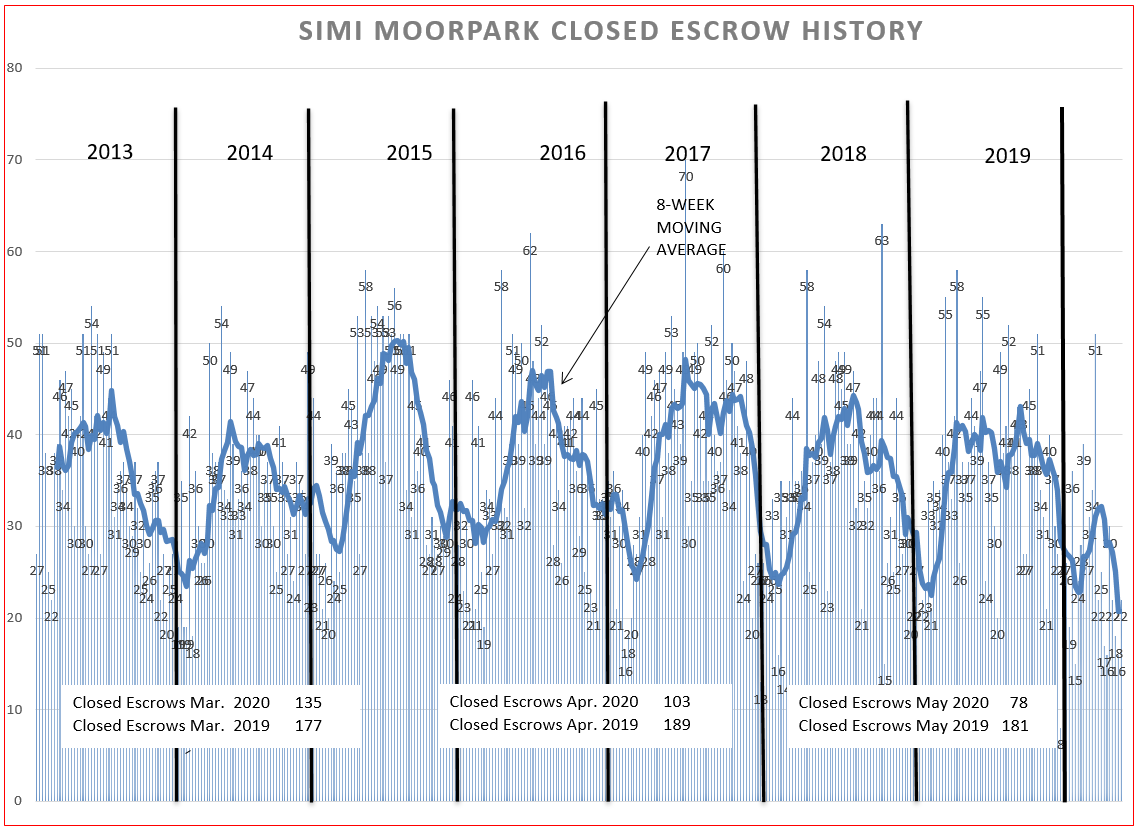
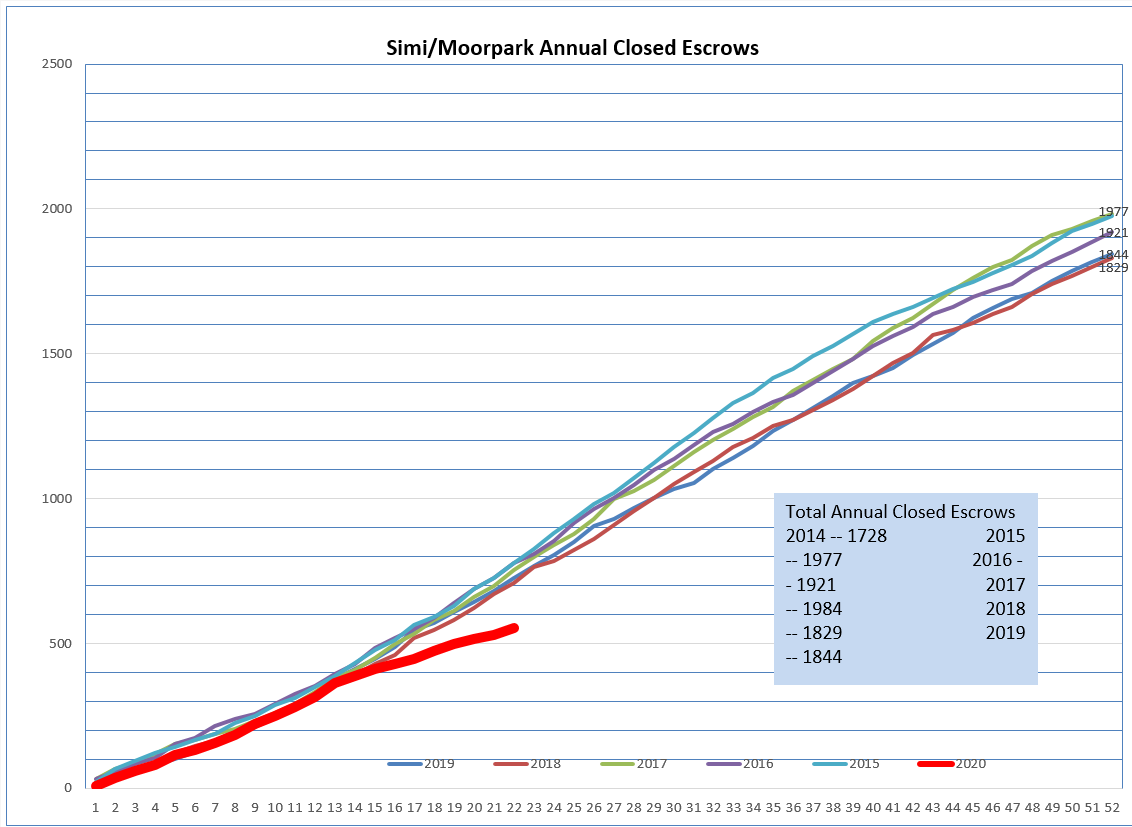
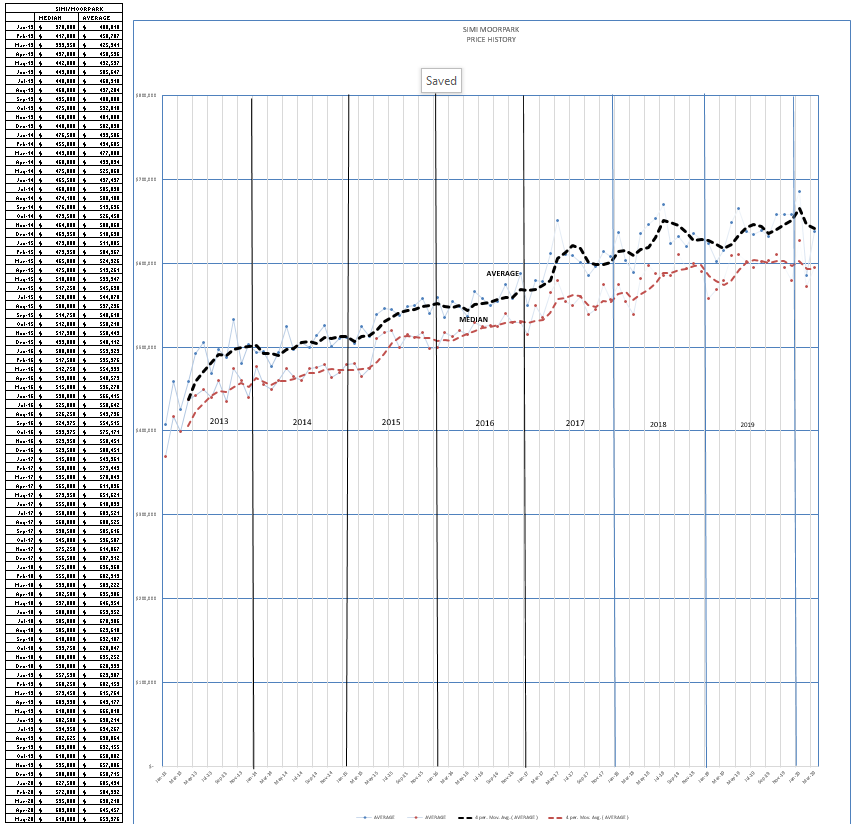
In Simi Valley/ Moorpark, the boxes in the chart above show a 45% decrease of closed sales in April 2020 compared to April 2019, and in May a drop of 57% compared to May 2019. People still have a need to sell their house, and people still have a desire to buy and live in a home. Perhaps being bottled up in an apartment will have people view owning their own home to be more attractive than renting, with more room and a back yard to enjoy. Since Simi/Moorpark is more affordable, sales have remained strong even in the face of very limited inventory.
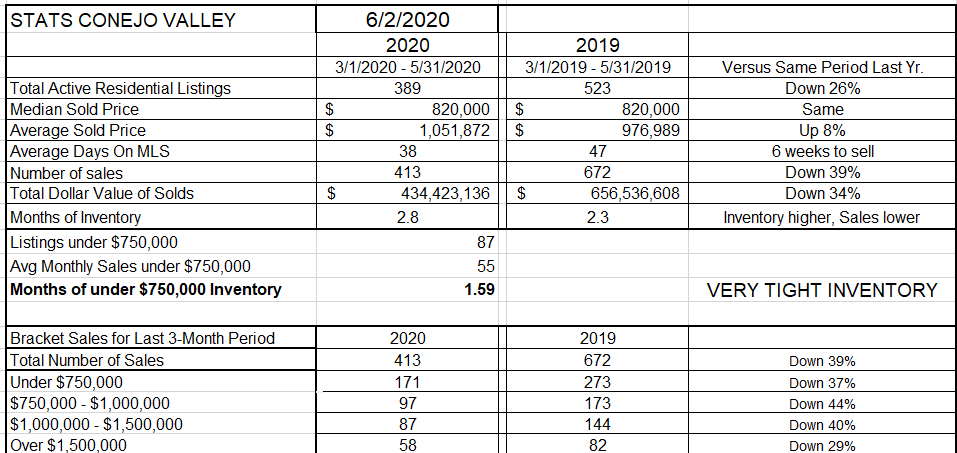
Now let’s look at the actual numbers , starting with Conejo Valley. Over the past three months, sales were down 39% compared to 2019, and half of that time was during the COVID-19 period. I prefer looking over a three month time period, to average things out. Besides concentrating on the dip in closed escrows, let’s look at other statistics to see if they reacted as we would expect.
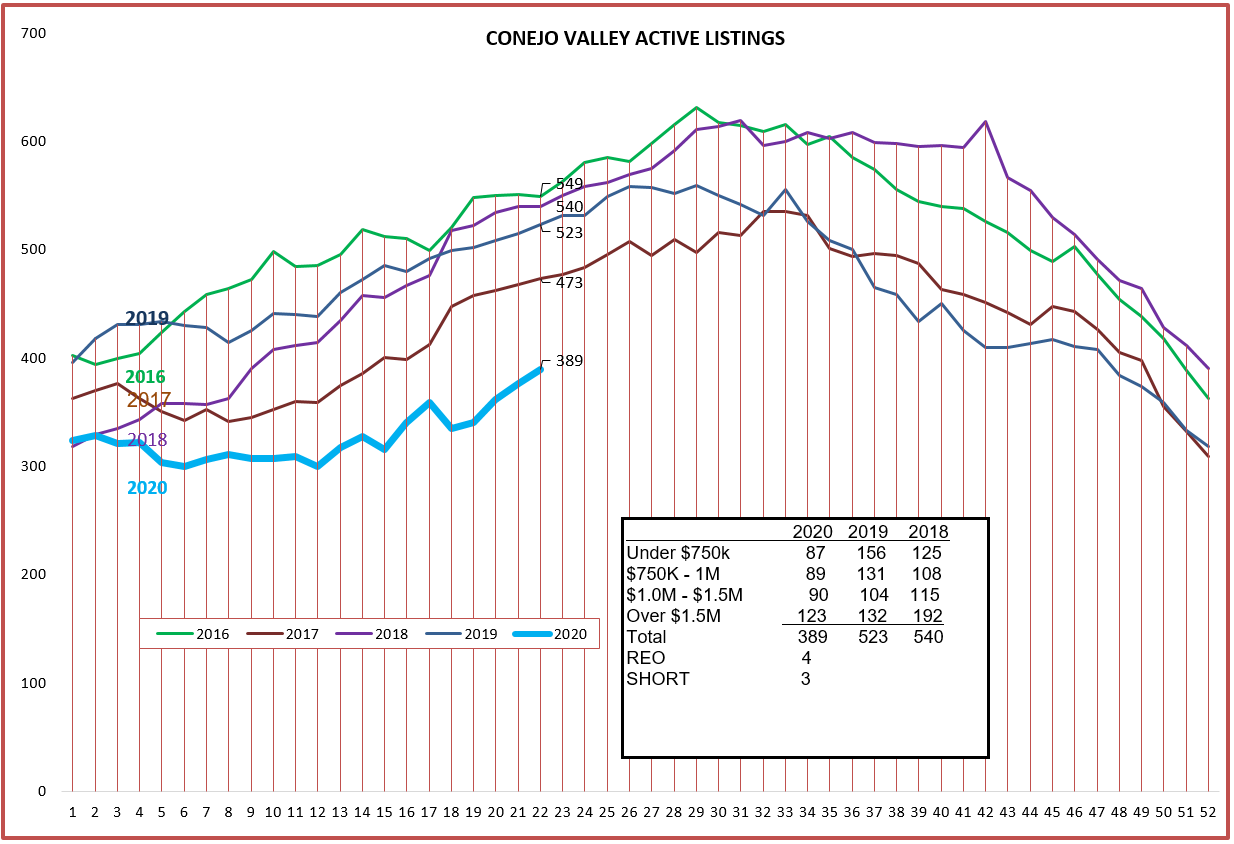
Listings were down 26% compared to last year. But listings have been down since the beginning of the year. We would have expected the listing inventory to increase due to reduced sales. (See the graph of listings later in this blog.)
Median prices held steady, while Average prices are 8% higher than the same three-month period a year ago. From all reports, there is no lack of buyers, and multiple offers still exist.
One of the most interesting statistics has been the Average Days On MLS. Only 38 days versus 47 last year, another indication that buyers are still very active. This is in direct contrast to what is reported for the entire U.S., where homes are languishing on the market. Finally, at the bottom of this chart, notice that the number of sales are down in every price group. One reason is the difficulty obtaining mortgages. Mortgage rates are good, and would be even better, except for the uncertainty due to the current mortgage forbearance allowance, discussed in this blog last month. Once those forbearance allowances expire, mortgages should become easier to obtain.
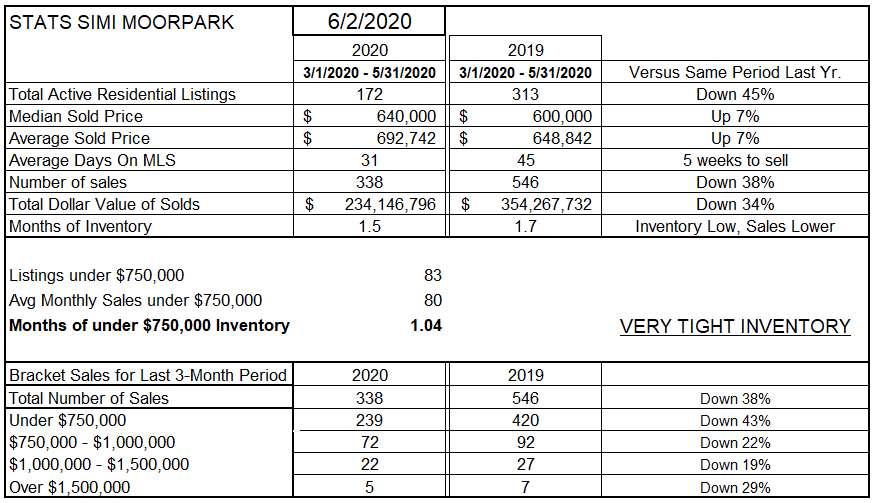
Next look at Simi/Moorpark. Over three months, sales were down 38%, and half of this time was during the COVID-19 period.
Listings were down 45% compared to last year. But listings have been low since the beginning of the year. (see the chart below) The dearth of listings may have contributed to the downturn in sales.
Both Median prices and Average prices were 7% higher than the same three month period a year ago. From all reports, there is no lack of buyers, and multiple offers are not rare.
One of the most interesting statistics has been Average Days On MLS. Only 31 days versus 45 last year, another indication that buyers are still very active. Simi/Moorpark sales have predominantly occurred in the under-$750,000 group. There is only a one-month inventory of homes in this price group, even based on currently lower sales. Simi/Moorpark Median prices were stymied all last year at $600,000. Early this year, Median prices jumped to $640,000 and continues strong.
Inventory has been low throughout our territory. We began the year with low inventory, and it has remained low. With sales off 38%, we would have expected inventory to grow. However, that has not happened. As things return to normal, more listings will appear, and those will generate more sales.
It will be difficult to “catch up” with where we should be. The charts below display the progression of total closed escrows throughout the year. As expected, we are not on our usual course. It will be difficult to recover all the missed sales. I would expect the 2020 line to soon parallel the other lines, but at a lower level, due to the sales lost during the locked-in-your-house period.
And finally, let’s look at the history of prices in these valleys. The points on the charts below represents the median and average sold prices for a single month. The heavy lines are an 8-week moving average of those points.
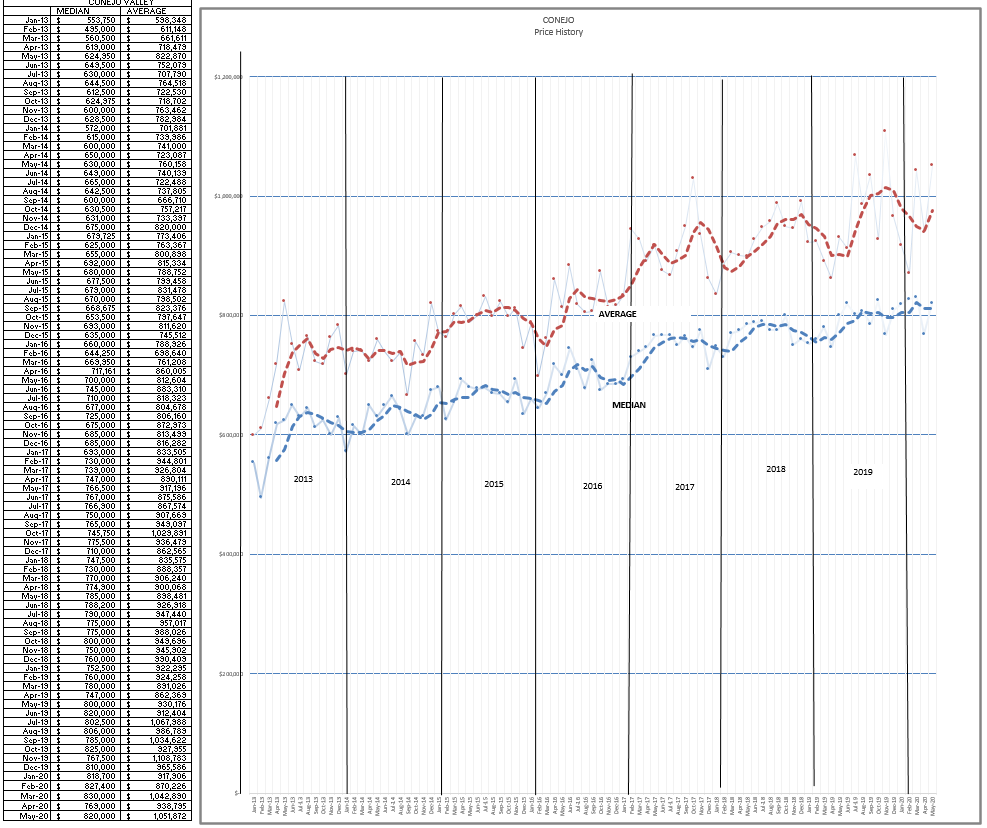
We have been through a most difficult time. Buyers were expecting to take advantage of collapsing prices. That has not happened. Our homes have intrinsically good value, and that value has not dropped. The economy will recover. We will add our previously proven methods of marketing to the newly learned virtual methods of marketing, and buyers, sellers, and agents will all benefit from this new-found efficiency.
Stay smart. Stay safe.
Chuck