The market has not disappeared. It has been hiding from the Covid monster, just as we have.
At the beginning of the pandemic, we negotiated being essential. That was not just a tactic to be able to continue to do business. Real Estate is essential. People need places to live. People have reasons to sell. People have reasons to buy. When people need to do something, and we help them, that means we are facilitating a market that is essential.
We think of health workers as essential, helping those who are sick. We think of food workers as essential, because people have a need to eat. Many of the things we used to consider of high importance, we have learned to temporarily do without. Things like airplane travel, stays at hotels, sporting events, restaurants. We look forward to enjoying those again. But we have learned that, at least temporarily, they are not essential. Food, health care, housing. Those things are essential. And because of that, we are essential. We help people find housing: sales, purchases, and rentals.
Why is that important? Because many of us looked upon housing as a desire, but not a necessity. This pandemic has made us all realize that we are dealing with an essential life requirement, a place to live. Because of that, the market has a lot of life.
My wife would like to buy a new car, hers is 13 years old. But she wants to wait until she could sit in a couple of cars, to drive a couple of cars. It is difficult to decide what to buy, and it is one of the most expensive purchases we make. The only more expensive purchase is to buy a home. How does someone decide to buy a home without sitting it, without “taking it for a test drive”? That is the challenge we face, and some of you have found excellent ways to provide enough information so that buyers are still comfortable buying.
Initially, we felt that prices would fall, we were afraid it would be another 2008. Those fears were unfounded. As you see, prices have remained strong, the market is healthy.
It has been difficult to accomplish our tasks because of the limitations this virus has place upon us. Lots of regulations, plenty of new forms. And through all this, people still manage to list and sell, to shop and buy. There are new tools to master, new ways to do business. When the virus has been defeated, some will go back to doing business in the old familiar ways. That is what many have been waiting for. But for others, the ones who have embraced the new tools, going “back to normal” will never be the same. If you have not embraced technology, better do it now or change your profession.
How is the market doing? Better than expected. The pandemic is not over, but the market is recovering. The need to sell is there, the need to buy is being frustrated by low inventory. Multiple offers are common. I suggest the market is exhibiting a lot of pent-up demand, and that will one day be met by an increase in inventory. The initiative that CAR has brought to the November ballot will help people move without giving up their lower property taxes, throughout the state, and that will generate an increase in the number of annual sales higher than we have historically been used to seeing.
As bad as it is now, with the opening of the economy stalled, and perhaps regressing, some things are improving. We had to learn how to sell homes without open houses, we had to learn how to buy homes without visiting seven homes in a day. Buyers and Sellers have learned to trust their agents to direct them. We have become much better at this than we were three months ago.
Now that we know that things were going badly, and now they are getting better, let’s look at the standard comparisons I have been making during “normal” times.
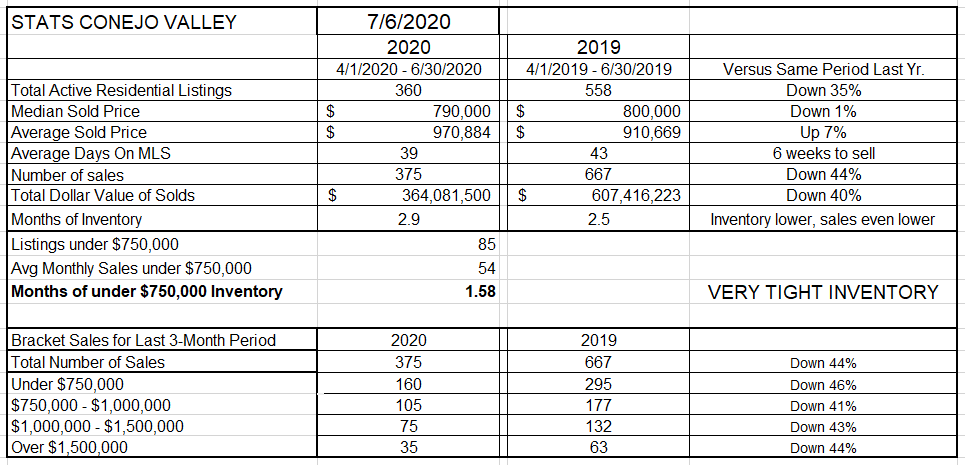
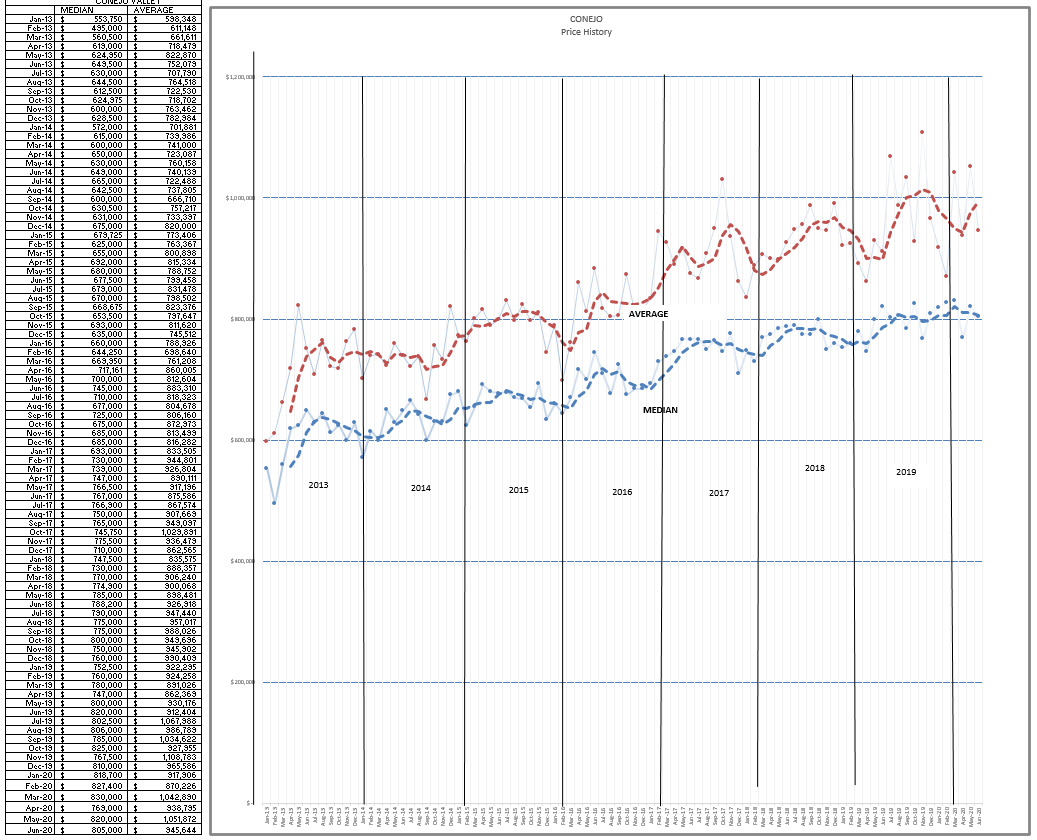
In the Conejo Valley, our inventory is down 35% from a year ago. If we just looked at people who need to sell, and forgot that people need (have a strong desire) to buy, we would have expected inventory to skyrocket. Not so, inventory has decreased along with the number of sales.
But what about prices? The Median price is down 1%, but the Average price is up a healthy 7%. The difference is due to more higher priced homes selling this year than last year. The only way to really know whether prices have risen or fallen is to look at specific models in specific tracts. But on average, prices are doing well.
How long does a home stay on the market? Shorter than last year, 39 days versus 43 days.
We expected the number of sales to be lower, particularly because we closed the offices and cancelled open houses. Sales are down, but they have made a recovery. I have been following Pending listings for the past six weeks. Six weeks ago we had 41 pending sales. Today we have 117. The increase has been consistent. We have learned how to sell homes in a pandemic. And as pending sales increase, they turn into increased sales. The months of sales represented by our inventory is still below three months worth of sales, and for homes under $750,000 is only six weeks worth. At the bottom of the table below, you can see that all price categories have been affected evenly. That is another indication of an improving market, a market getting healthier.
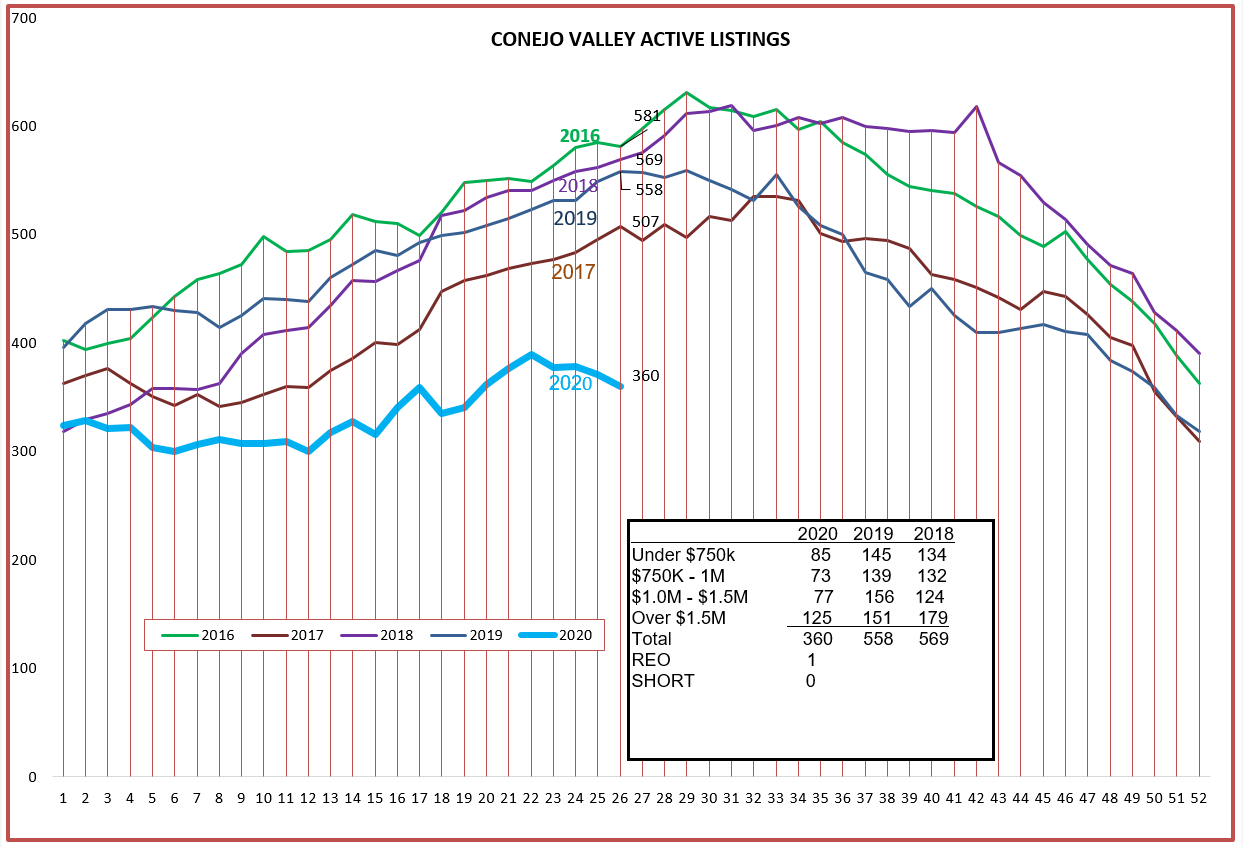
Let’s look at the inventory chart. We have the lowest inventory in five years. It has not grown dangerously high due to low sales, but rather new listings have kept up with sales.
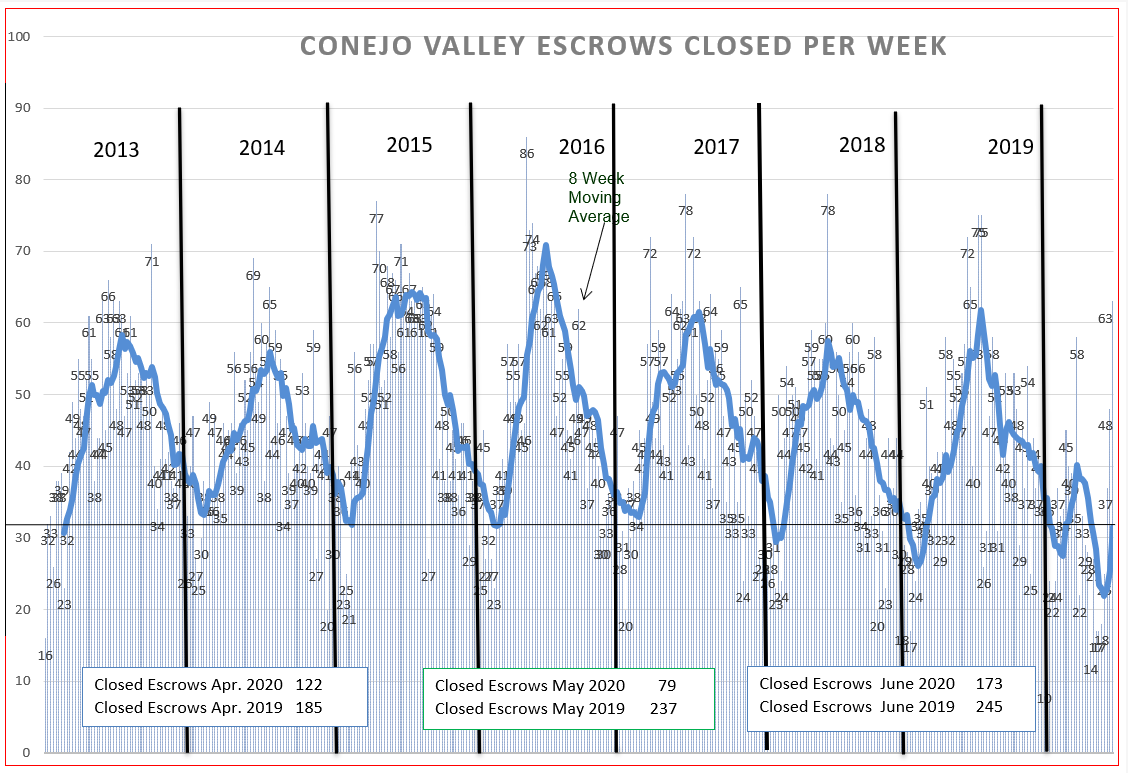
Next we look at those sales, compared to past history. This year started out normally, started out well. But then the virus hit, and things locked down. Look at what is happening now. Sales have been rising. The dark line represents an 8-week average, smoothing out the weekly ups and downs. Sales are now stronger than the usual January dip, and are rising strongly. Look the monthly boxes in the chart below. April was bad, May was worse, and June shows a strong rebound.
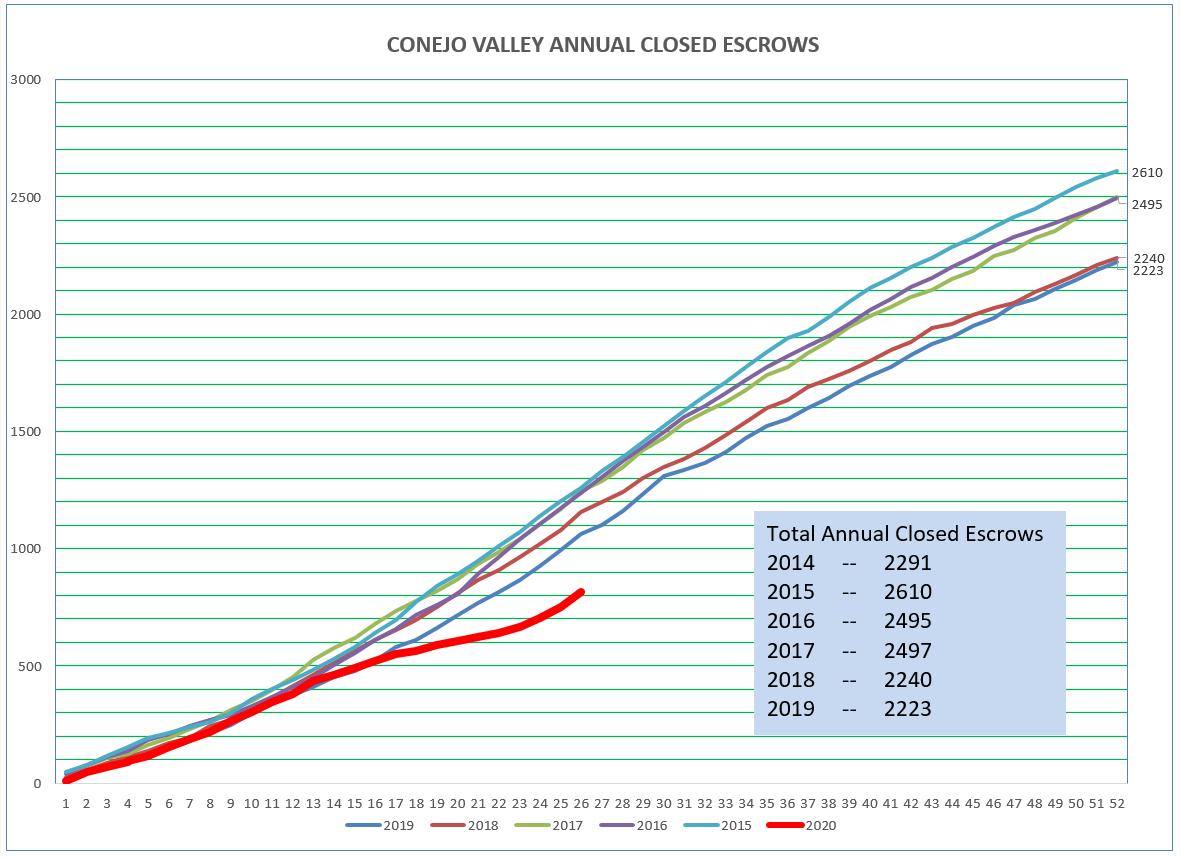
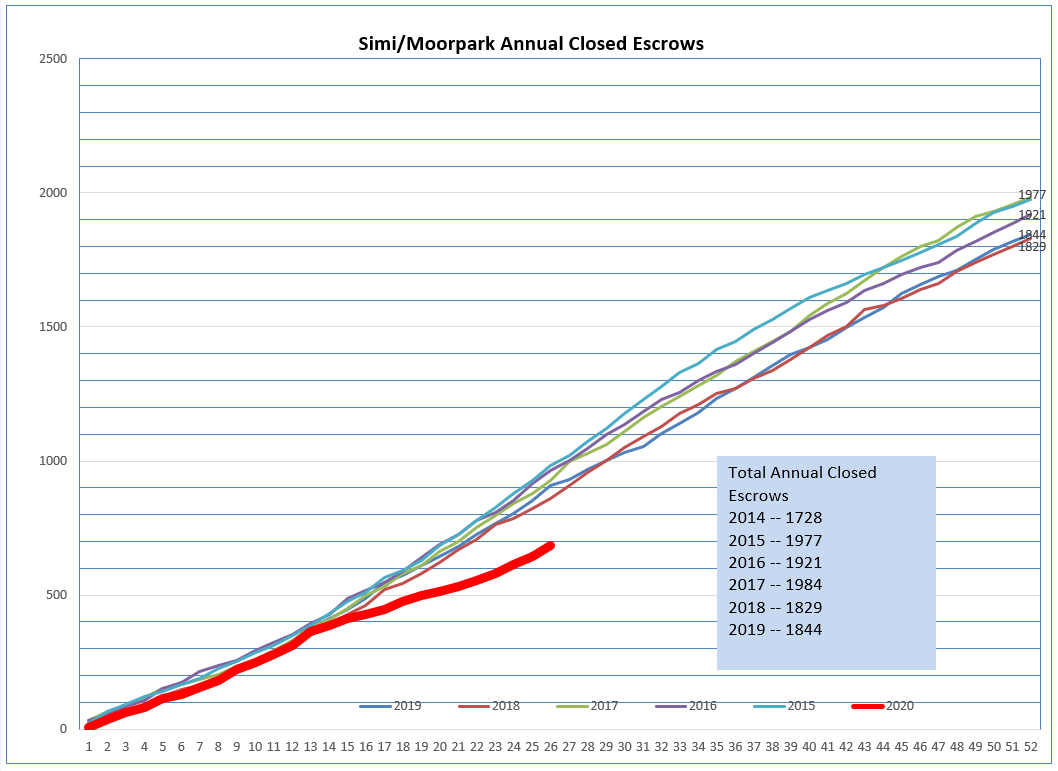
Below is a new chart which tracks the number of closed escrows as the total grows throughout the year. The drop in sales is easily seen in the red line below. But the dip has taken place, the slope of the line is beginning to parallel “normal” sales levels. We may end the year with a drop in sales, but it appears that sales are currently taking the right track.
Finally we look at the price chart. The Average price, strongly influenced by the percentage of high priced properties, is doing well, as is the Median price. Prices have not dipped to match the drop in number of sales or amount of inventory. Prices have weathered the pandemic very well, and are very strong.
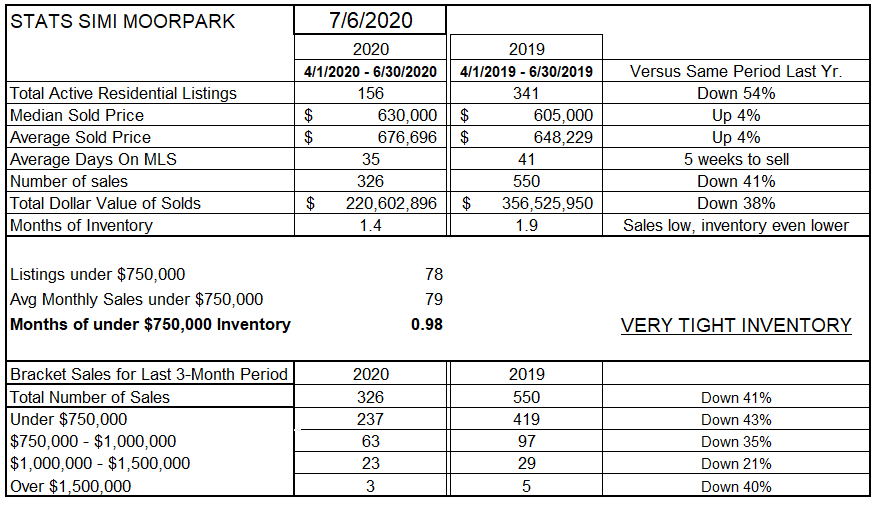
Next let’s do the same analysis on Simi Valley and Moorpark. Inventory is down 54%, while sales are only down 38%. That disparity has actually pushed prices up 4%, both Median and Average prices. Days on market is 35 versus last year’s 41, and even in this period inventory only represents six weeks worth of sales, only 4 weeks of sales for homes priced below $750,000. The decrease in sales is down around 40% for each pricing category. THERE IS VERY LITTLE INVENTORY. That factor, more than any other, is what has been preventing sales from taking off.
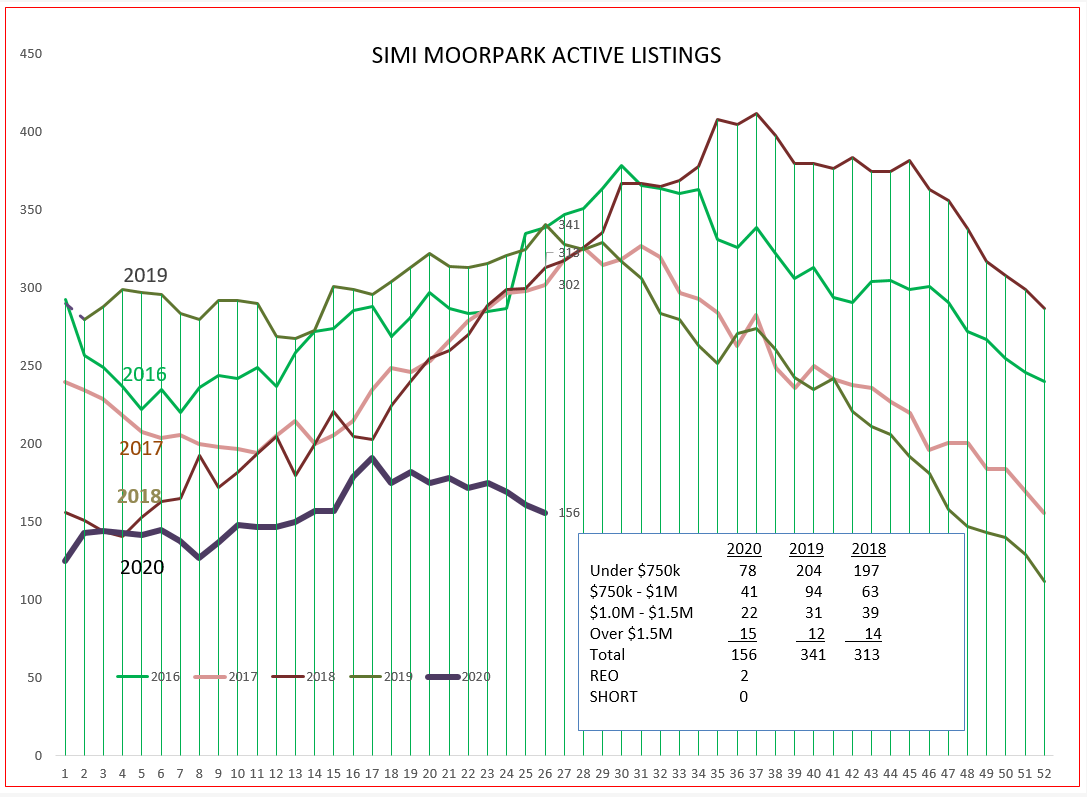
The inventory scarcity can easily be seen in the graph below. The heavy black line displays basically no inventory growth since the beginning of the year. Where has it gone? Into sales.
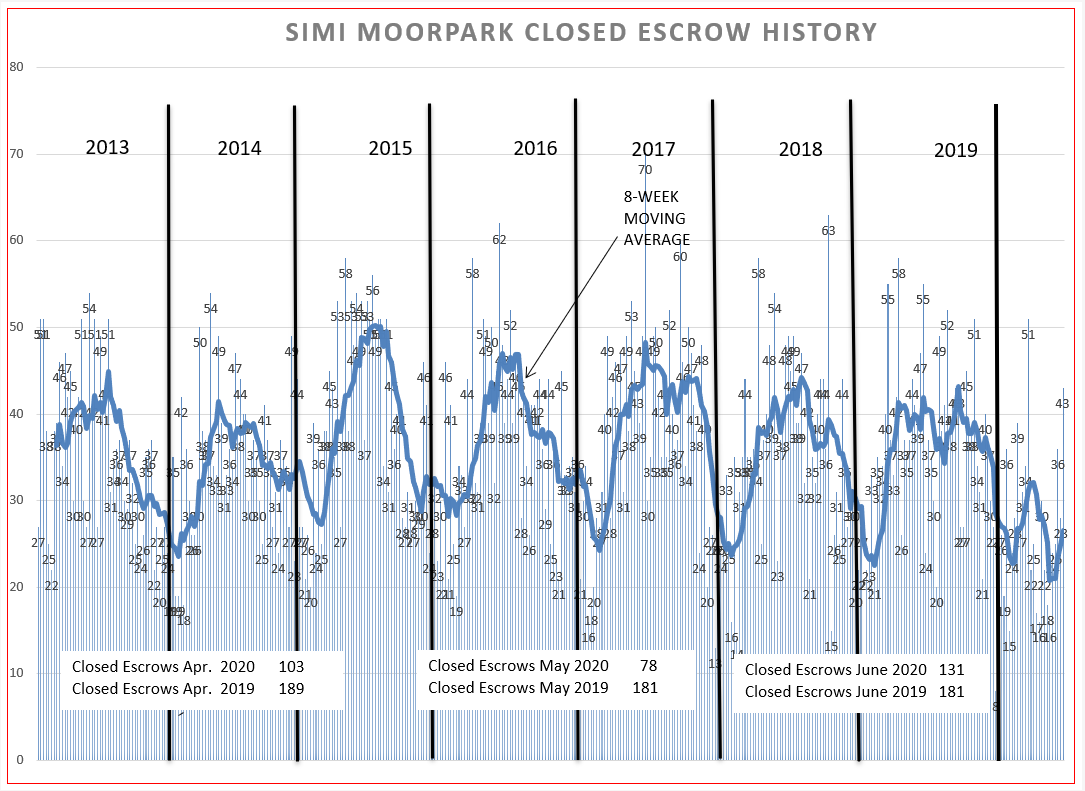
Like Conejo, there was the usual dip in January and another in March and April, but notice how the 8-week average is coming back strongly. And look at the boxes at the bottom of the graph. May and June 2019 had exactly the same number of closings. But the increase in 2020 from May to June is about 50% higher. A healthy market.
This can be shown more easily by the chart below. This chart tracks the number of closed escrows as the total grows throughout the year. The drop in sales is easily seen in the black line below. But the dip has taken place, the slope of the line is beginning to parallel “normal” sales levels. We may end the year with a drop in sales, but it appears that sales are currently taking the right track.
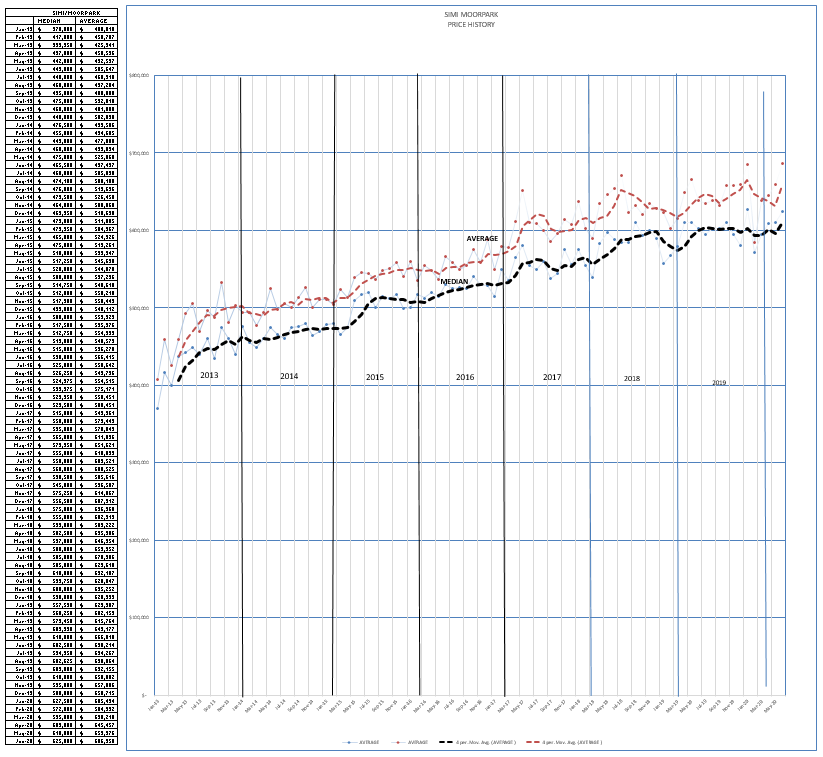
Finally, let’s see what prices have been doing. This chart records monthly median and average prices, not 8-week averages. As the first chart above show, prices have been strong, partly because there was very stable pricing in 2019. Even though sales have decreased, inventory has decreased even more, and prices has been supported by this imbalance.
We are not out of the pandemic woods yet, but we will be. And when things are better, the market will make up for some of the demand that has been limited. Just like my wife waiting to buy that car, there are a lot of buyers waiting to get a home, something they wish they had as they have been locked up in their apartments. Or the grown children locked up in the home owned by their parents. Everybody wants to get out!
Have you been learning to use the new technology that is available to help you do your job? There has never been a better time to learn. Nor has there been a more important reason to learn. This pandemic has caused the move to better utilizing technology to accelerate. Using technology is no longer an assist to your business, it it has become the core of real estate sales.
Stay safe. Stay healthy.
Chuck