“What’s past is prologue” is a William Shakespeare quotation from his play The Tempest.
I am not sure which is more pertinent, that the past is an indication of the future, or that we are experiencing our own personal Tempest.
Certainly our days are not being spent as we would like, considering how carefully we need to be conducting our lives.
The following comments may justify entire books be written, but I list them as generally accepted changes due to the pandemic:
- The housing market has not been severely damaged as it was in the past Great Recession of 2008. Prices and sales are strong.
- Large cities are sending their residents to the suburbs. Happily, we happen to be in the suburbs.
- The recession has sadly targeted renters, not homeowners, who are generally middle and upper class wage earners.
- Staying at home and working at home is very attractive, both for quality of living and personal investment. And avoiding traffic.
- Changes that were slowly evolving in our society received a supercharged boost, and are happening rapidly, in months, not years.
- Agents require strong technical tools in order to compete in this market.
- Mortgage rates are at historic lows and, reading the FED notes, it appears they will remain there.
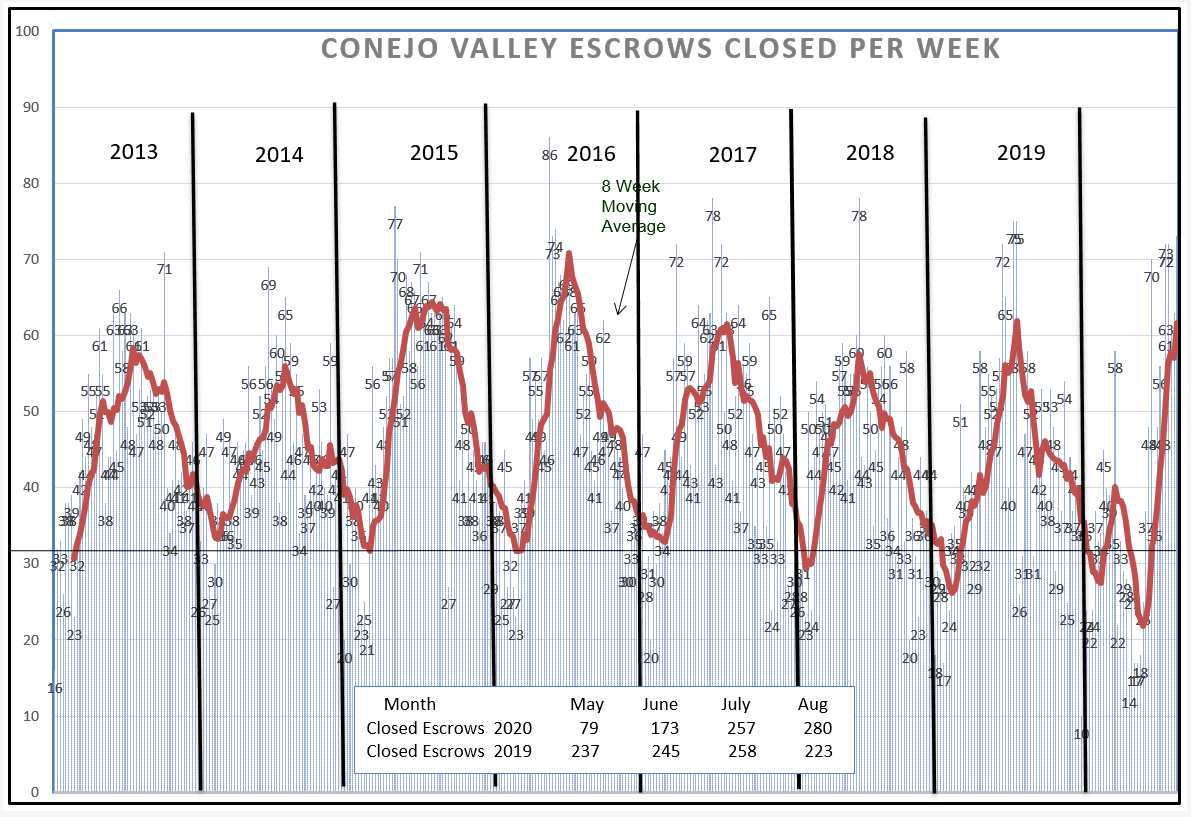
I want to begin with the Closed Escrow chart for Conejo. At first, sales were drastically affected, but currently we see monthly closed escrow matching past history. The year started out normally, but then took a second dip in April and May. This represents contracts written in March and April that closed escrow in April and May. The most interesting information is located in the box at the bottom of this chart. It compares the monthly numbers of closed sales this year versus 2019. While we were way behind, the past couple of months show unbelievable strength.
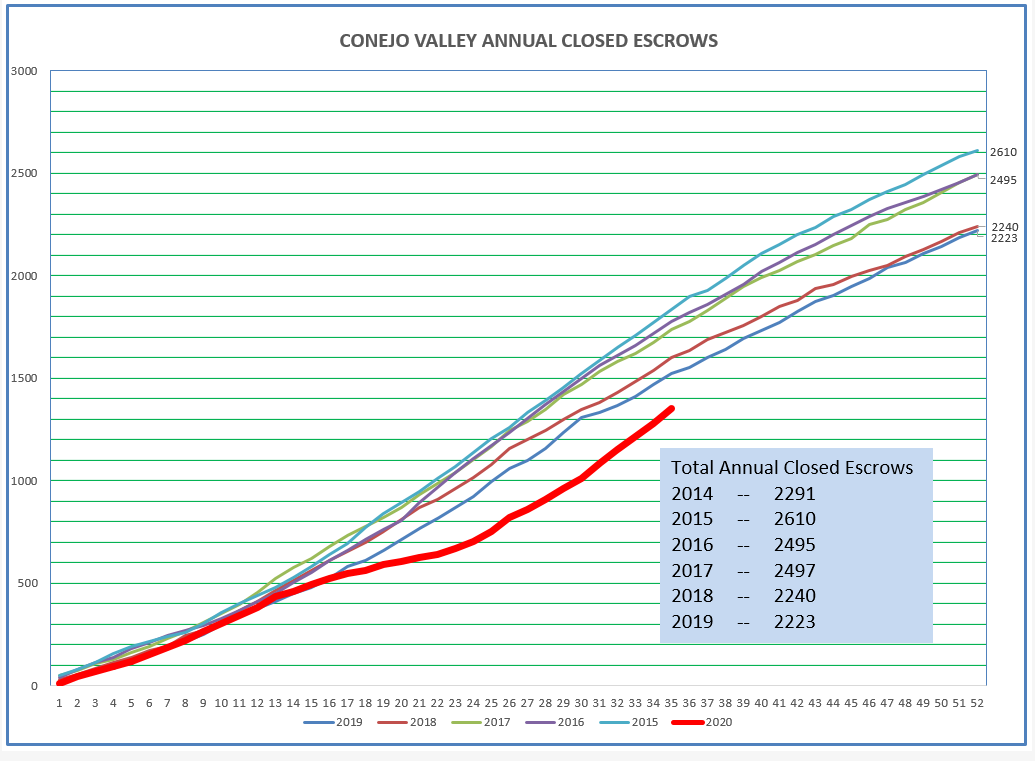
Another way to view how sales compare year-to-year is by comparing total sales as they progress during the year. The slope of the line is fairly regular year to year. But in 2020, sales plummeted in April and May. Look at what is happening now. A normal slope? Rising? Unexpected. This describes a very strong market, one which has returned to normalcy in times that are certainly anything but normal. The market is so strong, it is actually headed toward an end-of-year recovery of total sales originally expected.
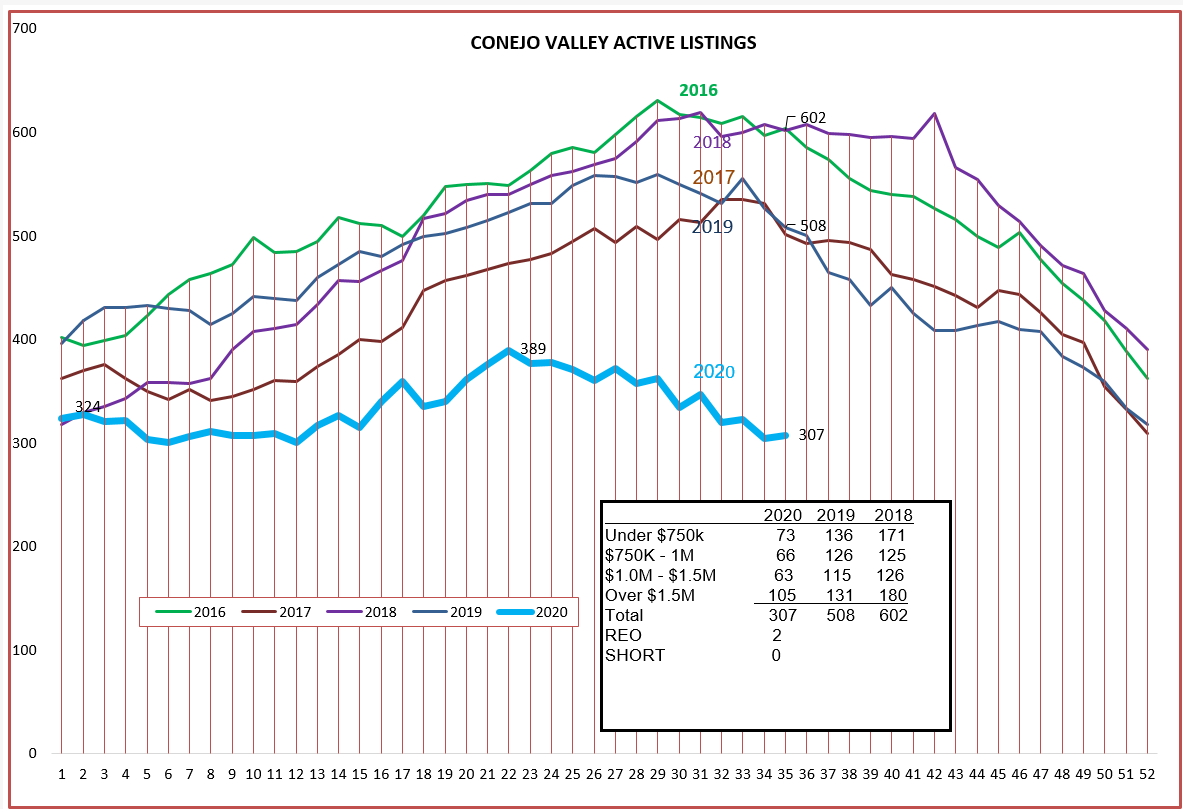
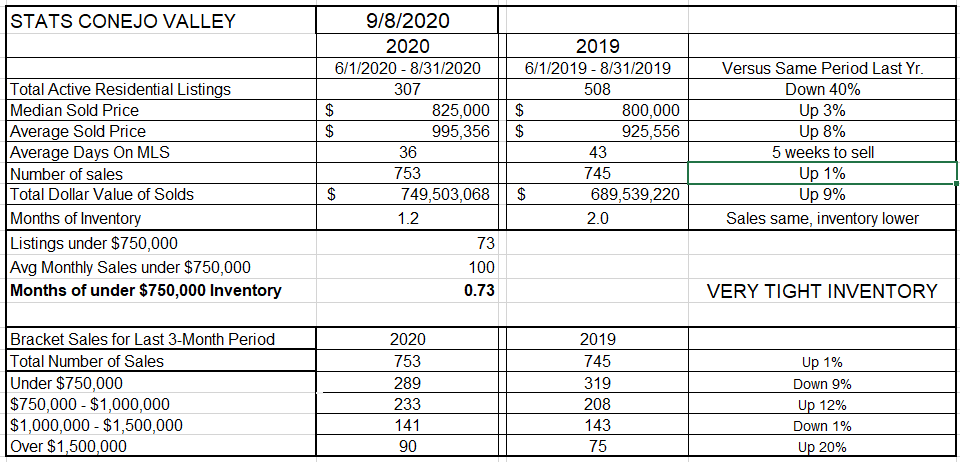
Sales in Conejo are very strong. But what about inventory? Did people sell off their homes when the pandemic began? Sales are strong, but are we building inventory? Just the opposite. We began the year with 324 listings and ended August, the month that usually sees inventory growth turn downward, with 307. Inventory never experienced the normal growth this year. The inventory is so low, one has to surmise that sales would be even higher if more inventory was available. Only 300 active listings this month, when the past history for August is between 500-600 listings. Inventory is low in all price categories.
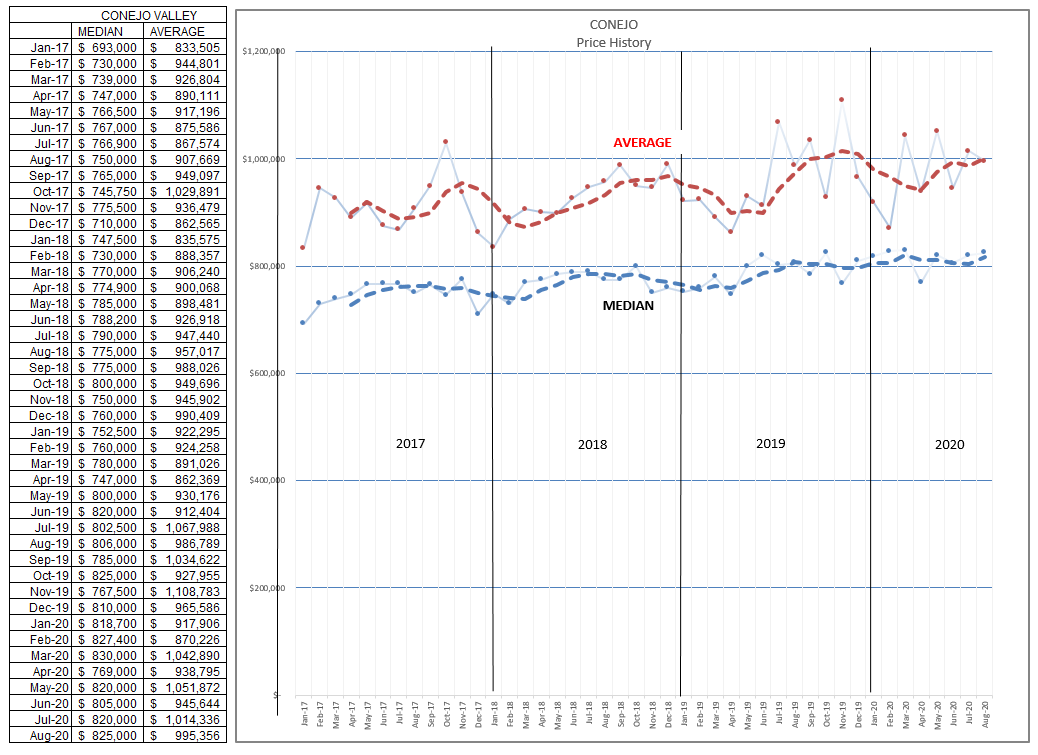
With low inventory and strong sales, we would expect prices to be very strong. But during a pandemic? With everyone staying inside? With open houses verboten? With agents doing business from home? Prices are strong, with the Median now at $825,000. Average prices have fluctuated wildly, due to the influence of strong high-value sales since July of 2019. Maybe some of those wealthier LA residents have decided to move to our very nice and relatively less expensive high quality homes in the Conejo. I don’t have any data on that, just a feeling. But high value sales have been very strong.
Finally, let’s look at how the numbers compare. Compared to a year ago, inventory is down 40%. Current sales represent only one month worth of sales, and if you can find listings under $750,000, those are selling in three weeks. Look next to the bottom of this chart. Compared to last August, total Conejo sales are up 1%. But in the price brackets, sales of homes priced below $750,000 are down 9% (no inventory). Sales of homes priced between $750,000 and $1,000,000 are up 12%, homes priced between $1,000,000 and $1,500,000 are about even, and sales of homes priced in excess of $1,500,000 are up a whopping 20%. That number is what has been influencing the Average price.
Median prices are up 3% and Average prices up 8%.
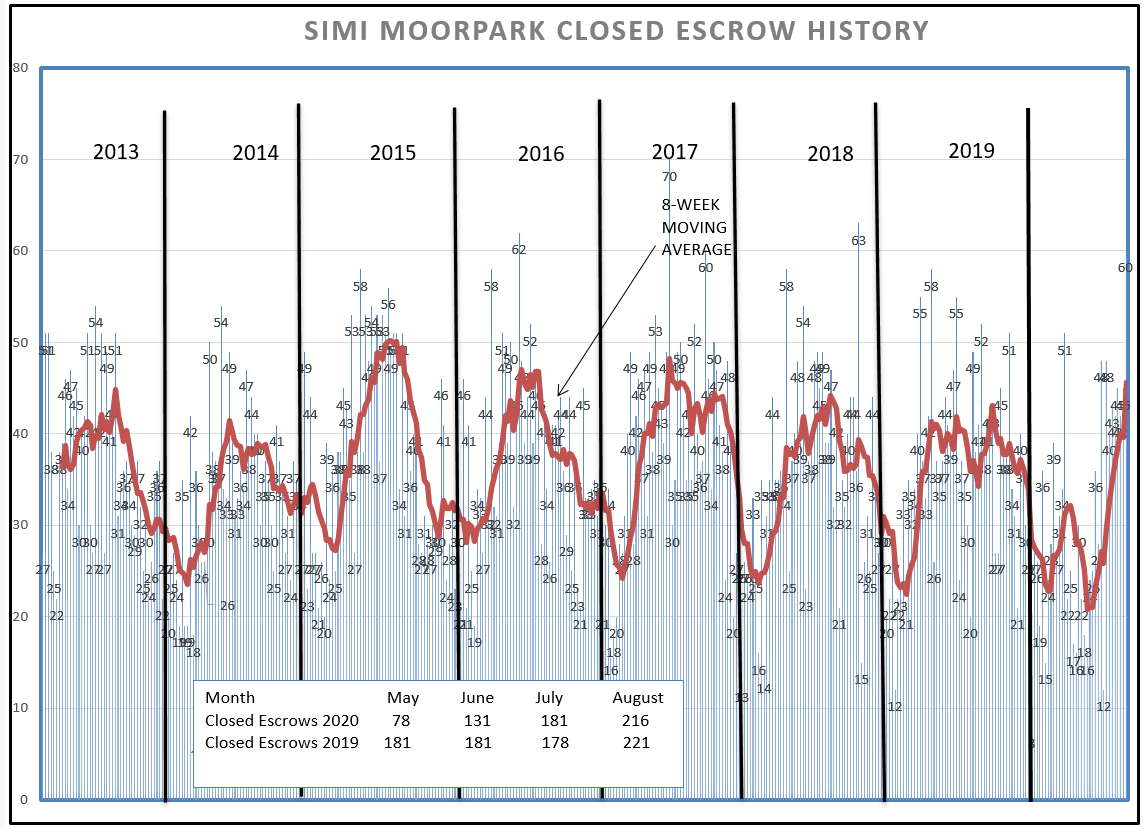
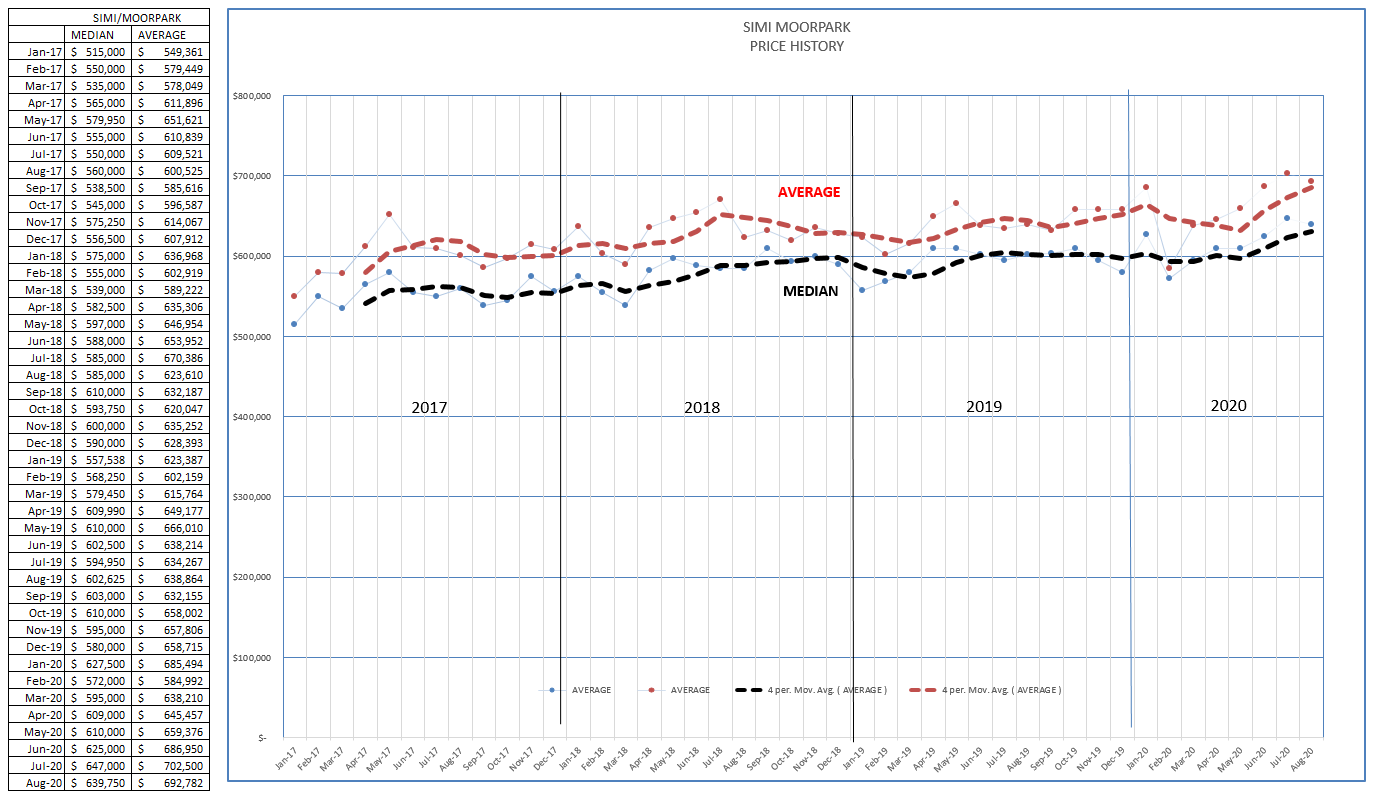
Now let’s turn to Simi Valley and Moorpark. We see the same pattern, with an unusual second dip to begin the year.
The most interesting information is located in the box at the bottom of this chart. It compares the monthly numbers of closed sales this year versus 2019. While we were way behind, the past couple of months show unbelievable strength.
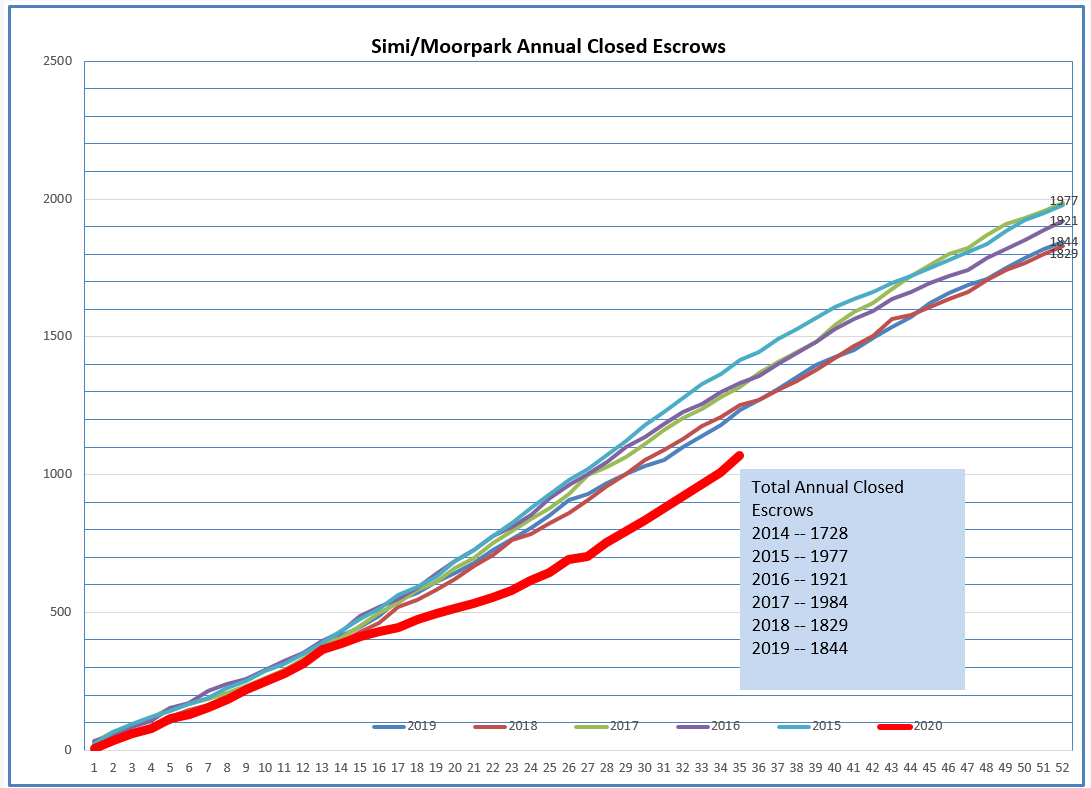
This is exactly the effect we saw in the Conejo valley. Another way to view how sales compare year to year is by comparing total sales as they progress during the year. The slope of the line is fairly regular year to year. But in 2020, sales plummeted in April and May. Look at what is happening now. A normal slope? Rising? Much better than expected. This describes a very strong market, one which has returned to normalcy in times that are certainly anything but normal. The market is so strong, it is actually headed toward an end-of-year recovery in total sales.
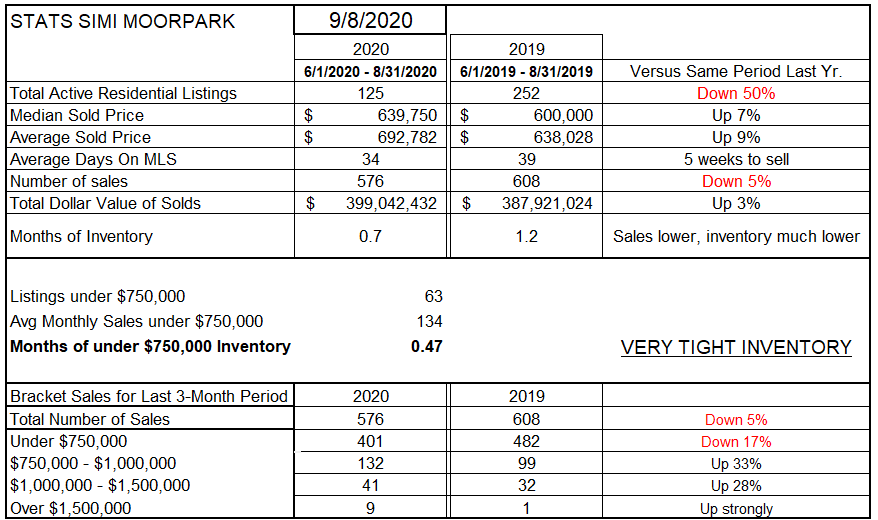
What makes this sales rebound even more remarkable is that this is happening in a period of basically no inventory. Total inventory actually dropped to 101 units a couple of weeks ago, and now stands at only 125 active listings, exactly the number we began the year with. While inventory is low in all price ranges, pay attention to the inventory of homes priced below $750,000 for 2020 and 2018. In 2018, there were 284 active listings, versus only 63 active listings this week. Basically no inventory at all.
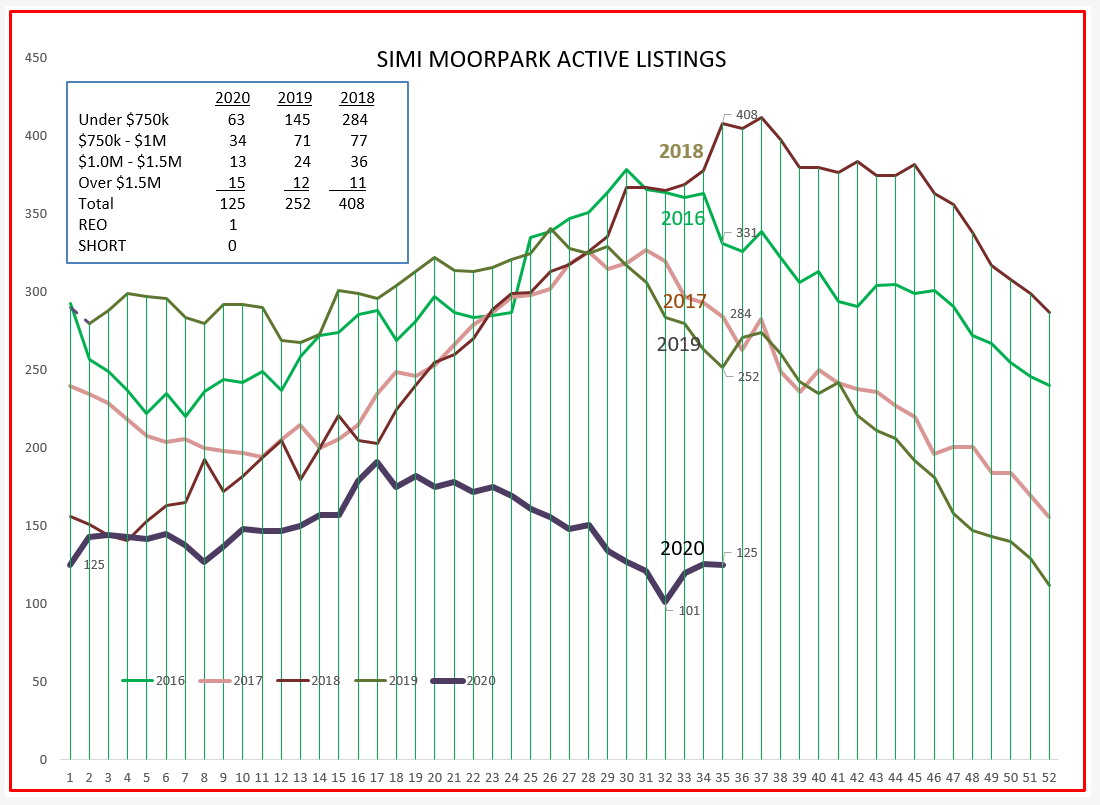
A lack of inventory coupled with strong sales should result in price increases. During 2019, Median prices were very stable around $600,000. In the past few months, they have jumped to $640,000.
We have seen the graphs, now let’s view the numbers, compared to last year. Inventory is down 50%, while sales are down only 5%. Certainly the lack of inventory is responsible for sales numbers being slightly lower. The Median price is up 7%, the Average price up 9%. Inventory represents only three weeks worth of sales, only two weeks worth of sales for homes priced below $750,000. At the bottom of this chart, sales of homes priced below $750,000 are 17% lower than last year (3 months for each). That category represents 70-80% of usual homes sales in Simi/Moorpark. All other price categories are also very strong.
If anyone would like to see what a seller’s market looks like, visit Simi/Moorpark.
The housing market is extremely strong, much stronger than anyone thought it would be. Sales dropped when the pandemic hit in March and April. By being locked in our homes, having a nice home became a very attractive way to live. Mortgage rates are more than 1% lower than a year ago, lowering the monthly carrying cost of owning a home. During the pandemic, saving rates skyrocketed, as we could not travel, we could not go to dinner, we drove very little, we bought practically no gasoline, we found out we could buy the essentials on Amazon, and we could use those savings to buy a home, or move to an area that we now considered to be more attractive.
If you have not been learning and utilizing the tools needed to do business from home, to market and “show” and handle contracts and documents from home, you had better catch up quickly. This will be with us through probably the rest of this year. After that, don’t expect things to return to the ways of old. The change to new methods of marketing and selling homes were already underway, and would probably have taken a few years. Those changes happened this year. Thanks to the pandemic, we have rocketed forward, the market has changed quickly, and changed forever. Misquoting the Lone Ranger, we will never “return to the days of yesteryear.” The market has changed forever.
Exciting times.
Stay safe, and stay well.
Chuck