Will we see the usual decline in inventory and sales as the holiday season approaches this year?
Or has COVID cancelled our holidays, and therefore cancelled the holiday sales slowdown?
There seems to be no end to the appetite of home buyers.
I will cover our two valleys separately, as they are behaving differently, primarily due to the state of inventory.
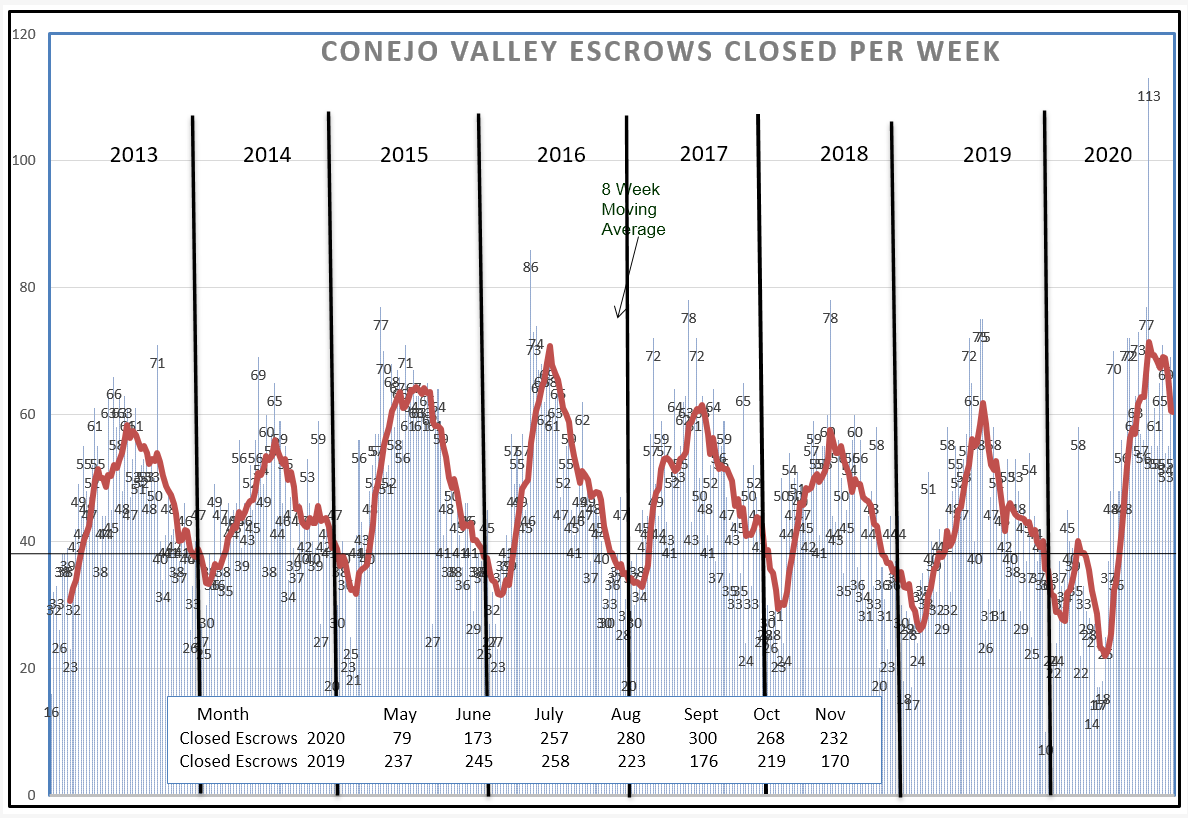
Let’s start with Conejo Valley. In 2020, we achieved both the lowest and the highest in the last 8 year history both for an individual week and in the 8-week moving average. Just a couple of weeks apart. A roller coaster. Everyone expected the market to react negatively due to Covid, and it did. But the rebound was remarkable. Look at the box in the chart below and compare the monthly closed escrows. After the initial mid-March closedown of the economy, and the sorting out of which businesses were essential and how they could continue to work, escrow closes were drastically affected 45 days later, in May. June saw the beginning of the housing market recovery, and since then sales have continued strongly in the face of the pandemic.
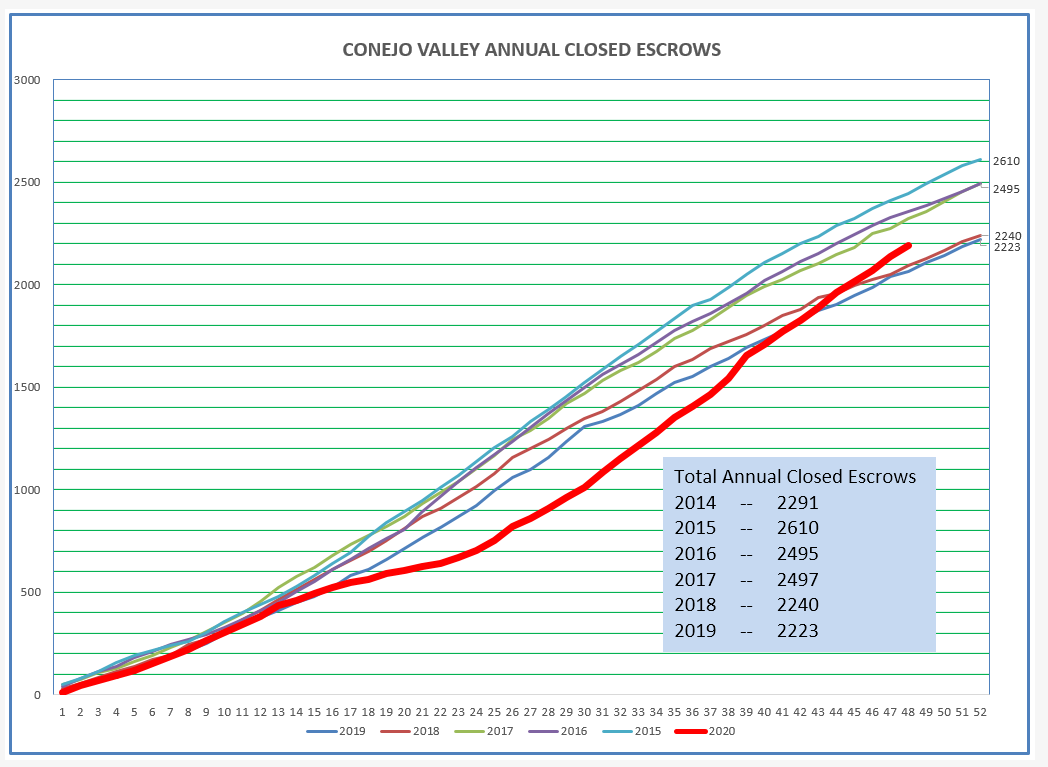
Another way to view this information is by charting the year-to-date total sales. The heavy red line (2020) shows how far below “normal” we dropped. However, we are now on track to finish the year with total closed escrows approaching one of the highest number in the past six years.
So why is that? My feeling is that homes have become more attractive, versus apartment living. Homes further from the central city, which we call suburbs, have become more attractive now that working remotely has replaced our previously tedious work commutes. Our way of life is changing, probably for the better. When this pandemic is over, we will not return to doing business as we did in 2019. Amazon has my house on their daily drop-off schedule. Zoom was developed at just the right time. We will not stay locked in our homes, but we will no longer be required to only do business at the office. We may one day return to broker caravans, or will we? The passage of Prop 19 will produce an increase in inventory due to the ability of many previously locked-in homeowners now able to transfer their Prop 13 lower taxes to their new homes. We need those homes to expand our inventory, We need to build different homes that accommodate our changing lifestyles.
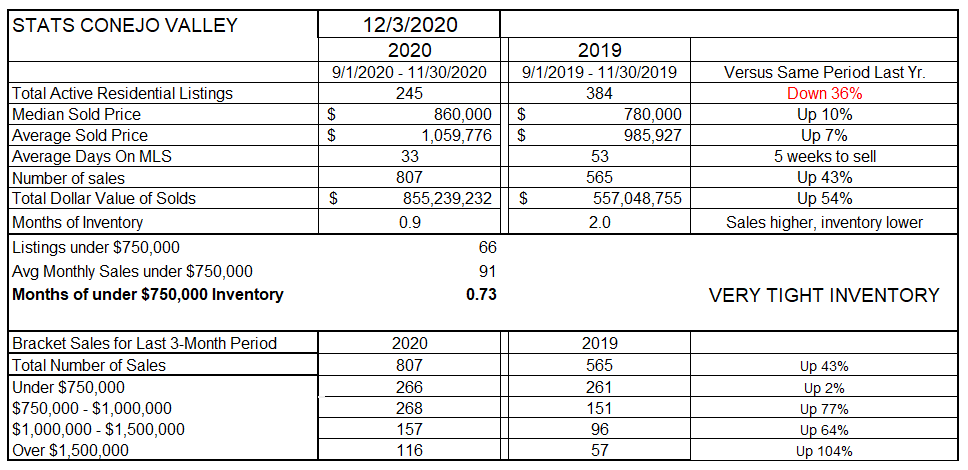
The spreadsheet below gives us comparisons of what has happened during a 3-month period of time versus the same time period last year. Inventory is down 36%. The number of sales were up 43%. This combination of higher sales and lower inventory leaves us with less than one month worth of inventory. That combination has pushed home prices higher, 7-10%, Going to the bottom of the chart, the lowest sales volume increase in all price segments is in the under-$750,000 range. That is because there are fewer and fewer homes available in that market. Our median price is now $860,000. Record low mortgage rates have allowed home mortgage payments to be more affordable, making homes more affordable.
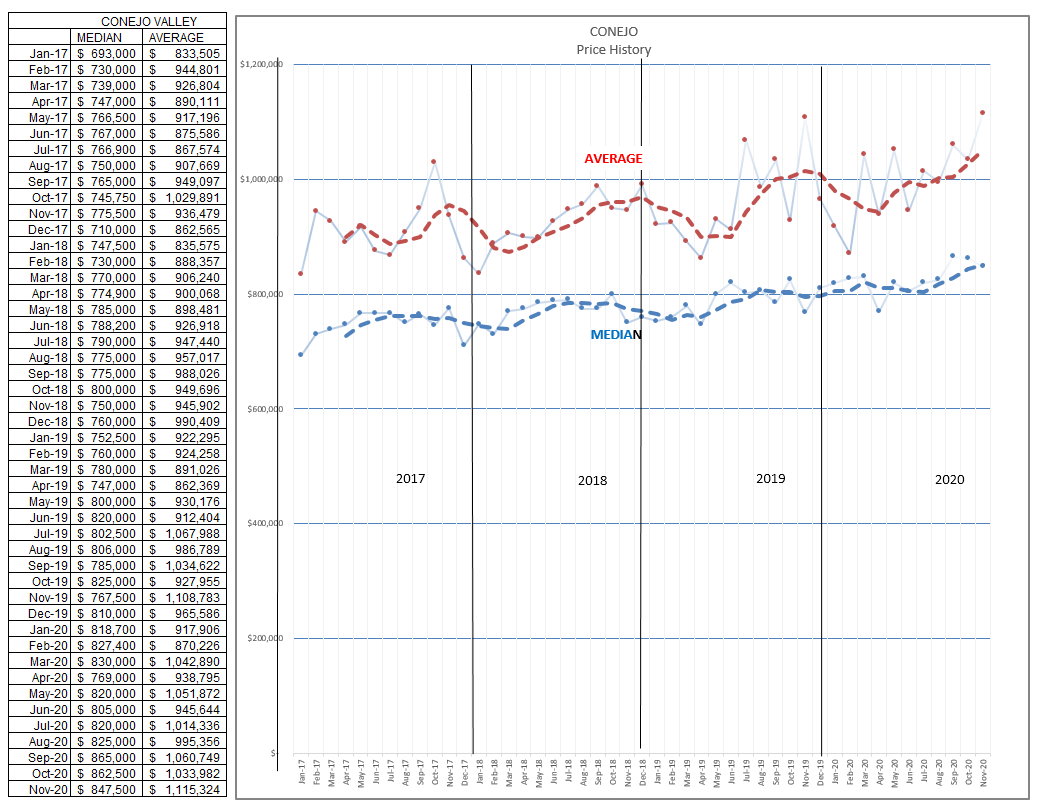
The chart below represent the median and average prices for each month (not for 3 months). From the middle of 2019 until the middle of 2020, Conejo median prices remained very stable. Since the middle of 2020, they have risen extremely strongly. Supply and Demand Works!!
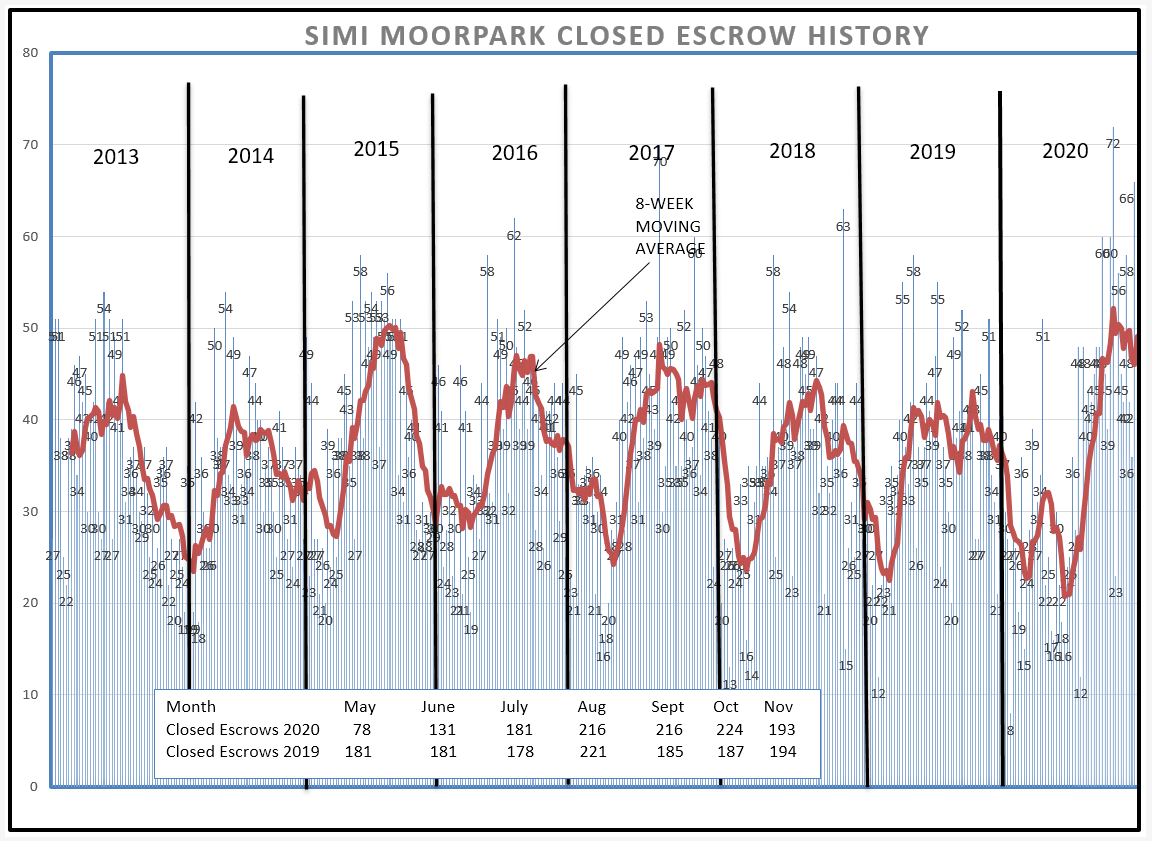
Now on to Simi Valley/Moorpark. We experienced the same dip in May, began to recover in June, but the strength seen in the Conejo was not experienced. Strong, but about on par with 2019. Look at the numbers in the box within the chart below.
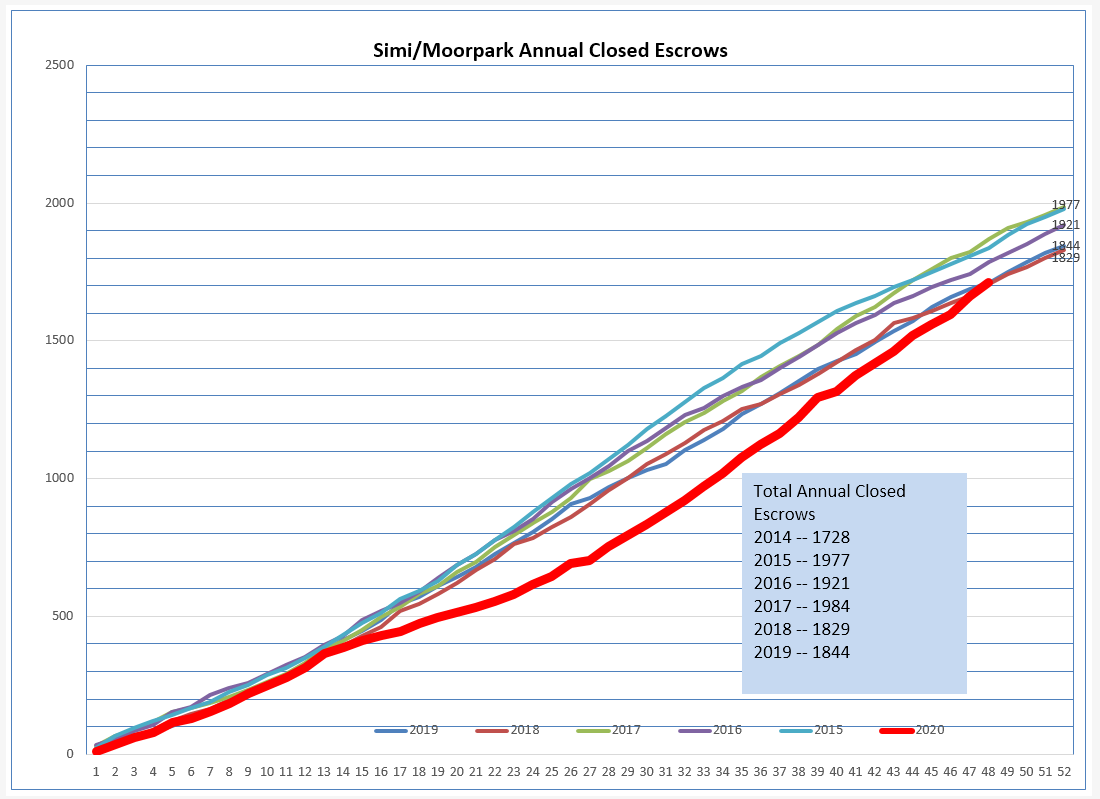
 The cumulative number of sales has returned to compare with previous years. In other words, the number of sales are now equal to what we would have expected if the pandemic had not happened. We should finish the year about where we thought we would. Good, but it does not explain why.
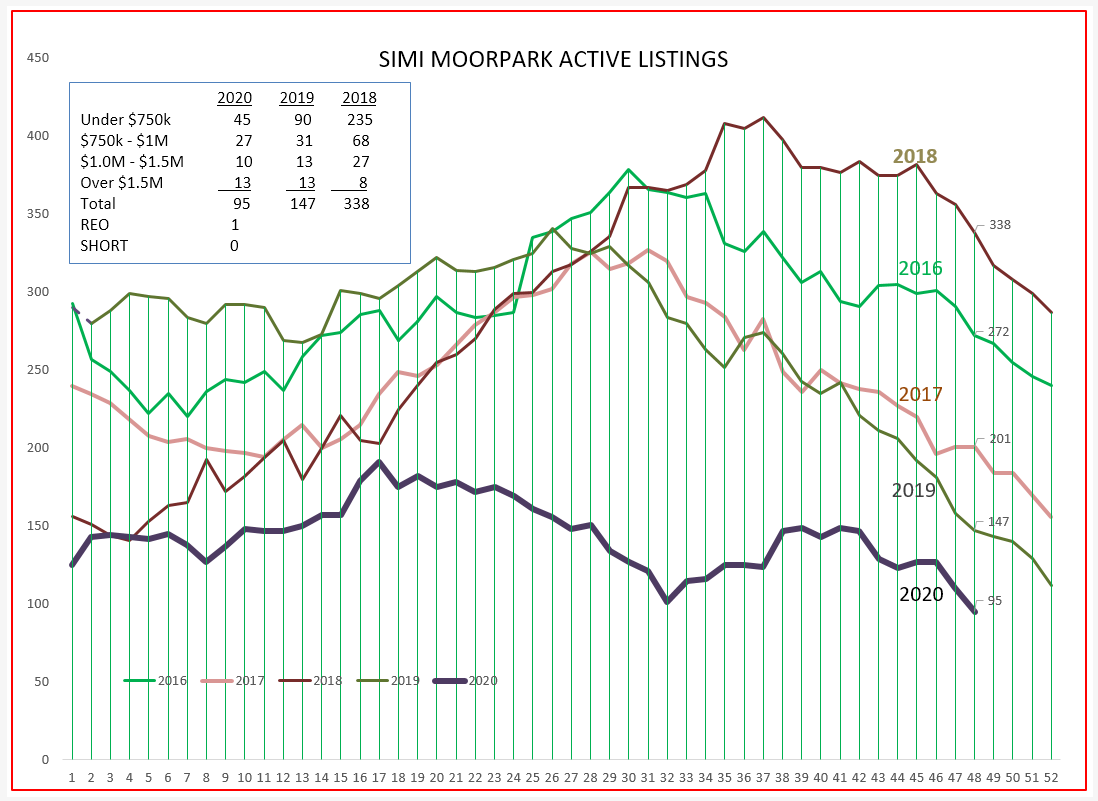
Why is that? Inventory. Inventory never grew as normally expected. It stayed the same since the beginning of the year, flatlining. Homes were being snapped up as quickly as they were placed onto the market. Look at the number of homes listed in the box within the chart below, particularly the homes priced below $750,000. The vast majority of homes sold in Simi/Moorpark are below $750,000. We currently show the number of listings in this range at 45 homes. 45. Just this side of nothing. Two years ago we had 235 homes at this time. Last year we had 90. This year, 45. Nothing.
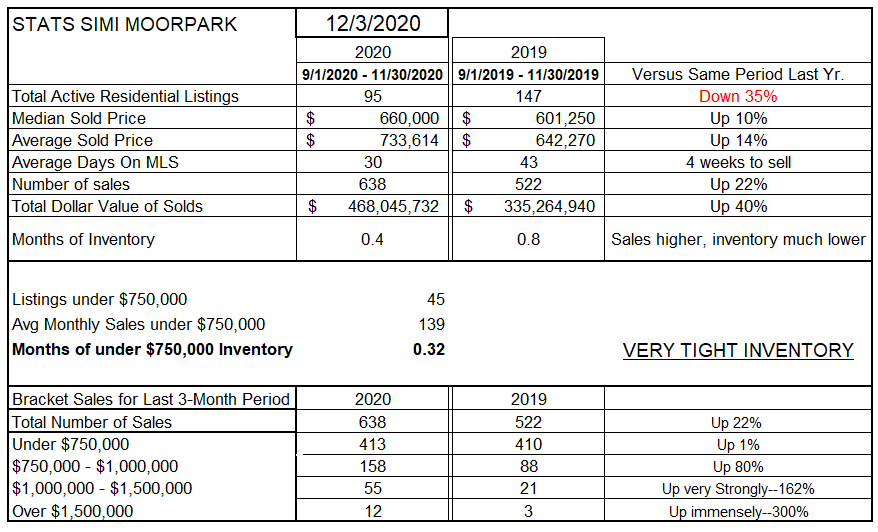
Let’s look at the 3 month comparison spreadsheet. Inventory of homes in all price ranges is down 35%. Sales are up 22%. Prices are up 10-14%. Roughly 1% a month on average.
Inventory of all homes is less than two weeks worth at this sales level, and just over one weeks worth for homes priced below $750,000.
Next, look at the lower portion of this spreadsheet which shows the comparison of sales for the past three months, 2020 versus 2019. Sales volume is very high in all categories except for homes priced below $750,000. Only up 1%. For the price category that represents the majority of homes sold in Simi/Moorpark. Last year, 80% of all homes sold were in that category. It represents the bread and butter sales for Simi/Moorpark. Why is it up only 1%?
Because of inventory. There are no homes available to be sold. Inventory for this category represents ONE WEEK of sales.
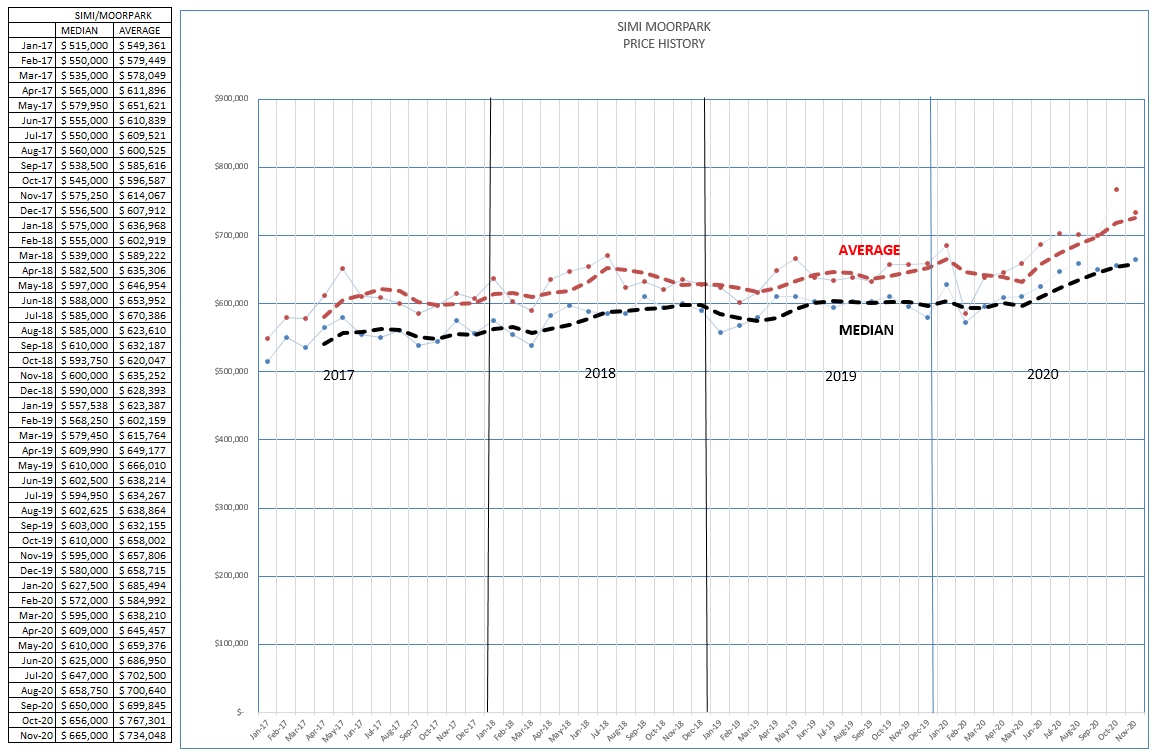
Finally, let’s look at the price chart, where the price points represent each individual month. From mid-2019 to mid-2020, very stable pricing. From mid-2020 to current, taking off like a rocket. Supply and Demand works!! If only we had more homes to sell, we could sell more.
The market is telling us that things have changed dramatically. Prices have responded both to supply/demand and to the new normal of why homes are now more attractive in our suburban areas.
This is what I see. This is what I think. Please let me know your thoughts.
Please stay safe, continue being wise, wearing masks and social distancing and, yes, staying and working from home.
None of us can wait for 2021. And the vaccine. And for a return to normal.
Chuck