When the pandemic hit, everyone expected the real estate market to be crushed, along with most of the economy. Let’s look back and see what happened.
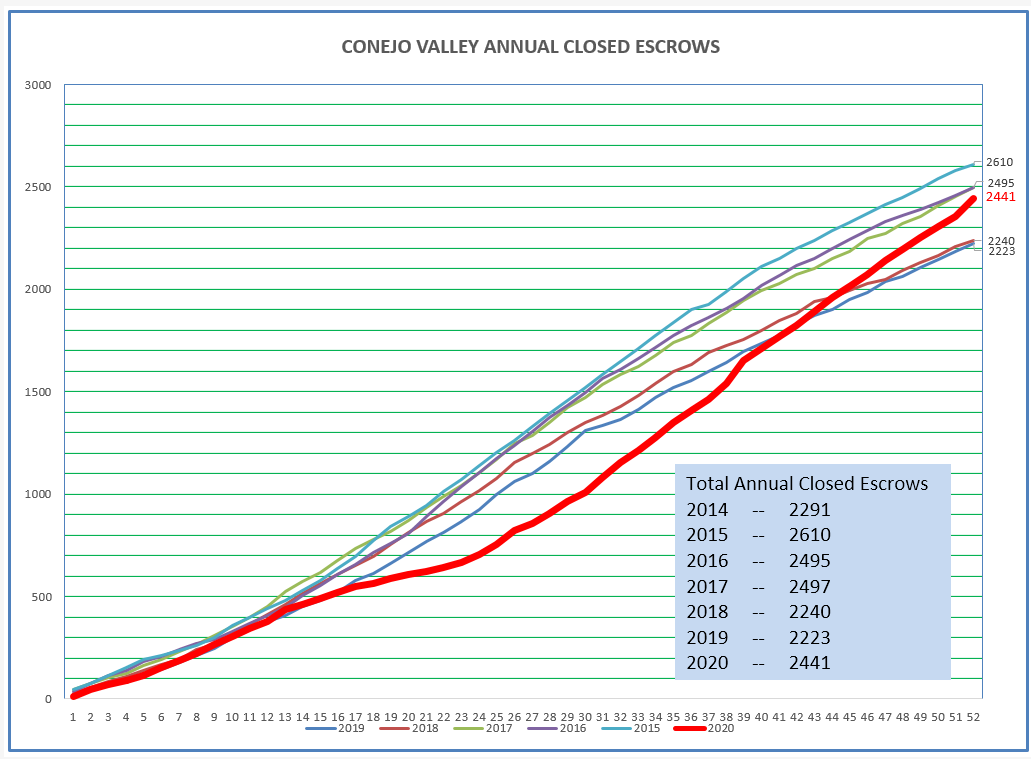
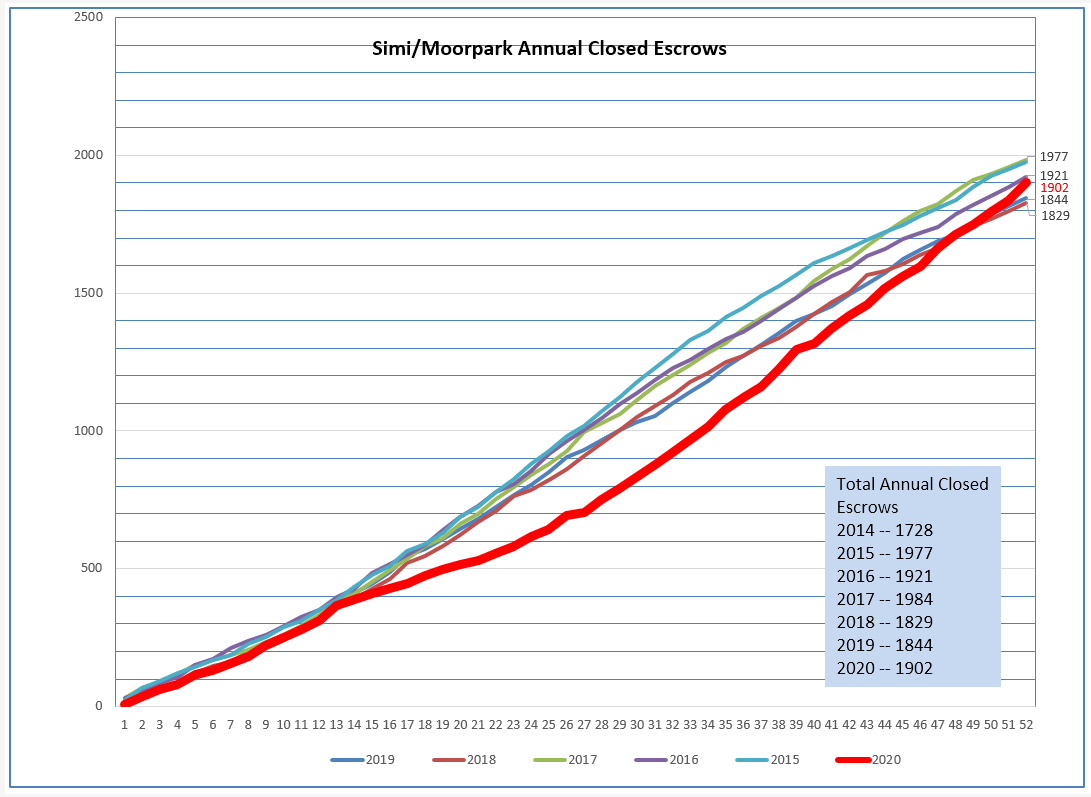
I usually begin with other charts, but I think this one explains the year better than any other. It displays a running total of closed escrows as the year progresses. In April, you an see the red 2020 line take a severe dip. This happened for about two months. Then the line began to recover, and ended the year right in the middle of what we expect for closed escrows in an “average” year. But this year was anything but average. To finish where it did, the market had to turn very strong, not only reaching normal levels as the year progressed, but actually making up the sales lost in April and May. As a result, this market is finishing the year much stronger than we have seen in in recent times.
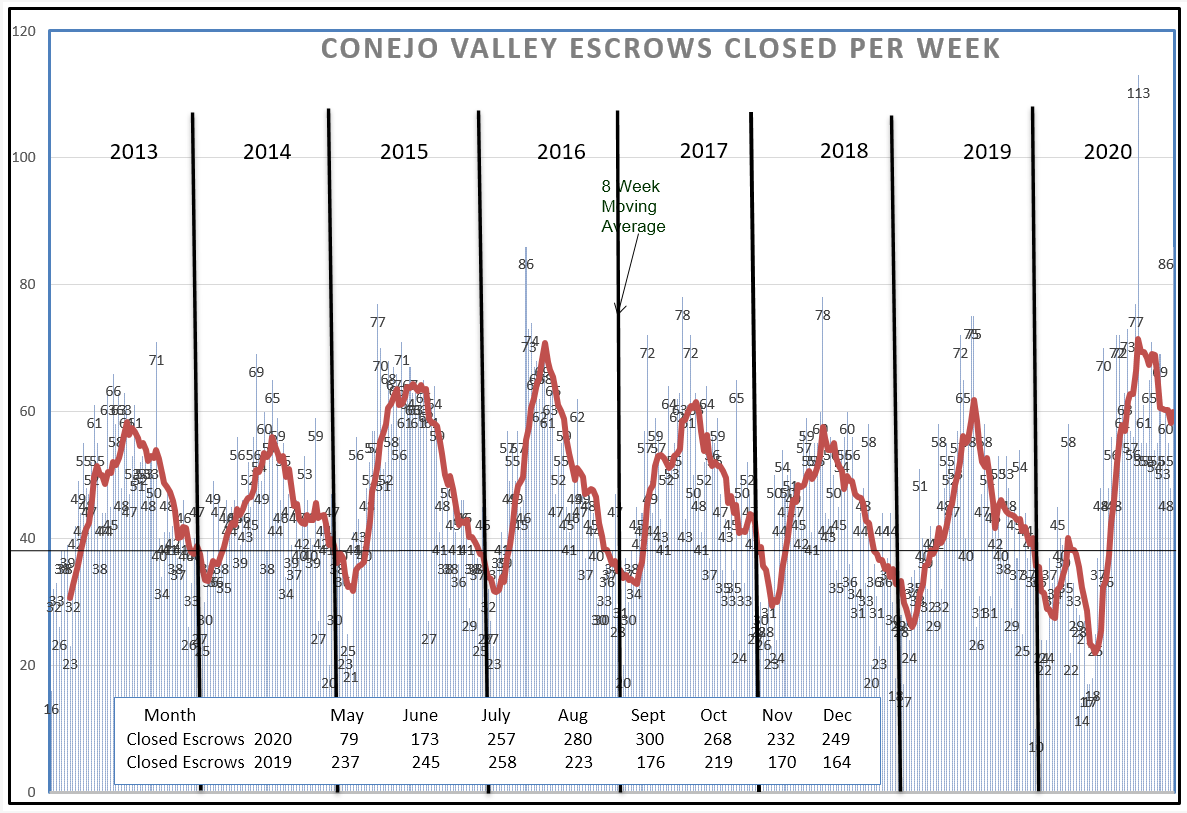
The chart below is a different way of displaying the closed escrow history. Normally, the year begins with a dip, since the end-of-year holidays usually drain the air out of the market. This year, we had two dips, one caused by the holidays and the second caused by the pandemic. The market normally peaks in June, and then winds down toward the end of the year. Besides hitting a record high 113 closes in one week, this market is finishing the year at an extremely high level of sales. Look at the box within the chart. Since July, closes have averaged between 250 and 300 per month. As noted above, we are finishing the year at a very elevated sales level.
All those sales have drawn down our inventory, currently roughly half the number in 2019 and only a third as much in 2018.
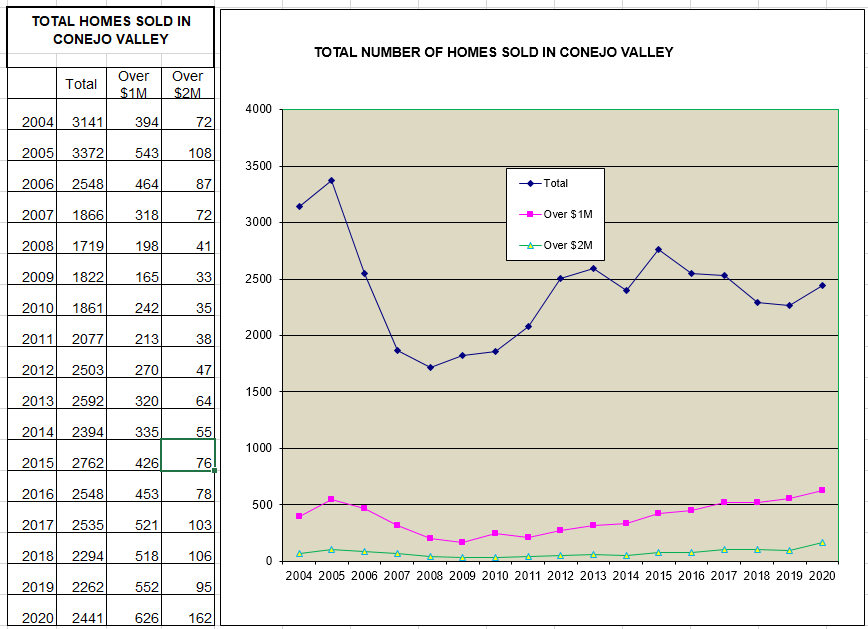
How have sales in 2020 compared to previous years? In total numbers, the year was about average. But look at the bottom of this chart, with the pink line representing those sales between $1-2 million and the green line representing sales over $2 million. More expensive homes have been selling very well this year. But the real bump was in homes priced over $2 million, 50% higher than previous years. Much of this can be attributed to the pandemic, and movement out of Los Angles proper to the suburbs.
Finally, let’s look at the Conejo results in our main statistical chart, which compares three months worth of sales at the end of 2020 to the same three months at the end of 2019. Inventory is lower by 45%. Prices are up by 8% over last year. It only took 5 weeks to sell a home this year, versus 7 weeks last year. And, based on current sales, the inventory only represents three WEEKS of sales. At the bottom of the chart, 2020 sales of homes priced over $1.5 million were double the number in 2019 for the final three months of 2020.
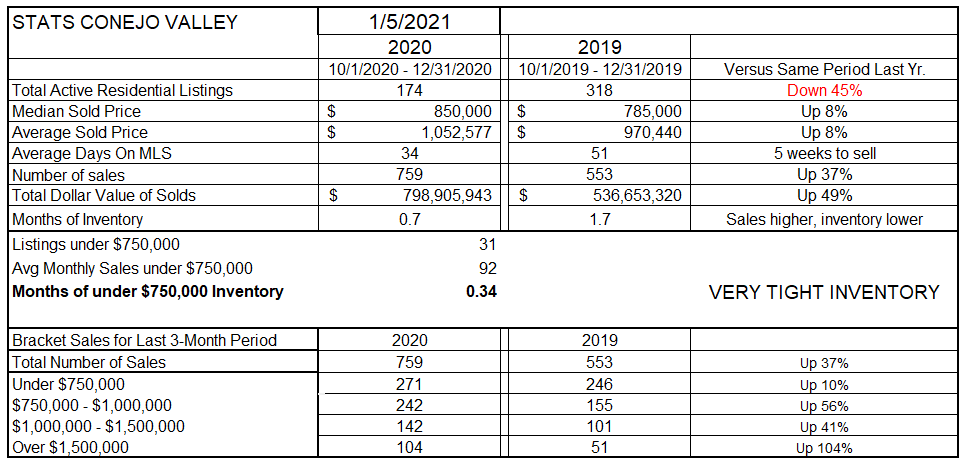
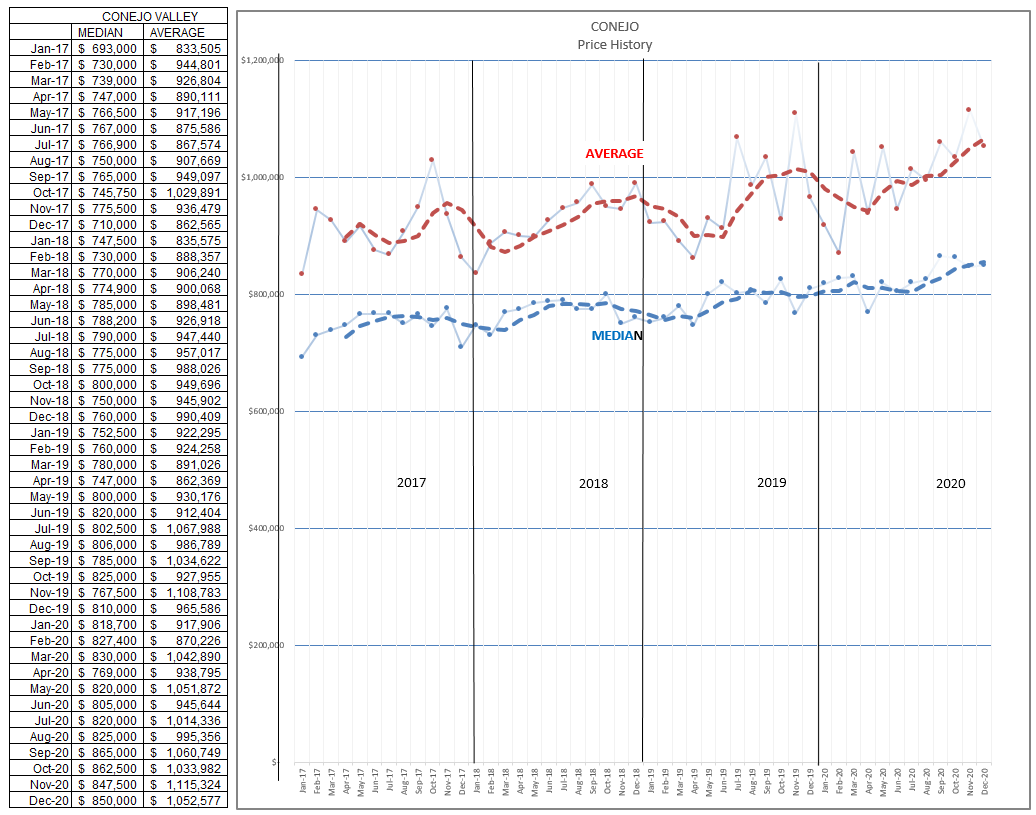
Finally, lets look at what happened with prices. For the final three months of the year, compared to 2019, prices ended up 8% higher. The median price in Conejo has moved from $800,000 to around $860,000. (the numbers below are monthly numbers, not three month figures). Due to the higher number of expensive homes sold, the Average prices increased even more, from $960,000 to $1,050,000. The Average home price in Conejo is now over $1 million.
Now to compare Conejo with Simi Valley/Moorpark. The market dipped in April and May, and then recovered consistently to close with an average number for the year.
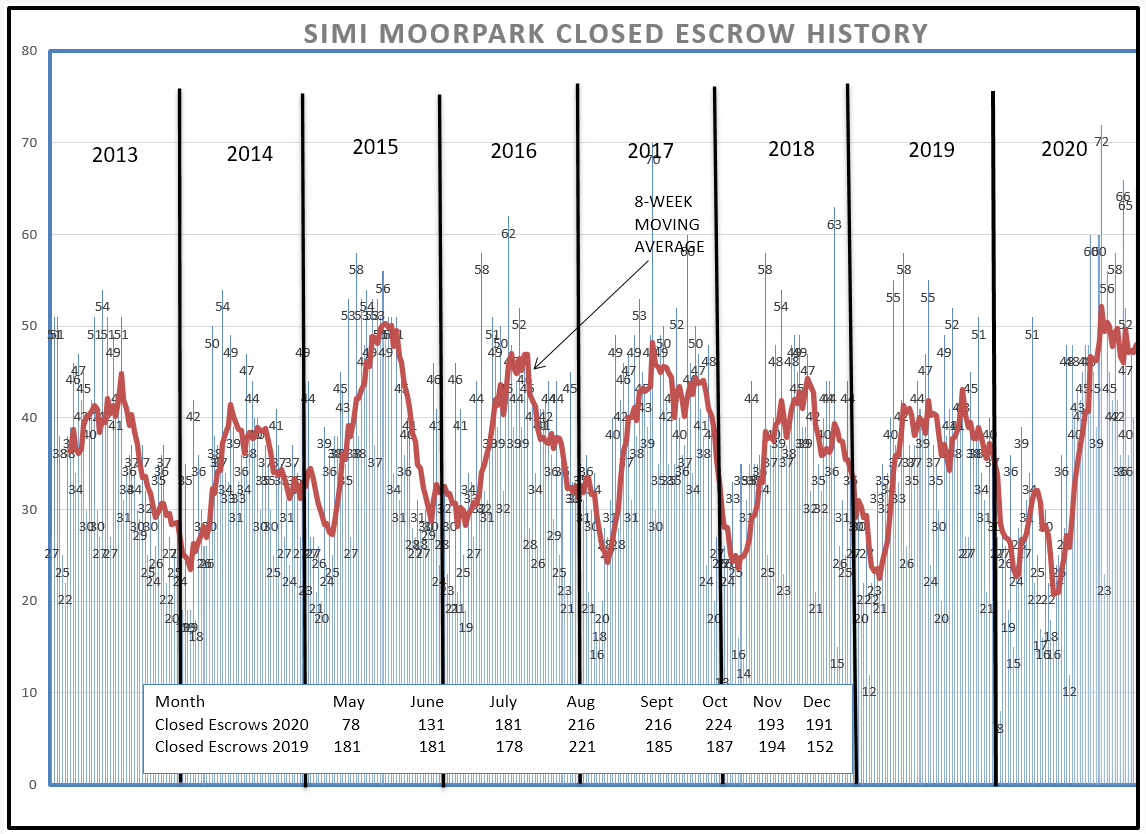
The chart below also displays closed escrows compared to previous years, but paints a little different picture. It shows a very strong end of the 2020 year, sales not falling as expected for the usual year. As if 2020 can ever be called usual. Look at the box at the bottom of the chart, which displays the monthly close of escrows. From July through December, the number has been centered around 200 per month, plus or minus 10%. Extremely, uncharacteristically strong.
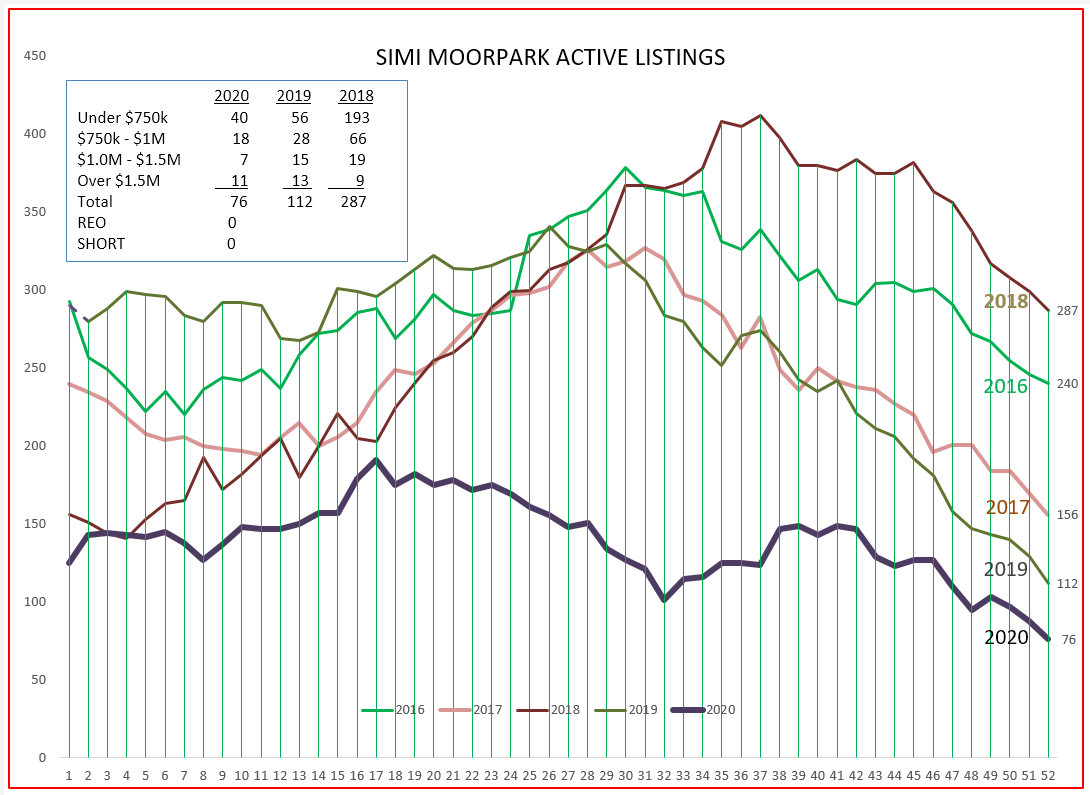
But there is much more going on to influence the market in Simi Valley/Moorpark. Inventory constraints.
Inventory has been seriously constrained throughout 2020. Inventory never reached 200 units, and ended the year at an anemic 76 units.
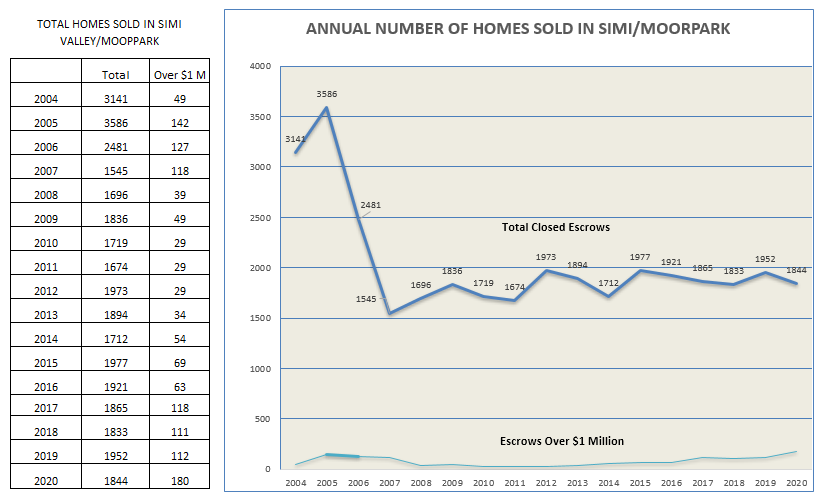
You might think that if the inventory was low, sales would also be low. The chart below compares 2020 with previous years. In spite of the pandemic, and in spite of low available inventory, closed escrows for the year finished at 1,844, about average, and with a record high number of homes sold over $1 million.
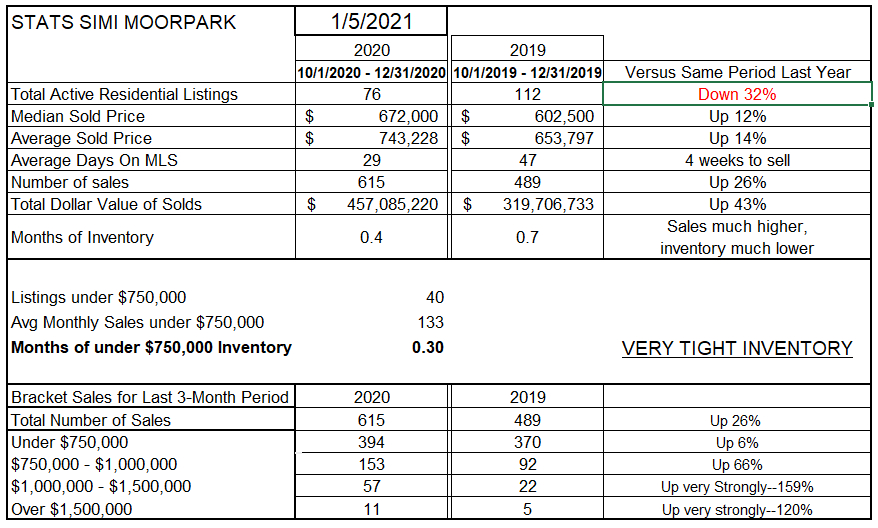
Looking at the statistical chart below, we can see amazing results for 2020, compared to the final three months of 2019. Inventory is down 32%. Prices are up 12-14%. The time to sell a home went from 7 weeks to only 4 weeks. Even though sales was constrained by inventory, units were up 26%. At current sales levels, inventory represents less than two WEEKS worth of sales, and sales of homes priced under $750,000 are taking place in a week. A combination of price increases and strong sales has seen sales of homes priced above $1 million to increase substantially.
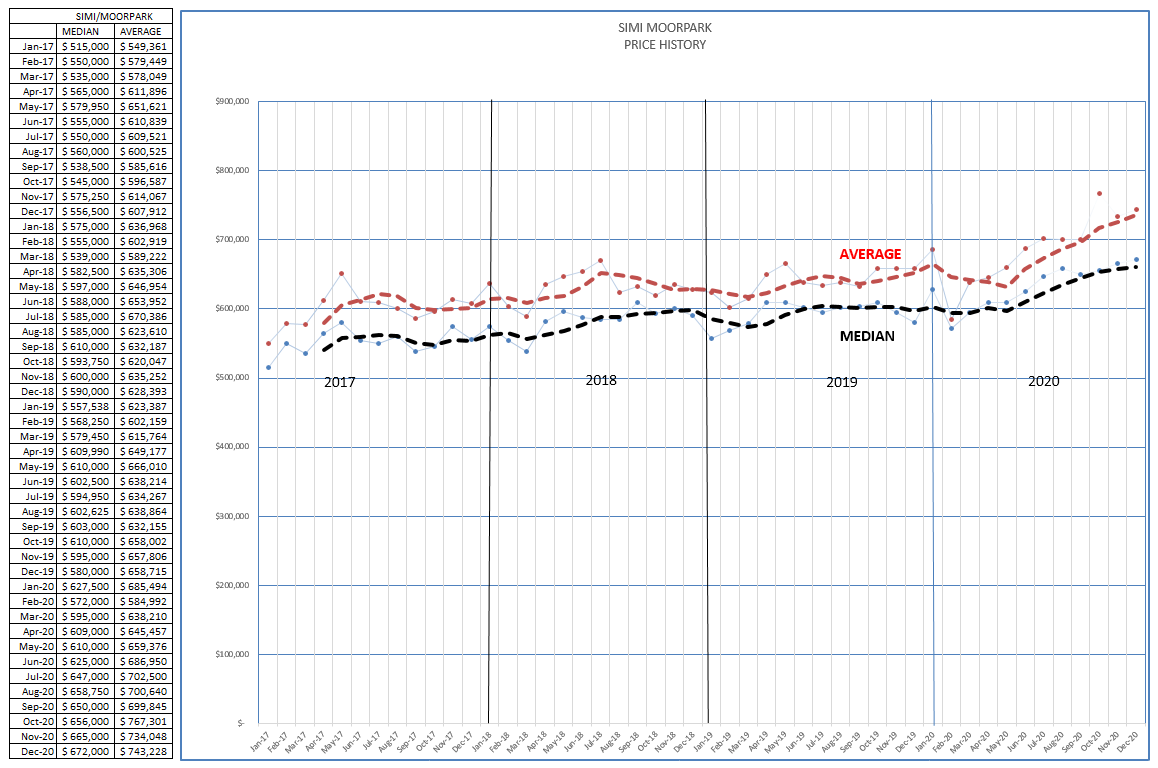
With strong sales, and limited inventory, prices were forced upwards. For the final three months of the year, compared to 2019, prices ended up 12-14% higher. The median price in Simi/Moorpark has moved from $600,000 to around $675,000. (the numbers below are monthly numbers, not three-month figures). Due to the higher number of expensive homes sold, Average prices increased even more, from $625,000 to $750,000. This is due to a combination of rising home prices and a larger percentage of above-$1 million being sold. That can be seen by the increasing distance between the red (average) and black (median) lines.
Professional economists are explaining the move to the suburbs and the increasing desirability of working from home as the reason our market is so strong. These charts show just how strong it is. Will it continue? Look for a strong beginning to 2001.
Be smart, stay safe,
Chuck