It is the same story across the country. No inventory, prices increasing.
Last March, when we began this COVID journey, everyone would have agreed that the economy, including the housing market, was heading for a terrible year. The current number of homes sold in California is usually around 400,000 units. No sense researching what the forecast was last March, it was wrong., but for all the right reasons. The bottom did not fall out of the market, quite the opposite. The current CAR market forecast for 2021 expects sales to hit 458,000 units, the highest in the past decade, with prices expected to increase another 8%, after an 11% increase in 2020. The median price in California is forecast to be $712,000 in 2021. Five years ago, 2016, the median price was $502,000. An investment in housing has increased 40%, or 8% a year on average.
How do those figures compare to our little corner of the world?
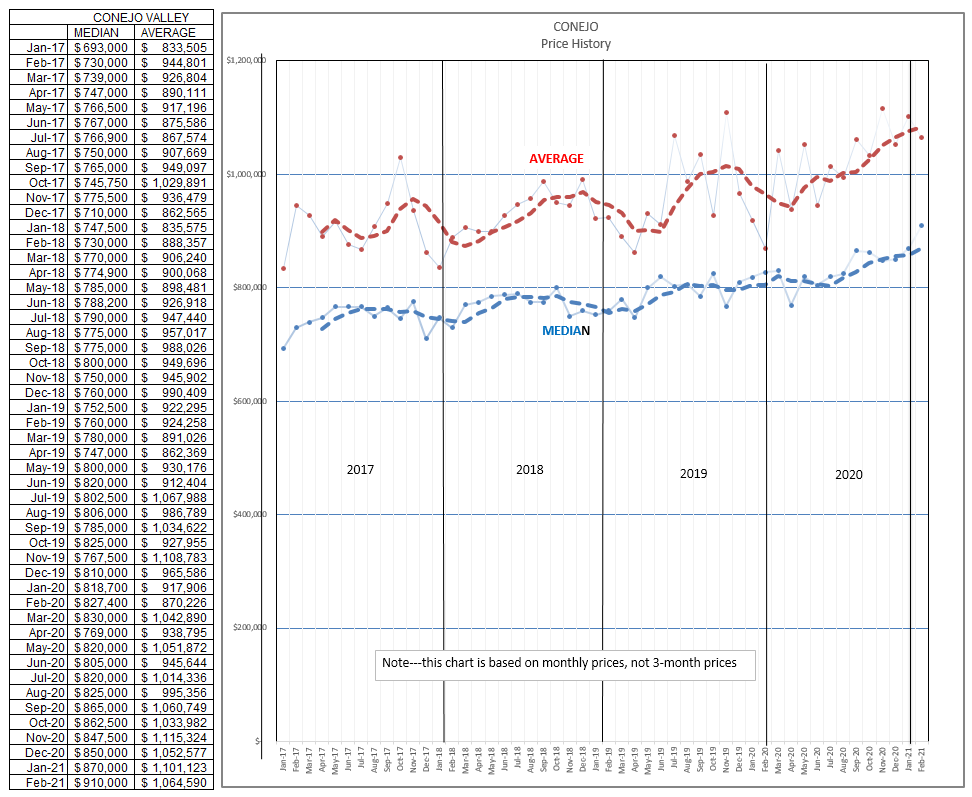
CONEJO VALLEY
Last year (2020) saw the lowest inventory in the past five years, and now we are at only about half (53%) of that inventory. Even though we have very limited inventory, the number of sales were up 46% over this period. Sales increases were up over all price ranges, but were particularly prevalent in the upper price ranges.
Both the Median and Average sold prices are up 9% year over year. These numbers represent not one month, but three months. I choose three months to smooth out the influence that one month can provide, either up or down.
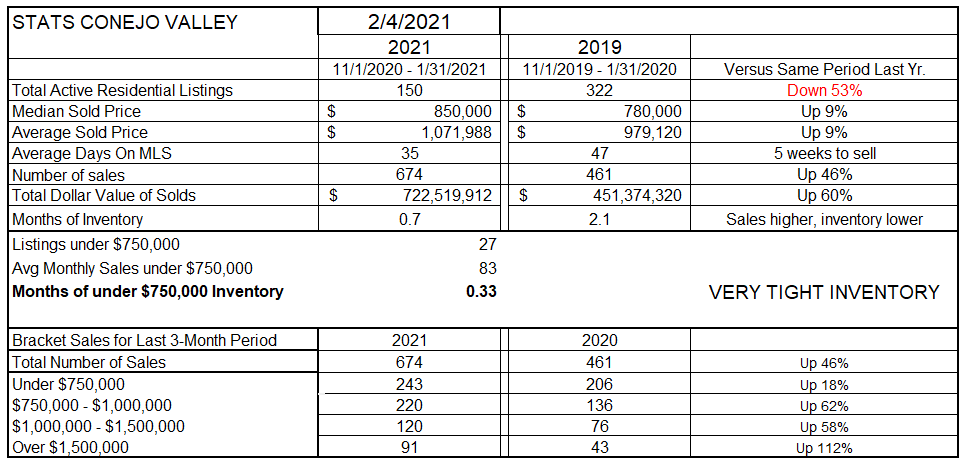
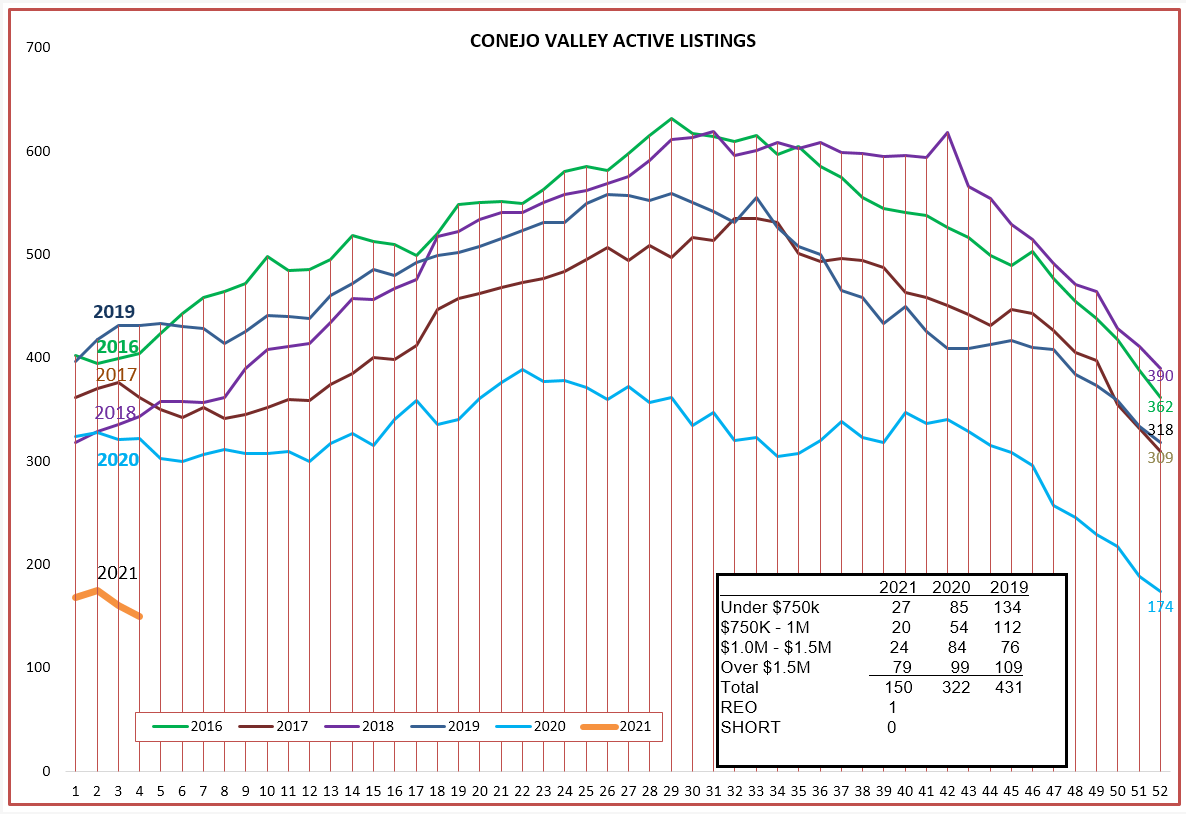
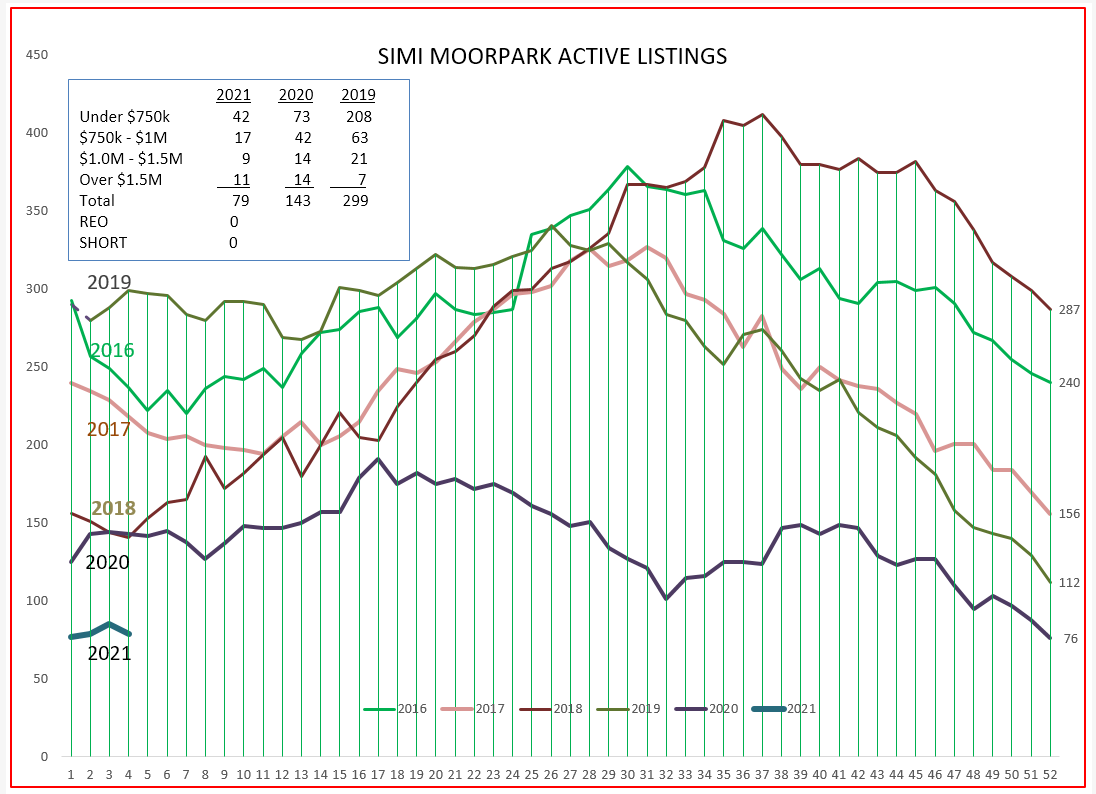
The real impact of an inventory 53% lower than the previous years can best be seen in the chart below. As they might have said on Star Trek, we are now in uncharted territory. How many homes are currently listed under $750,000? Only 27. Wow. And the other ranges not much better.
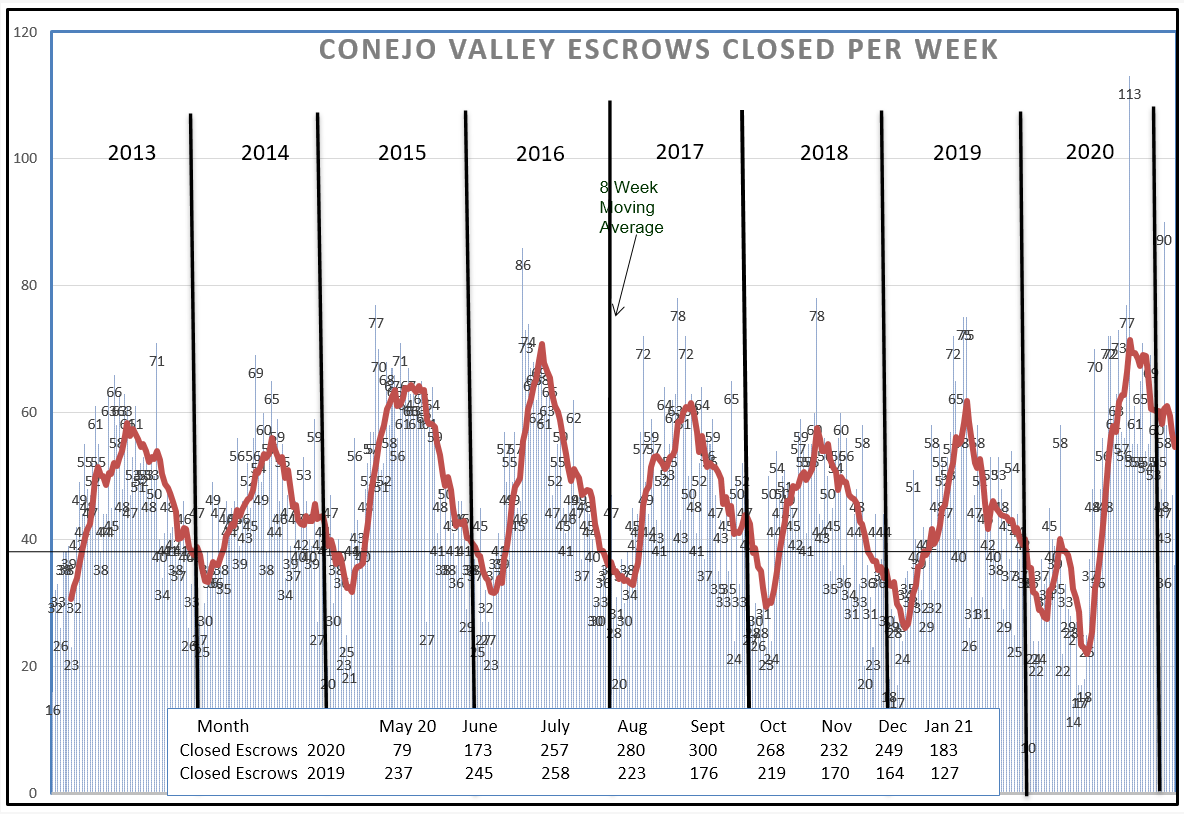
This drastic shortage of inventory would logically lead to a decline in the number of units sold. Not so, not by a long shot. Sales are up 46% compared to last year. This chart goes back to 2013, and never have we seen such a strong beginning to a year. Our current level of sales at the beginning of this year actually matches the summer high for most years. The box within the chart below displays the number of units sold each month compared to the previous year. Starting in August, we have surpassed the previous year’s unit sales by a significant amount every month.
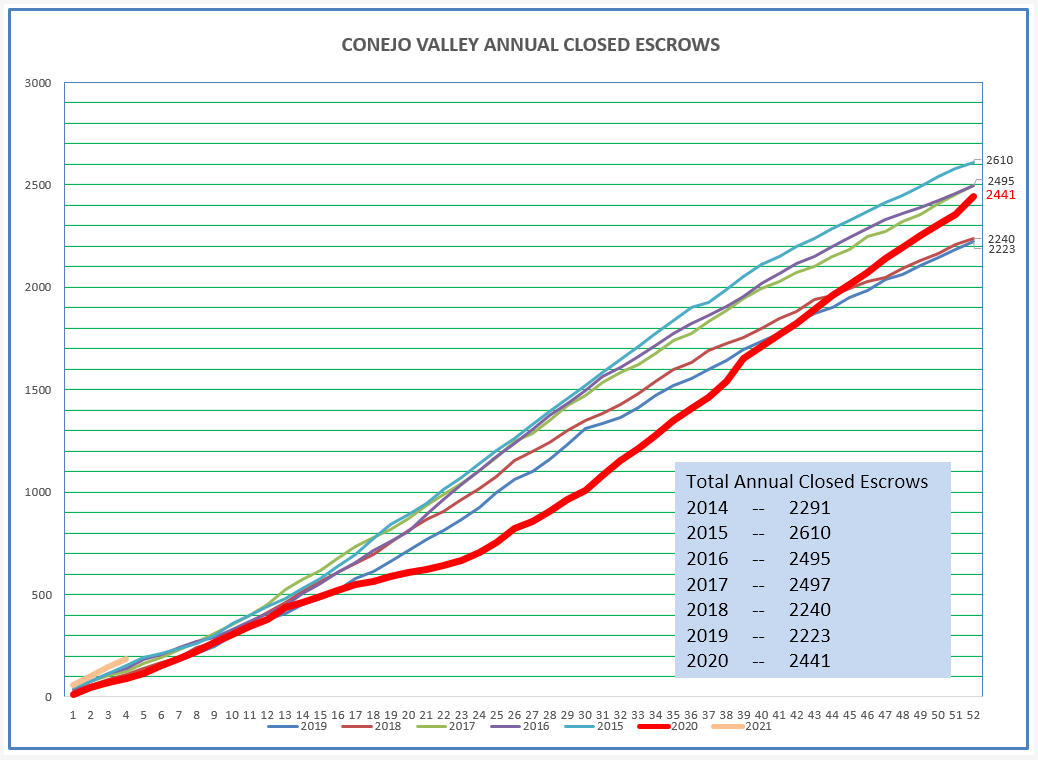
Looking at sales a different way, this chart indicates how many homes have been sold in total as the year progressed. Represented by the gold line below, 2021 started out much stronger than any of the prior six years.
Finally, prices. Prices can vary greatly by what I used to call “product mix”. If you sell more high-priced units than you usually do, your average price increases much more than your median price (half the units selling for over that price, half lower). This is expressed by the distance between the red and blue lines. Conejo has some very high-priced areas, and sales in these areas have been very strong. On a one-month basis, the median price in the Conejo actually hit $910,000 in February, a tremendous increase considering it was only $806,000 in August. Appraisers are having a difficult time keeping up with the markert, a problem last seen in 2006. Why point that out? Because housing competes with everything else that money can buy. Large swings in prices are usually tempered by price adjustments in the future. That’s why I prefer to report pricing over a range of months. Can this kind of price appreciation continue? Is this a bubble? No, but I am starting to have concerns. As long as demand remains high and mortgage money remains low, look for prices to continue to be strong.
SIMI VALLEY & MOORPARK
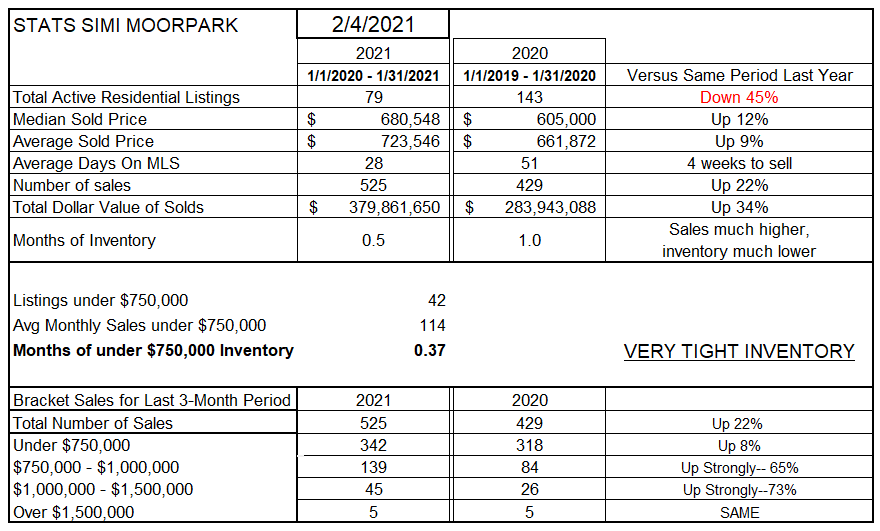
If you really want to look at low inventory, travel no further than Simi Valley/Moorpark. Inventory is down 45%, about the same percentage as Conejo, but inventory is currently 79 units. Total. And about half of those units (42) are in the predominant sales segment, the under-$750,000 segment.
The under-750,000 price segment is approaching a changing metric. Most of the homes sold in Simi/Moorpark are in this price range. However, prices have increased so strongly that the median price has increased to $680,000, up 12% from last year. Sales are beginning to move into the next price segment, $750,000 – $1 million. The number of units sold in this segment increase 65% versus the prior year, even though the limited inventory has caused sales in the under-$750,000 category to only increase 8%. For all price ranges, sales were up 22% over last year. WIth the current inventory compared to the current rate of sales, Simi/Moorpark has only two weeks worth of sales inventory. Inventory is providing a governor on sales volume, limiting sales.
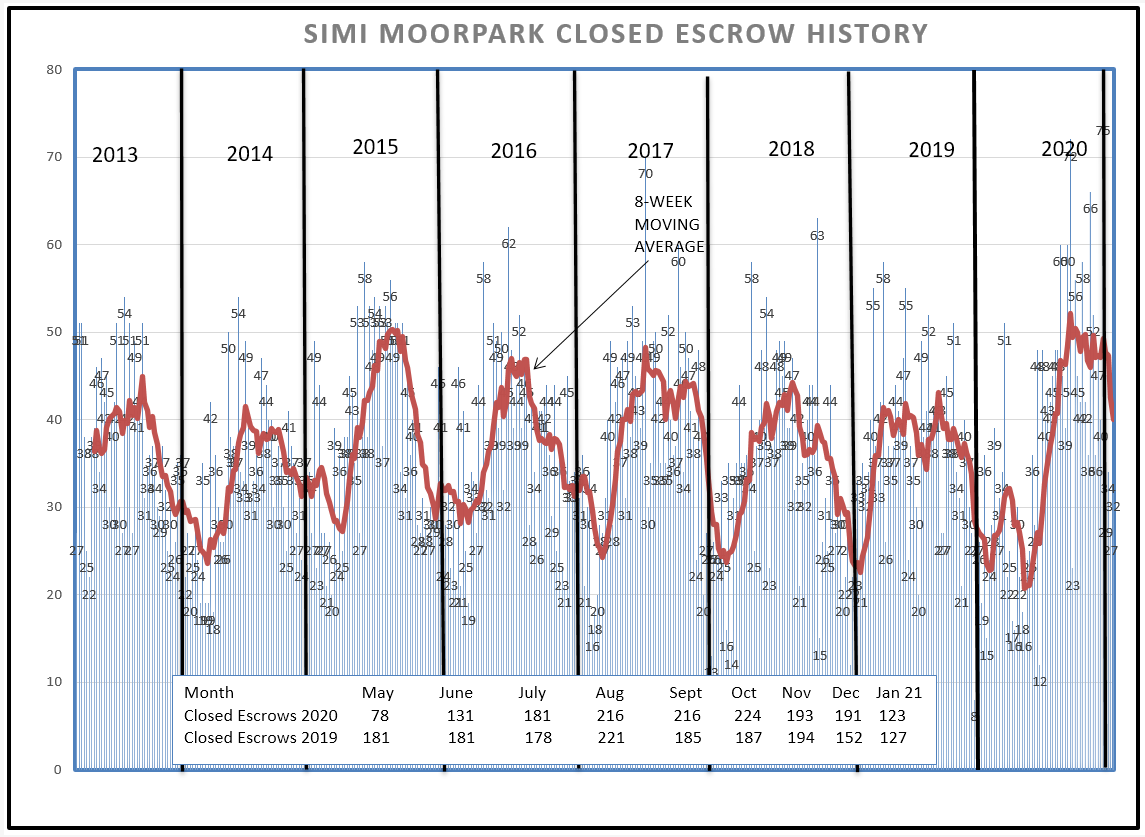
The closed inventory charts show the story a different way. Instead of the usual dip at the beginning of the year, sales levels are now equivalent to the highest rates achieved during the summers of the past eight years. The dearth of inventory has definitely restricted sales, as you can see in the box within the chart below. Since July, although sales have been very strong (up 22% year over year) the number of sales per month is reasonably consistent with the monthly sales in the previous year. I think everyone agrees that if we had more inventory, we would sell more homes.
The lack of inventory, coupled with continuing strong demand, has pushed prices higher and higher. The chart below represents monthly prices (not 3-month prices) for the past five years. From this chart, it seems that prices are beginning to plateau. But the plateau is is at a very high altitude. 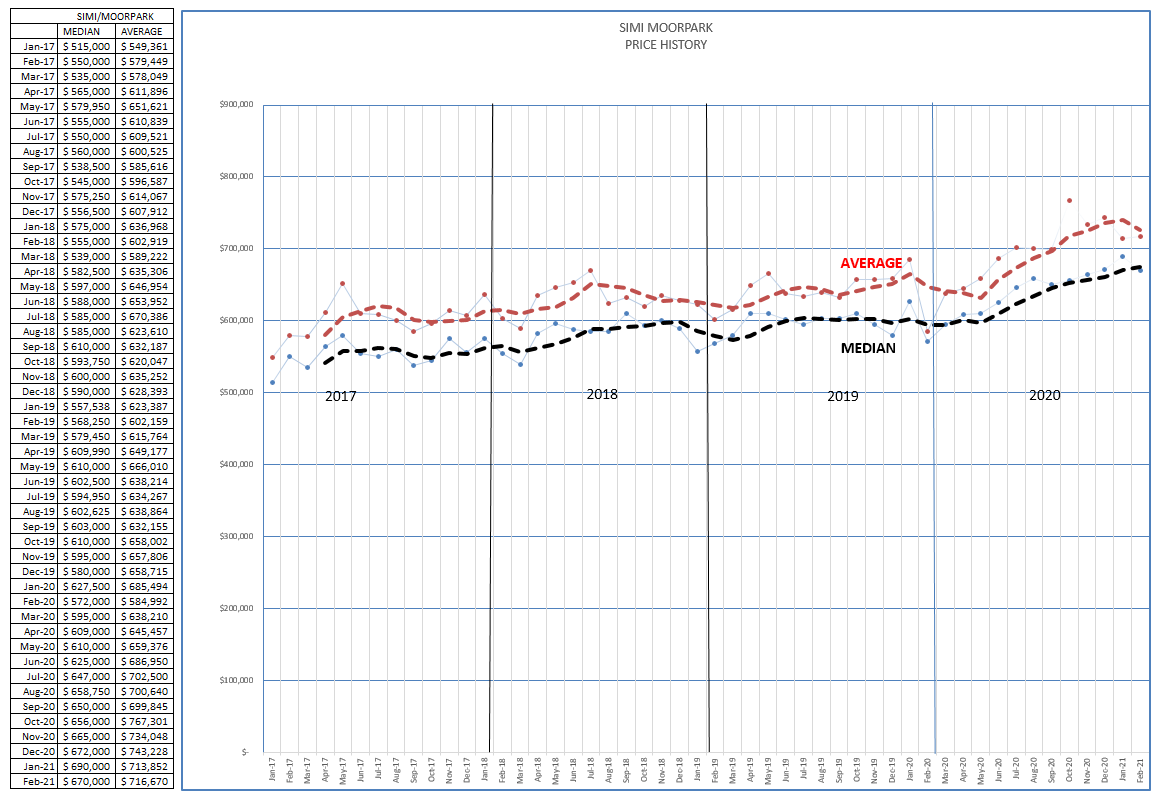
Overall, the good news. I have gotten both my shots. More and more of you are joining that group. Teachers are getting shots, schools are opening, businesses are beginning to look toward opening. It is possible that most of us will be able to obtain vaccinations by the end of spring. Unemployment remains high, but has not affected the demand for homes. Changes are slowly coming about. The government continues to provide support for the large quantity of restaurant, travel, and housekeeping workers that have lost their jobs. Soon we will see people signing up for cruises, taking vacation trips, and enjoying eating out in restaurants with friends. Unemployment will drop. Some of us may even return to the gym. The end is in sight. And the end will bring changes, changes that we have to be attentive to. The only constant is change.
Those are my thoughts, and my statistics. Continue to stay safe, keep that mask handy, get that shot, and look forward to things getting back to normal, whatever that normal may be.
Chuck