Are we dealing with an anomaly, or are we dealing with the new normal in the Housing Market?
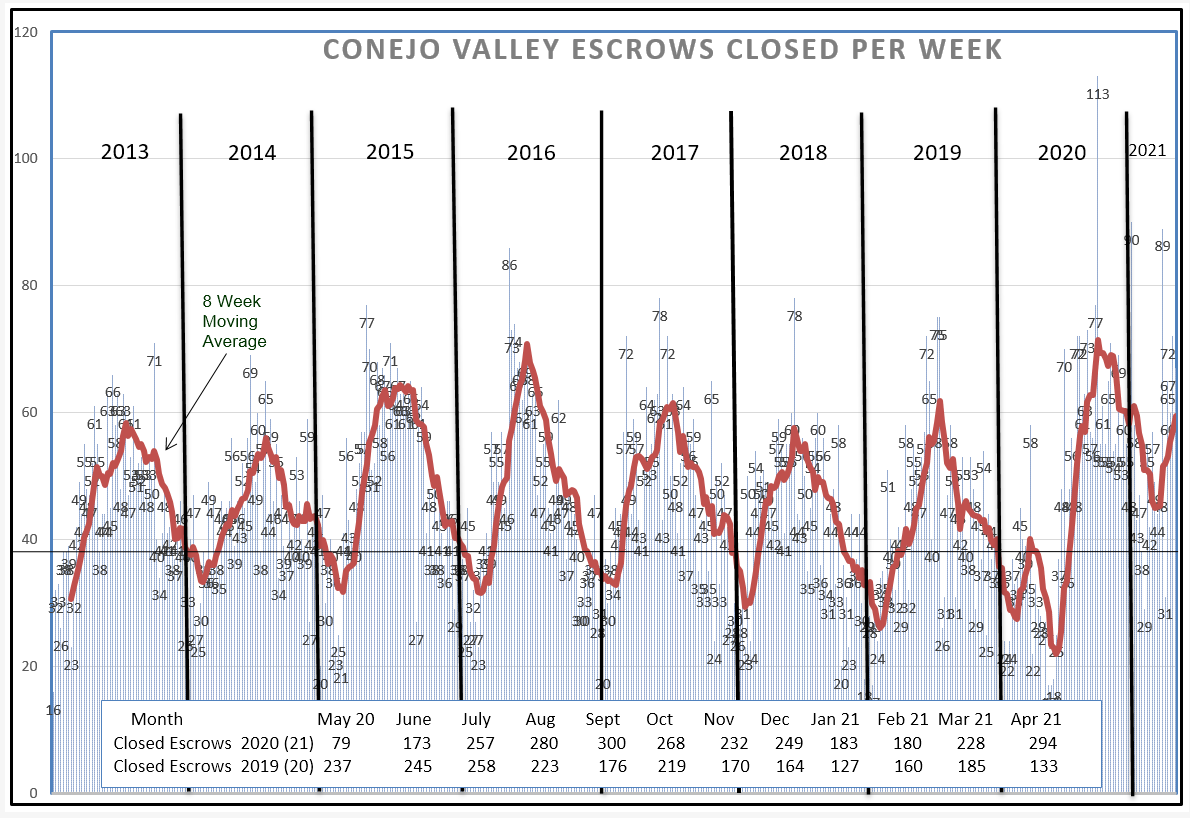
To begin, I am going to change the way we view the chart of closed escrows. Below is what I have been using to view sales activity in our market.
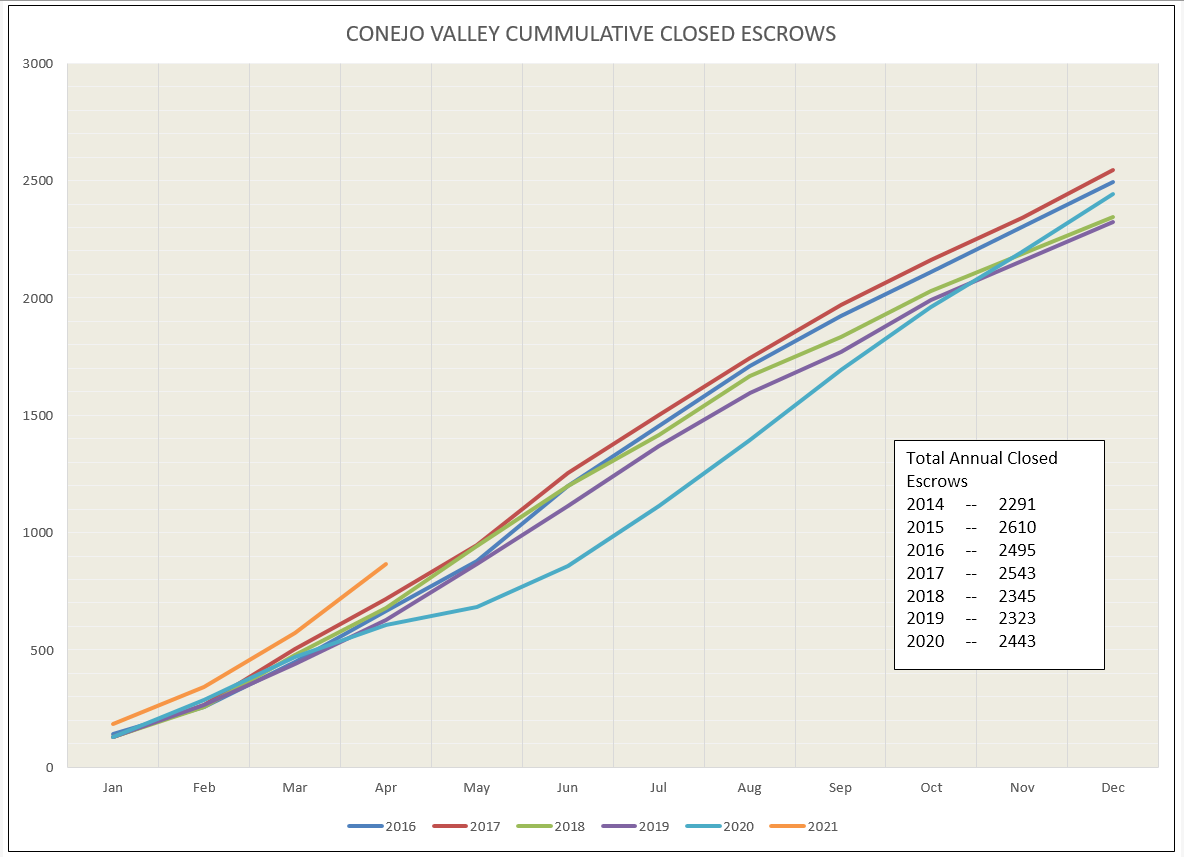
You can see that sales activity drops at the beginning of the year and peaks in the summer. 2020 had a double dip due to COVID. Then the level of activity peaked to the highest level since 2016. In 2021, the drop happened, but at a very high level, then headed up as we approach the summer months.
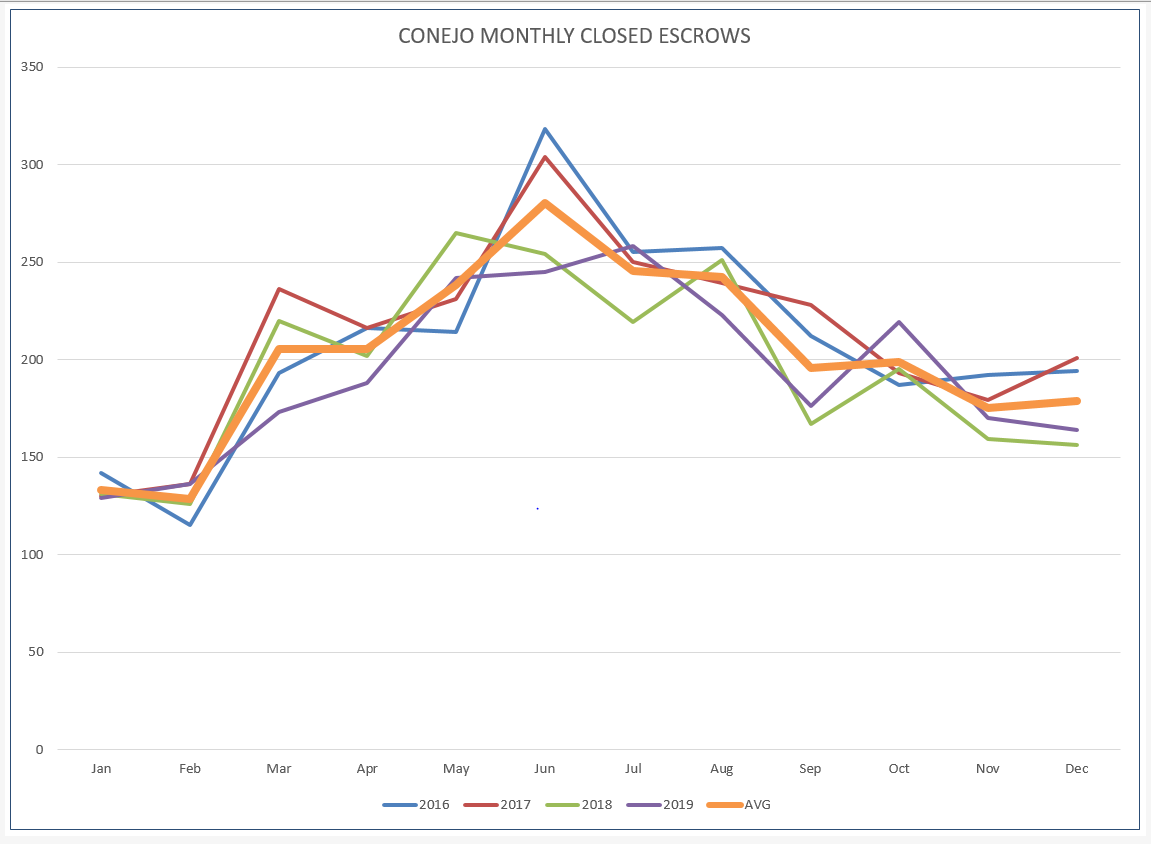
Let’s look at those graph lines in a different fashion, superimposed one upon another in the same way I have been following the available inventory of homes sold. In addition, the orange heavy line represents the average of the readings from 2016 – 2019.
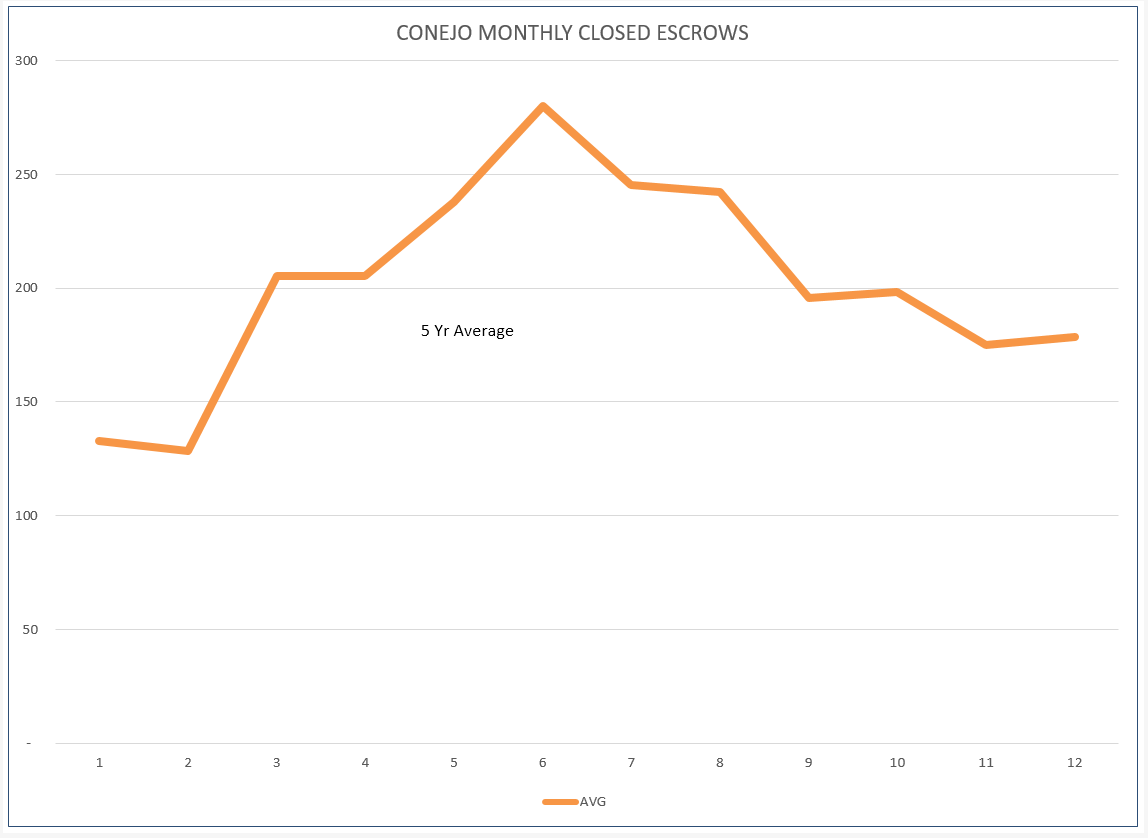
Now let’s look only at the average line graph. Any year we view against this average line will be a little more clear, less lines to confuse us. This is how escrows proceed in an average year.
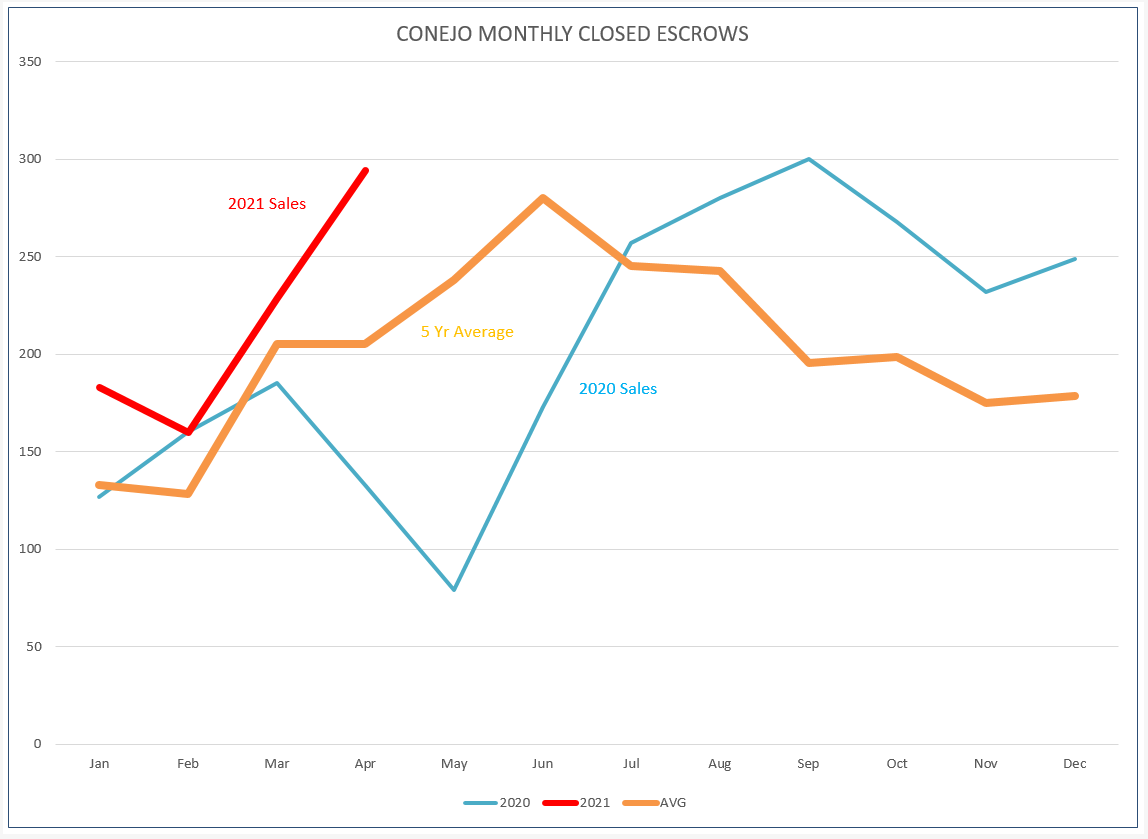
Now let’s look at 2020 and see how it compared with the usual, average line that we would expect in a normal year. We can see how 2020 varied, first with a massive drop in March and April due to Covid, then the recovery that by mid-year turned into a very strong market.
Next, let’s put the chart for escrows closed this 2021 year. As everyone can attest, the market is unbelievably strong. This red line shows how strong the market is compared to the 5-year average that we would normally expect the line to follow.
Now that we have changed the view of this graph to mirror the way we keep the information on available listings, let’s put that graph up. The lines for 2016-2019 are very similar, and very similar to the closed escrow 5-year average line above. As inventory increased as we approached the summer months, sales increased along the same pattern. More homes were listed to allow more sales to take place.
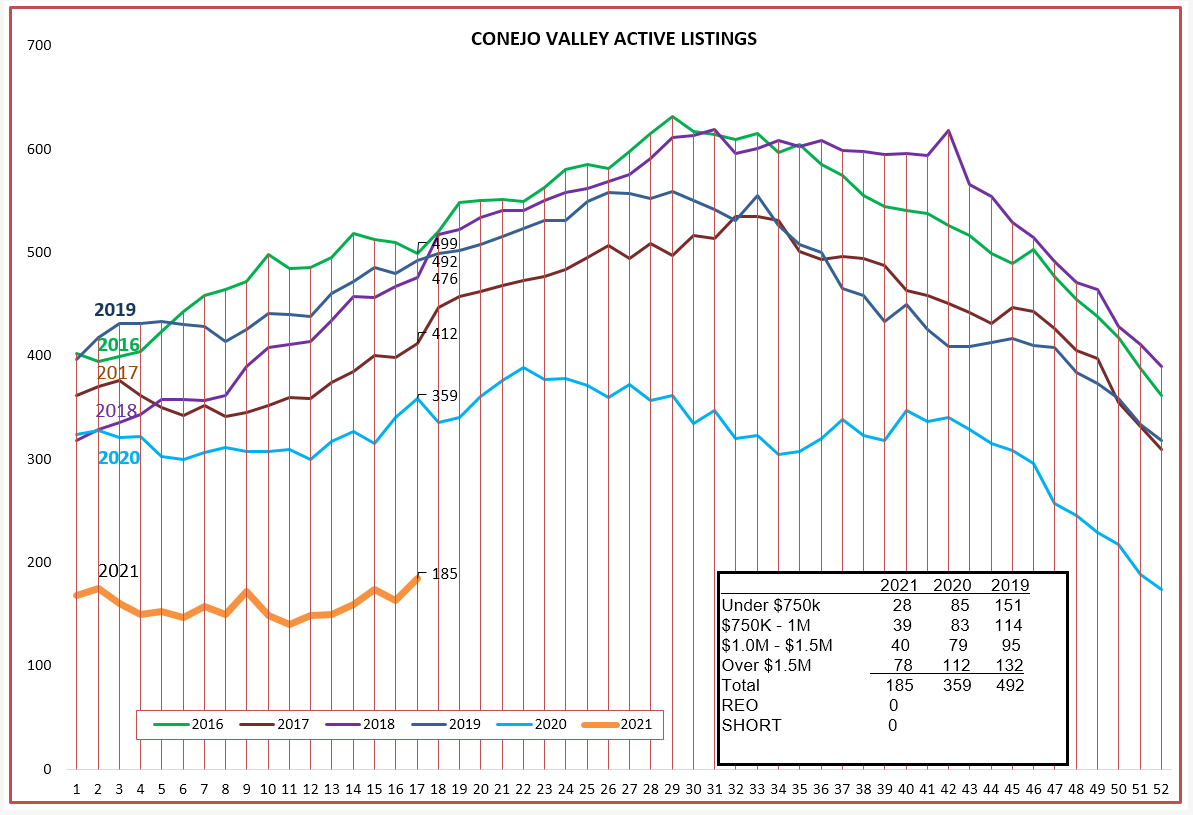
But look what happened in 2020. The available inventory took a deep dive. During the latter half of 2020, sales were abnormally high whereas inventory was abnormally low.
Now compare the sales graph for 2021, with the red line taking off strongly, while at the same time the available listing inventory has flat-lined, currently about the same number of listings that we began the year with. The inventory figure above shows the SUPPLY, while the red line in the closed escrow chart shows the DEMAND. When they move in concert, the market is in balance. When supply and demand are out of balance, PRICES go up significantly.
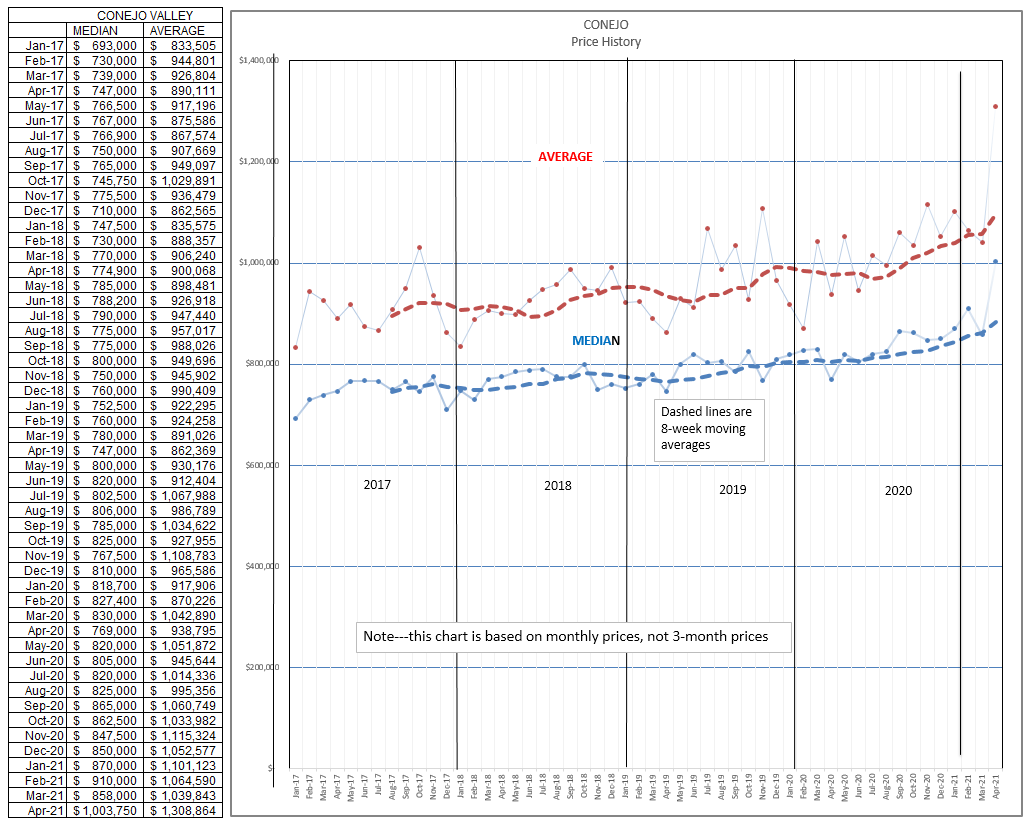
The chart below displays strong price increases occurring mid-year 2020 and continuing to strongly increase as the year progresses. The Median and Average prices in this chart are for a particular month, not a 3-year average. In April, Conejo prices reached a level never before seen. The Median price in April was $1,003,750, while the average price hit $1,308,864. There were numerous sales at the high end of the price range, with more than 10 homes sold in excess of $5 million, and one for $12 million. The top end of the market is very strong.
One final closed escrow chart, showing how the total closed escrows change as the year progresses. Yes, 2021 is a very strong year.
Finally, let’s look at the chart most have used when explaining the market. The prices quoted in this chart are for a 3-month period, unlike the chart above, therefore the median and average prices do not match. Compared to the same 3-month period last year, inventory is down 48%. Median prices are up 18% and Average prices are up 13%. How fast do houses go into escrow? In no more than 3 weeks. Even though inventory is 48% lower, sales are 49% higher.
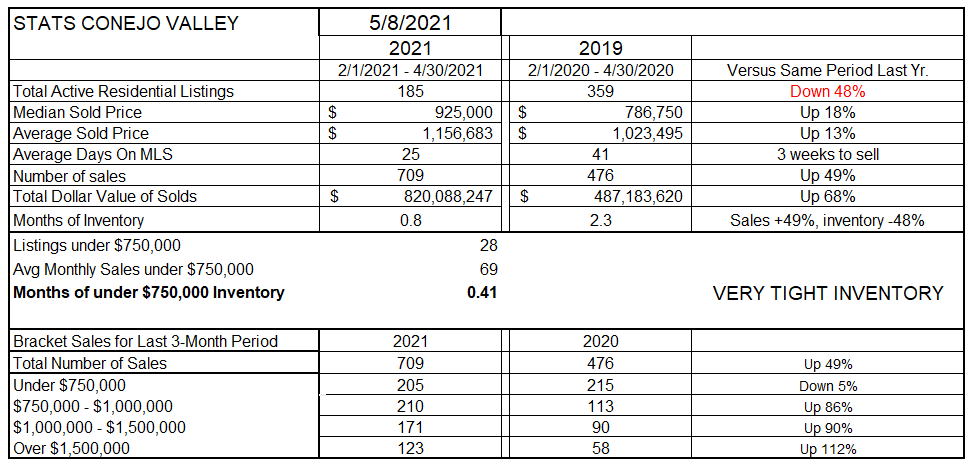
Looking at the bottom of this table, note that while all sales are up 49% compared to the same three months in 2020, sales of homes below $750,000 are down 5%. Thanks to the hefty price increases, Conejo has very few homes listed below $750,000. From the box in the inventory chart above, there were only 28 homes available for sale in this price range. However, look at the remainder of the price categories, up 86%, up 90%, and up 112%.
Let’s next look at Simi/Moorpark, where the inventory of homes priced below $750,000 have always been the majority of inventory and sales.
First, as we did above, let’s look at the closed escrow chart we have been using.
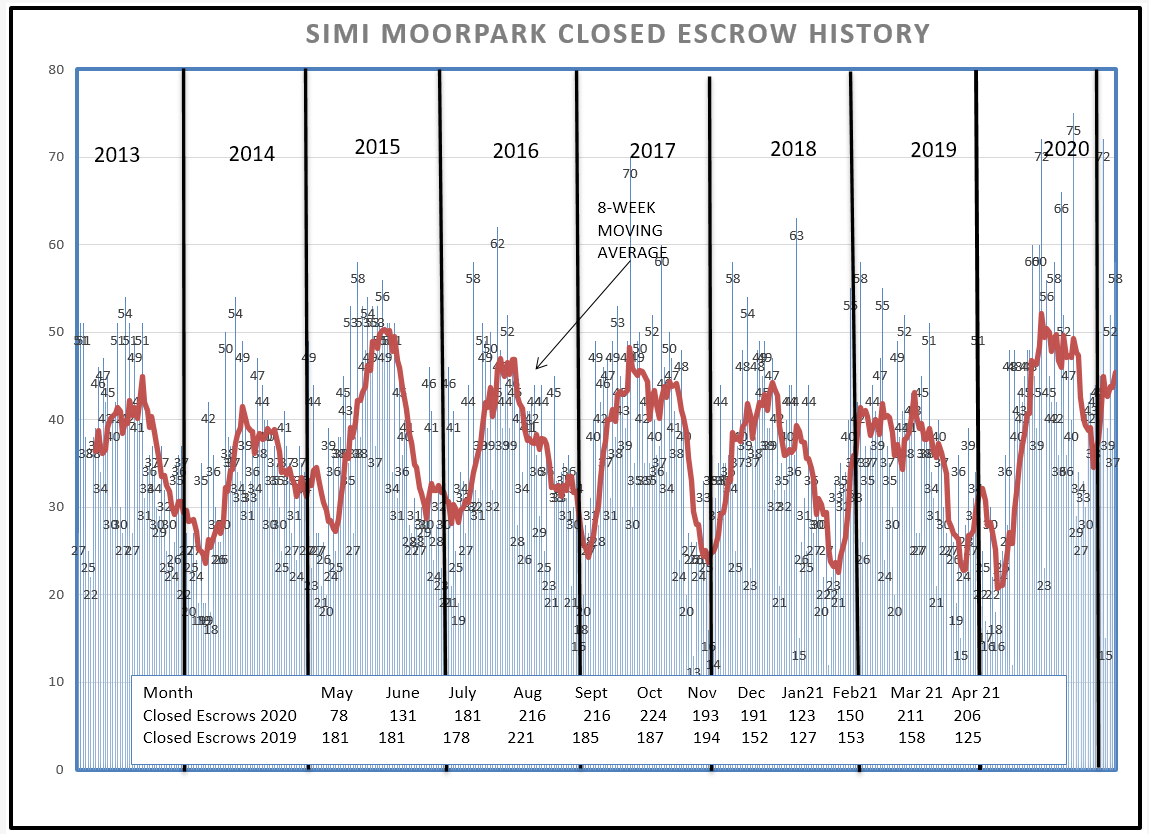
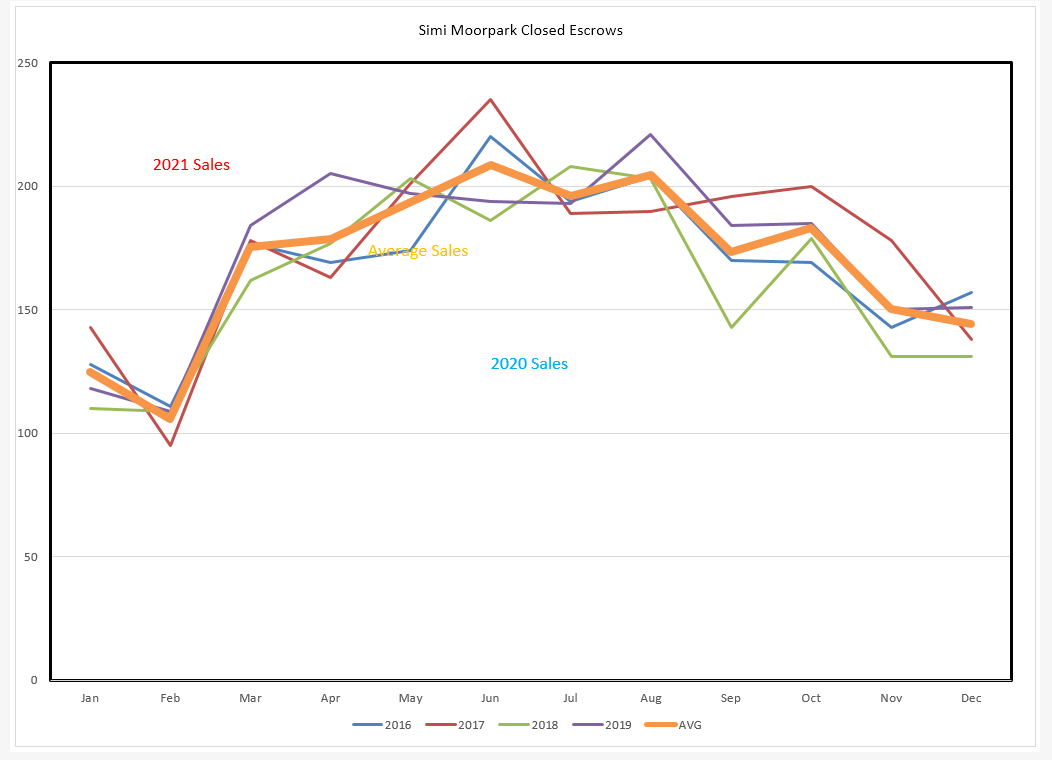
Notice how strong sales have been since July last year. Now let’s rearrange the timeline and superimpose one year over another, with the gold line as the 5-year average.
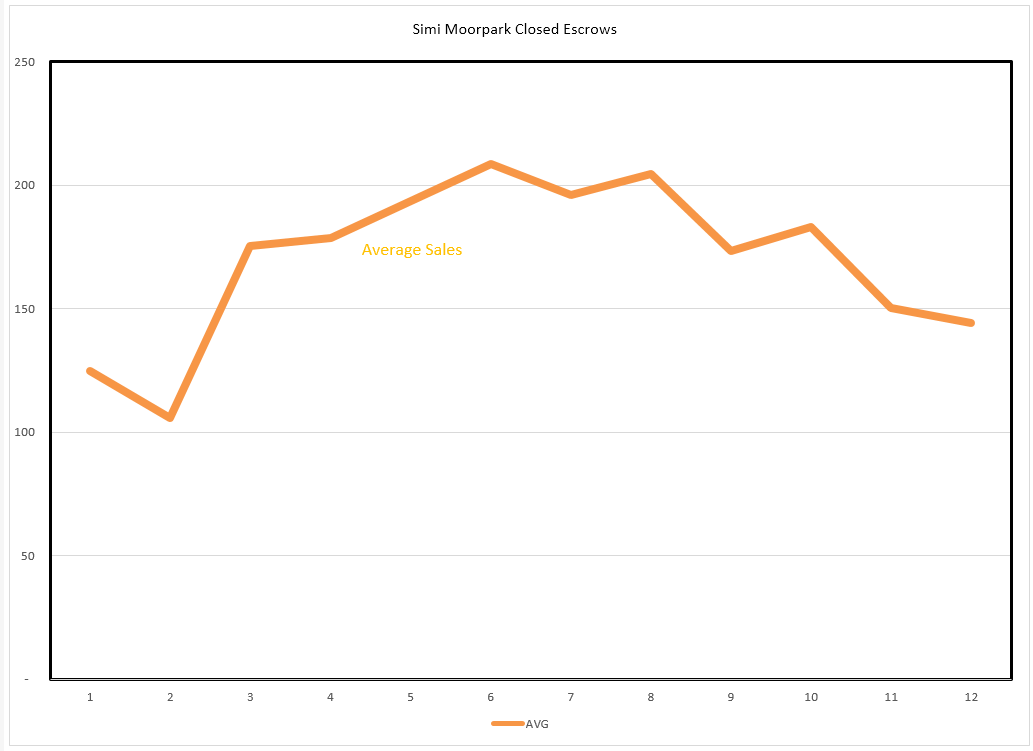
Now let’s remove everything but the average line.
Now lets add in 2020 and 2021 Closed Sales Compared to the average, we are definitely exploring new territory.
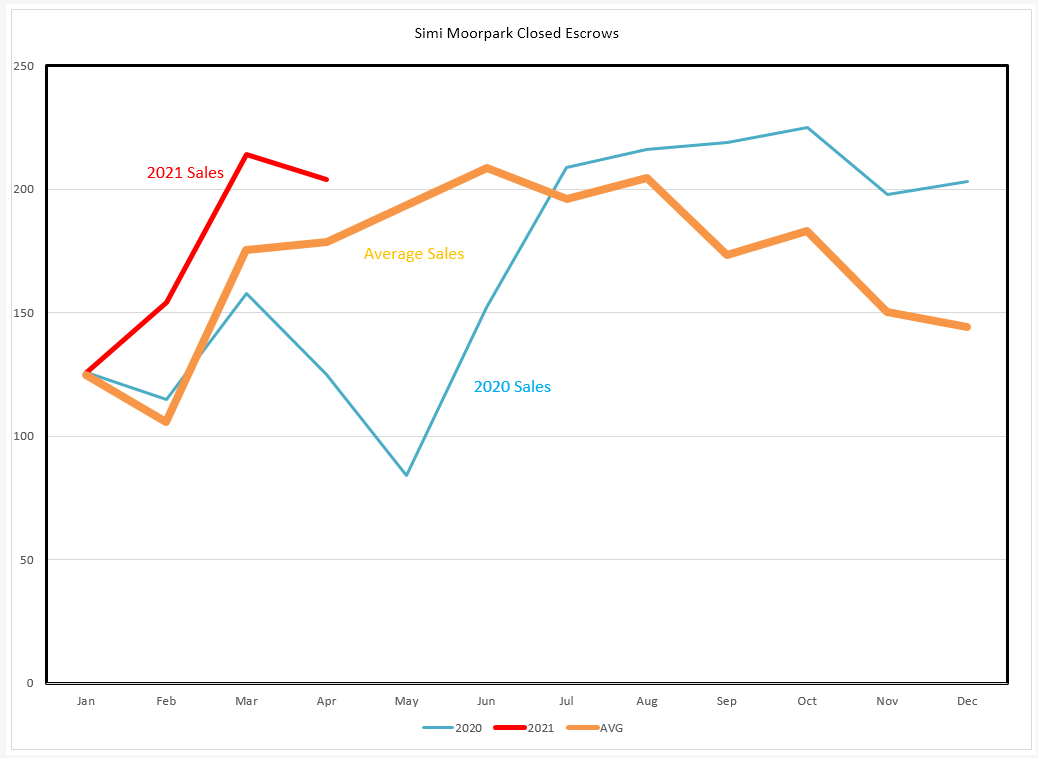
The one concern on this chart is the reversal of 2021. At this time, I believe that is mainly due to a lack of inventory. Less than 100 homes, stable since the beginning of the year.
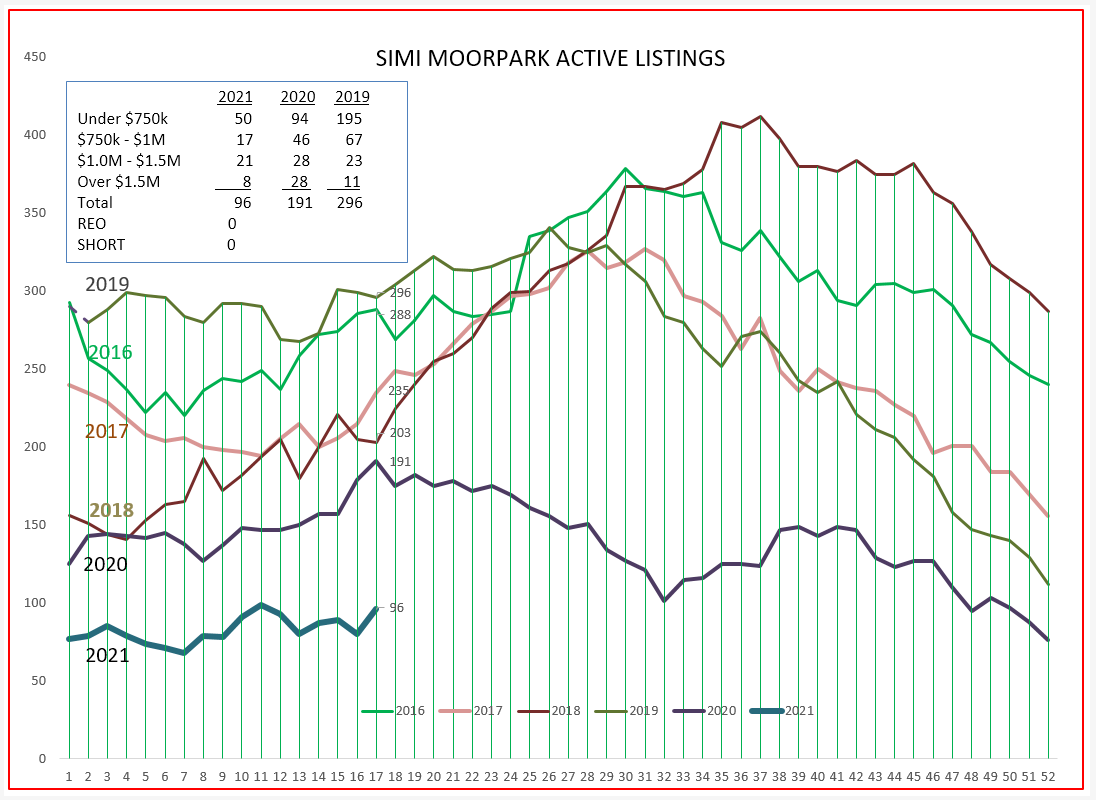
Now compare the sales graph for 2021, with the red line in the closed sales chart taking off strongly, while at the same time the available listing inventory has flat-lined, currently about the same number of listings that we began the year with. The inventory figure shows the SUPPLY, while the red line shows the DEMAND. When supply and demand are out of balance, PRICES go up significantly.
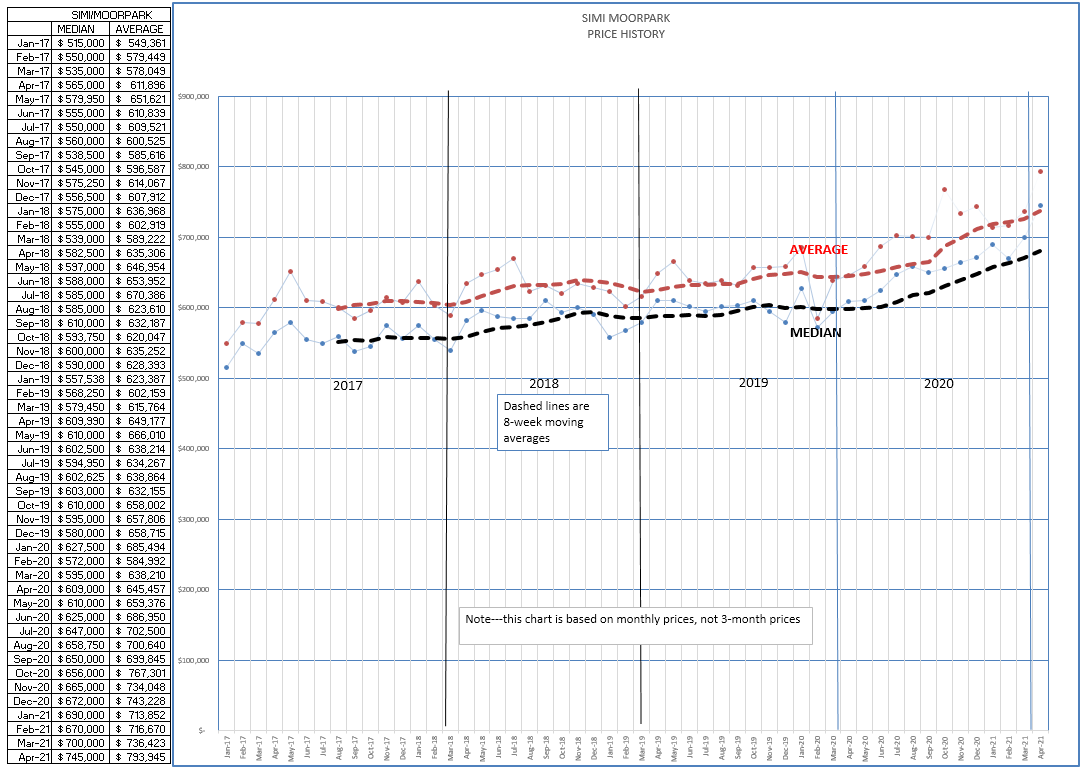
Simi/Moorpark begin 2020 with Median prices around $600,000, and currently those prices were $745,000 last month. And aas that median price approaches the range I originally chose in 2004, the figures start to slide from one range to another.
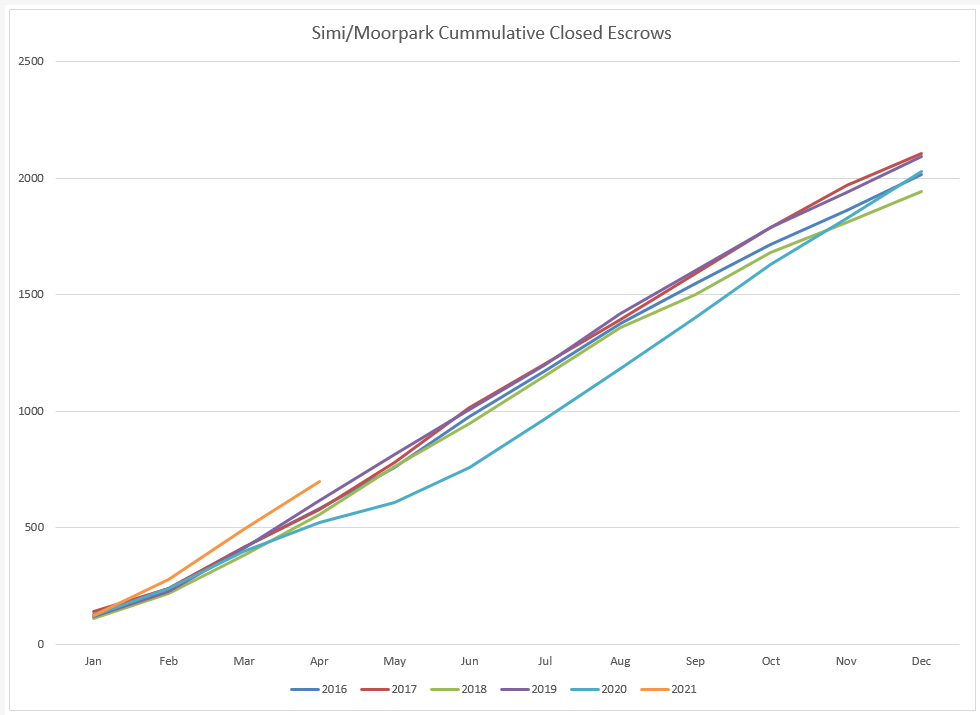
Our final chart displays how the total number of closed escrows rises as the year progresses.
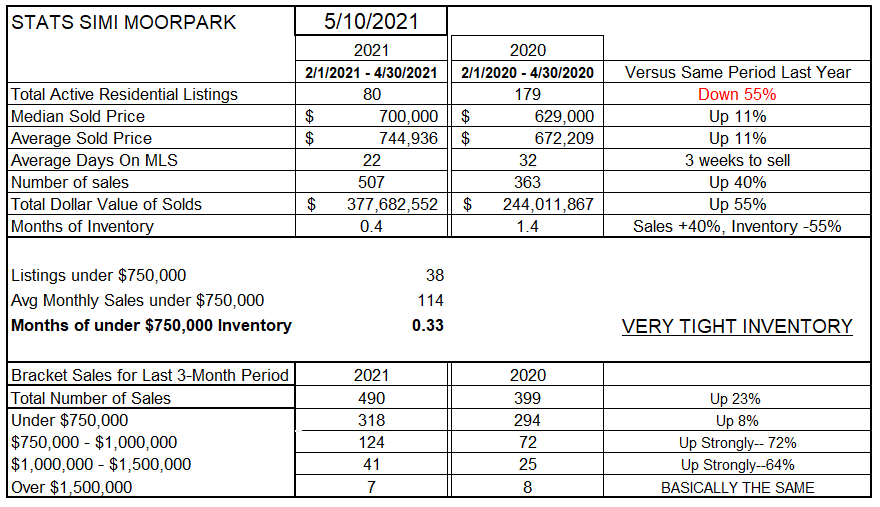
Finally, the table for Simi/Moorpark. Inventory below 100 units, down 55% from last year. Median and Average prices up 11%. Only 3 weeks to sell. The number of sales 40% higher than last year, and would most assuredly be higher if there were more houses to sell.
Can this enormous price appreciation last?
No. There is an end to this exuberance.
Not a reversal, as we saw in 2008, but a leveling off. But it certainly will make building new housing much more attractive.
Now if the contractors can only get lumber.
This is what I think.
What do you think?
I would appreciate you letting me know.
Chuck