My standard posts have been to give you some background information, then to give you the statistics, then to tell you what I think, and then to ask what you think.
Let’s shake that up a little. Let me give you some information, and then you think about what is going to happen.
Then I will end with the statistics.
WHAT DO YOU THINK?
******************************
First—Interest Rates.
They are changing. The FED has only had one increase, 1/4 point, on March 17, 2022. However, they are planning on SIX MORE INCREASES THIS YEAR! And the FED is planning two half-point interest rate increases, in May and June.
Last year, 30-year mortgage rates hovered around 3%. Today they are approaching 5%. That is a lot bigger increase than the 1/4 point announced by the FED.
The Fed rate is not the best indicator of mortgage rates. Rather, the 10-year treasury is the standard, plus about 2%. Today that treasury is at 2.79%, adding 2% gives us a mortgage rate of 4.79%. Yes, approaching 5%.
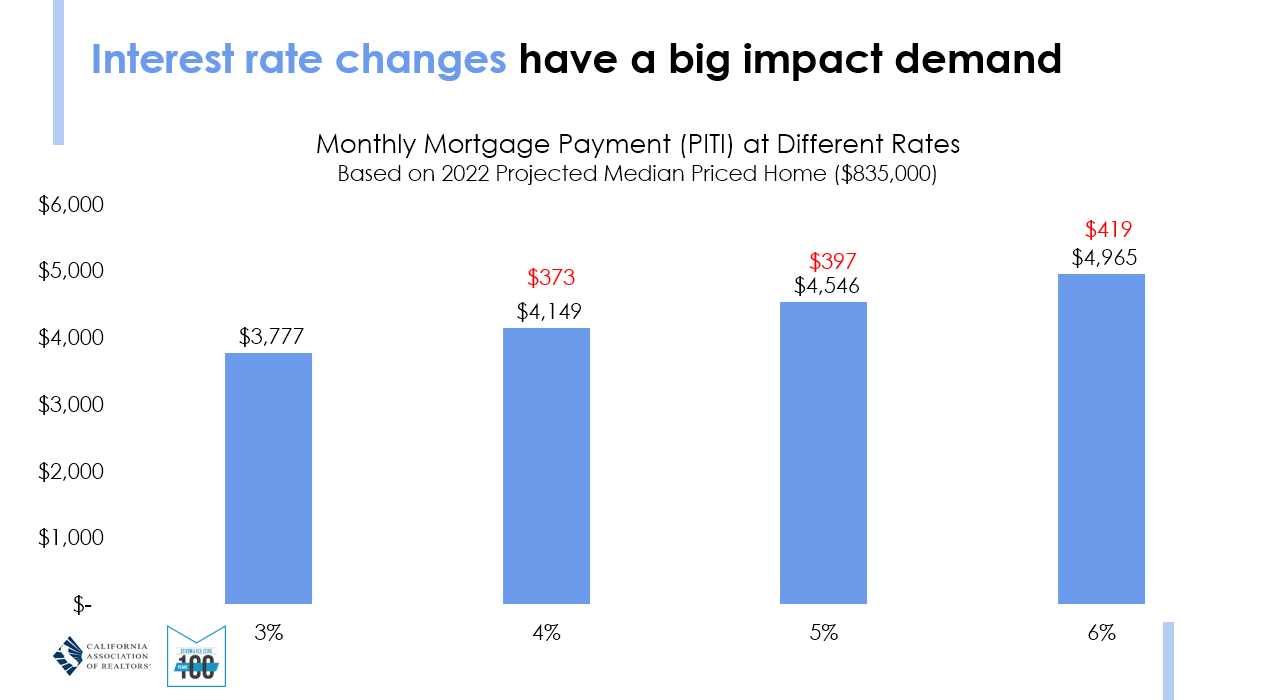
The following chart is from CAR, explaining the effect of interest increases on payments . These numbers are for a home priced at $835,000, the current median price in California. The mortgage payment (PITI) at 3% is $3,777. The rate at 4% increases the payment by $373 to $4,140. The rate at 5% jumps the payment by $769 in total (from 3%) to $4,546. Same house, same price, different mortgage.
How will this affect the housing market?
WHAT DO YOU THINK?
******************************
The FED has been purchasing Mortgage Backed Securities (MBS) to support homebuying. Recently, the FED has tapered off purchases. During COVID the Fed purchased almost $700 Billion worth of MBS. They now hold over $2 trillion of MBS, or almost 30% of the outstanding balance. Today the Federal Reserve is set to announce the final purchase of outstanding mortgage-backed securities, putting an end to the largest quantitative-easing program in U.S. history. It has moved from purchasing these securities to tapering off purchases to stopping purchases. The next step is to sell off some of their MBS inventory. How will that affect mortgage rates?
WHAT DO YOU THINK?
******************************
Next, think about the rise in home prices. Over a two-year period, prices have increased by a total of 30%. There are lots of reasons. One was a shortage of homes. Another was covid, and working from home. (COVID is not gone, but basically under control, at least for hospitalizations and deaths). Offices are reopening. Masks are coming off. Therapeutics are available to treat covid, in addition to vaccines. Stores and restaurants are reopening. People are traveling again. Airlines and hotels have raised prices, and are booked solid. The only logical place to spend money for almost two years was a home, because we were trapped inside our homes. Now we are returning to normal lives, and all these other interests are competing for the dollars we earn. Will housing prices continue to increase?
WHAT DO YOU THINK?
******************************
Since 2010, about 7.5 million people moved out of California to other states, while only 5.8 million people moved to California from other parts of the country. According to the California Department of Finance estimates, the state has lost residents to other states every year since 2001.
The 2020 census pegged the state’s population at 39.5 million and a recent report from the Census Bureau says California had a net loss of more than a quarter-million residents between July 1, 2020, and July 1, 2021.
Take a very small sampling. I had six friends sell their homes in the last year. One moved to Santa Maria. The other five moved out of state.
WHAT DO YOU THINK?
******************************
California remains one of the most desirable places to live, with an economy that ranks 5th in the entire world, bigger than all but four other countries. California’s economy is $3.0 trillion.
- United States (GDP: 20.49 trillion)
- China (GDP: 13.4 trillion)
- Japan: (GDP: 4.97 trillion)
- Germany: (GDP: 4.00 trillion)
- United Kingdom: (GDP: 2.83 trillion)
- France: (GDP: 2.78 trillion)
- India: (GDP: 2.72 trillion)
- Italy: (GDP: 2.07 trillion)
- Brazil: (GDP: 1.87 trillion)
- Canada: (GDP: 1.71 trillion)
By the way, Russia’s economy is 14th at $1.48 trillion. California’s economy is twice that of Russia. The US economy is 13 times larger than Russia. Interesting.
California companies, particularly companies in Ventura County, are having difficulty hiring employees because of our scarce and very expensive housing supply. And the supply we have is too expensive for new hires to buy. Something needs to be done.
WHAT DO YOU THINK?
******************************
While we can be very excited about how well housing prices have progressed, all the above factors are obviously a cause for concern. No, not a bubble, but certainly “irrational exuberance”.
As we look at recent history, as we look at market activity this weekend, it appears the market is continuing the rise it has been experiencing. It doesn’t seem that it cares about all the above factors.
WHAT DO YOU THINK?
******************************
Let’s look at our market statistics and see if there are any changes that can be seen.
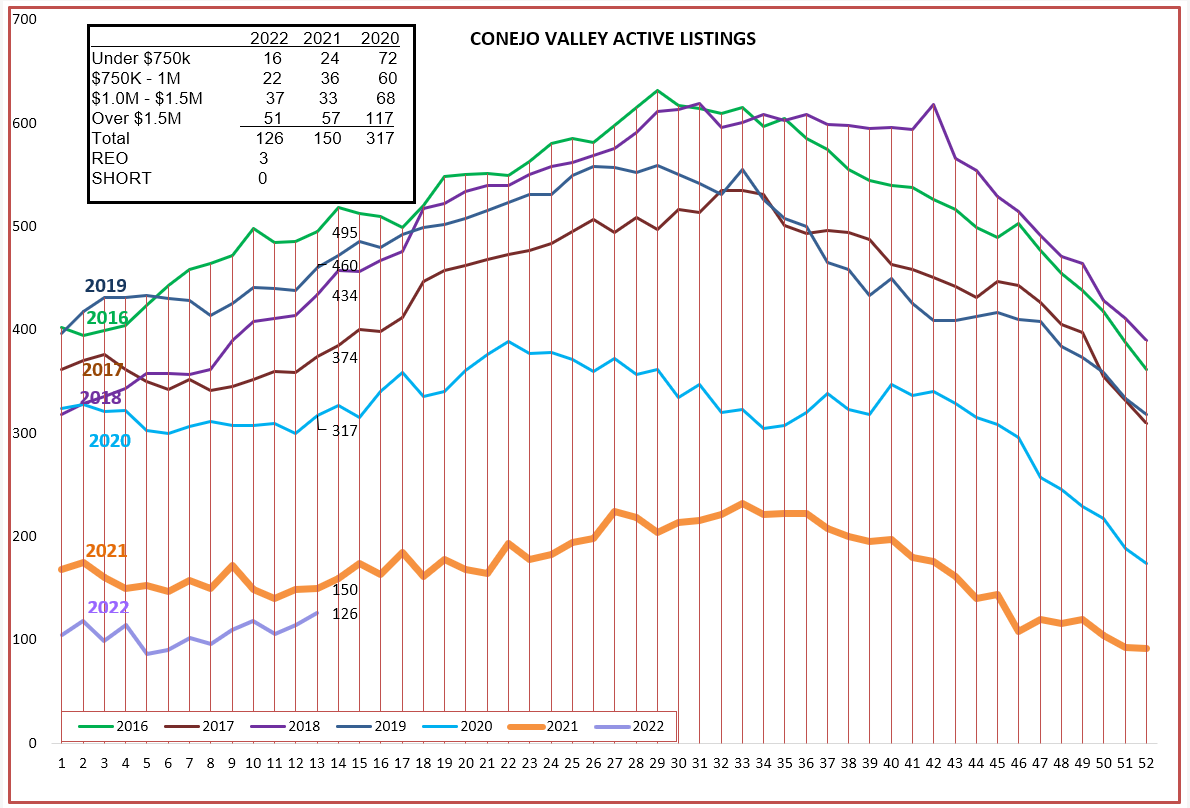
INVENTORY
Still ridiculously low. Still multiple offers, all-cash buyers, overbids. Why is the inventory so low? Why aren’t owners listing their homes? One of the many answers is—Where will I move to? It is great to take a profit, to benefit from multiple offers, but not so great when you have to locate and buy your next home. Unless you move out of state. But owners who are not moving out of state are feeling locked into their homes. And with rising interest rates, they are feeling locked into their mortgages.
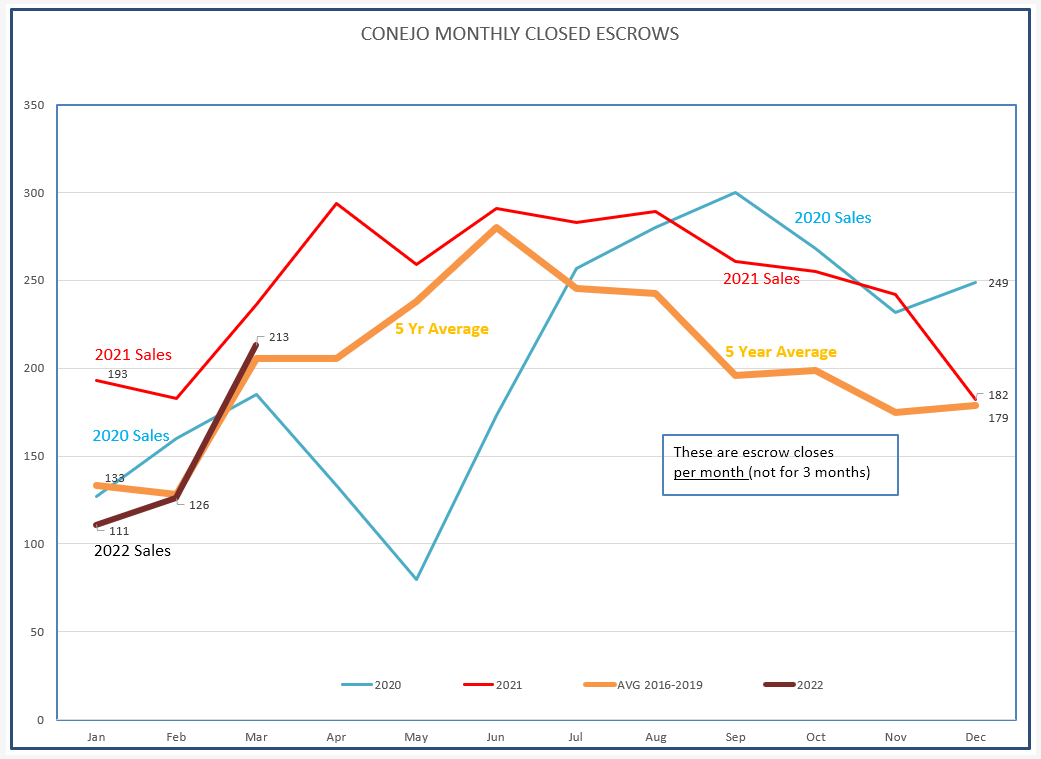
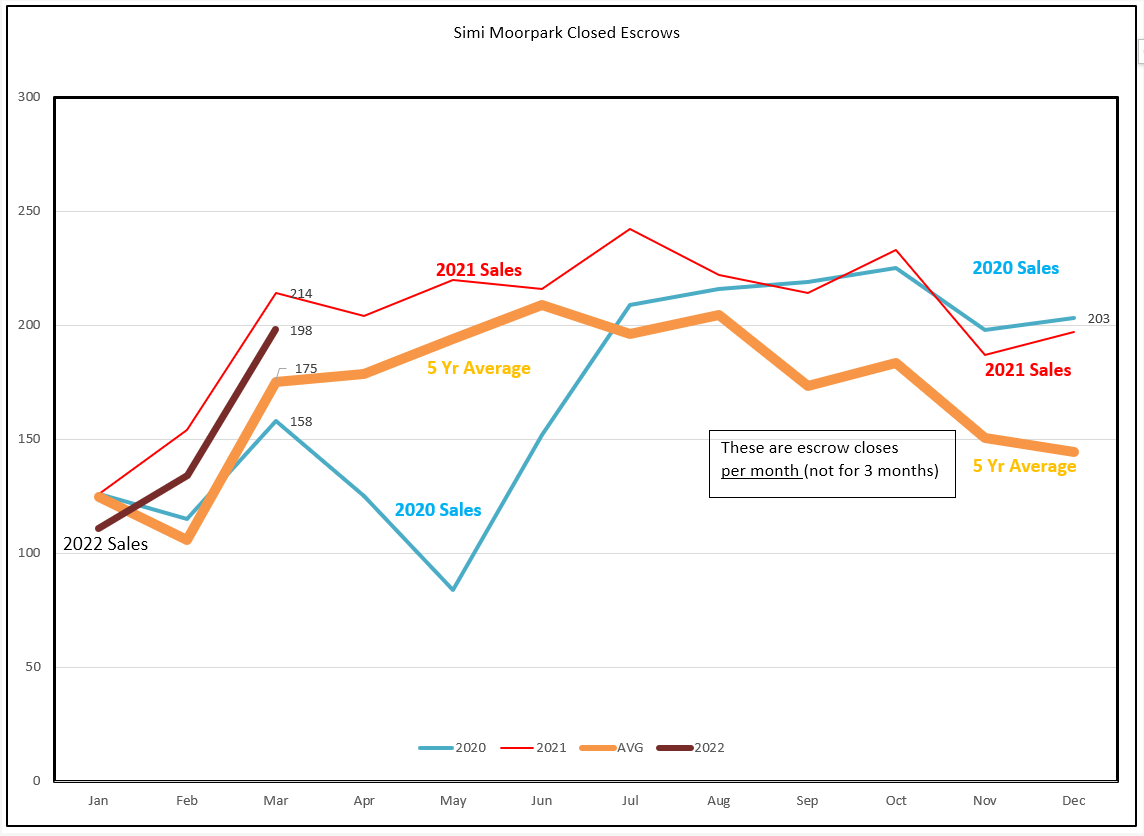
CLOSED ESCROWS
Closed escrows were put into turmoil by Covid, first with sales disappearing then with sales numbers on steroids. The chart below displays the last two years, and the beginning of 2022, compared to “normal” sales, pre-covid, a 5-year average represented by the heavy orange line. We will soon know whether 2022 follows the hyped path of 2021 (in red) or decides to become more “normal” I am betting on normal.
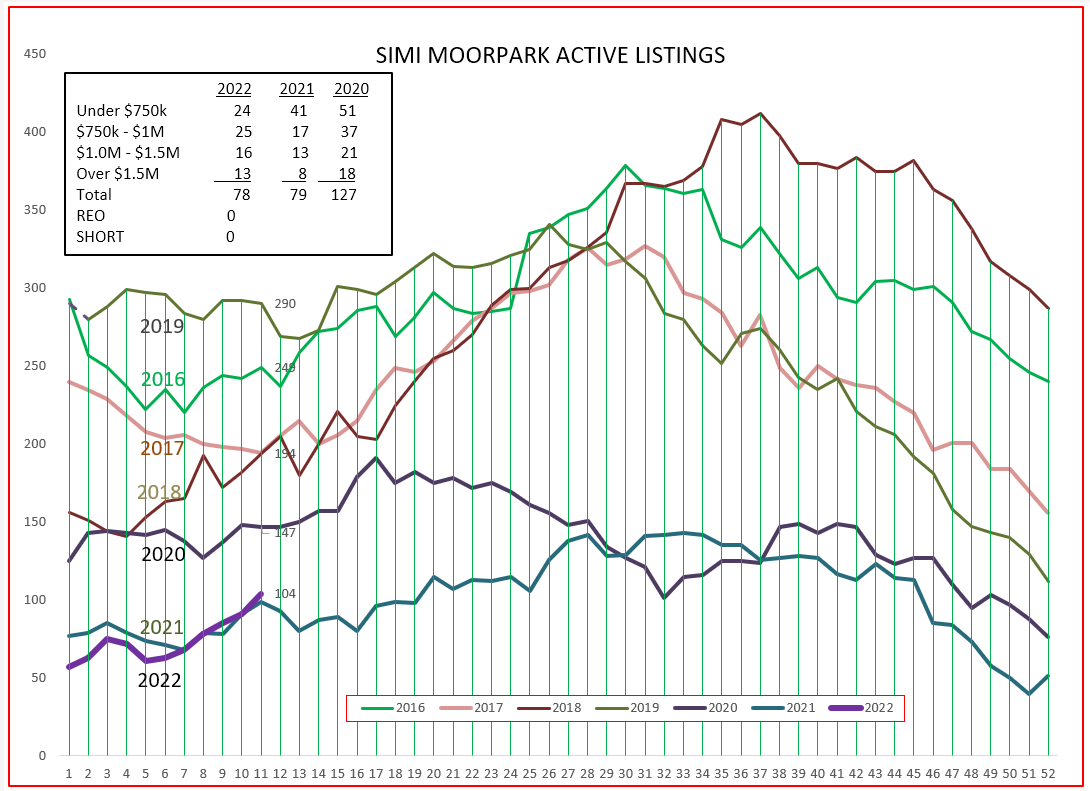
SImi/Moorpark sales can’t seem to decide whether they move to “normal”, the orange line, or the exuberant year of 2021 (red). A lot will depend on whether prices keep increasing. Even with pricing increasing as much as they did, Simi/Moorpark remains affordable for more people.
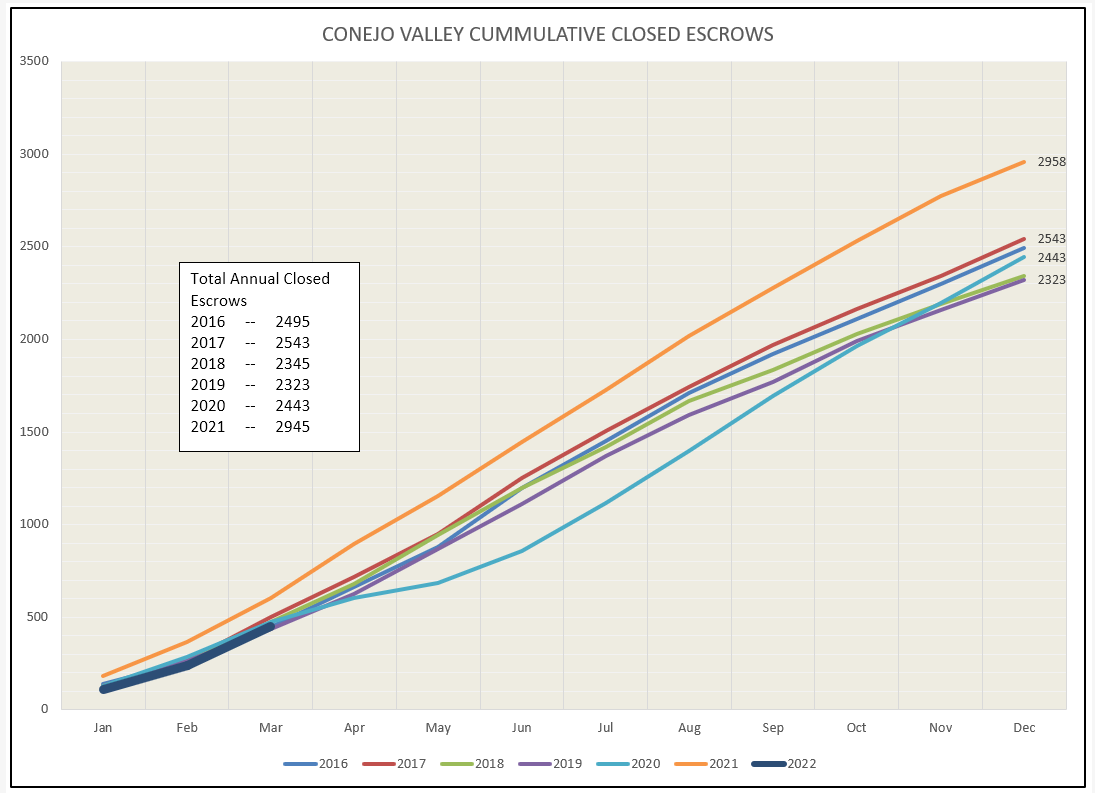
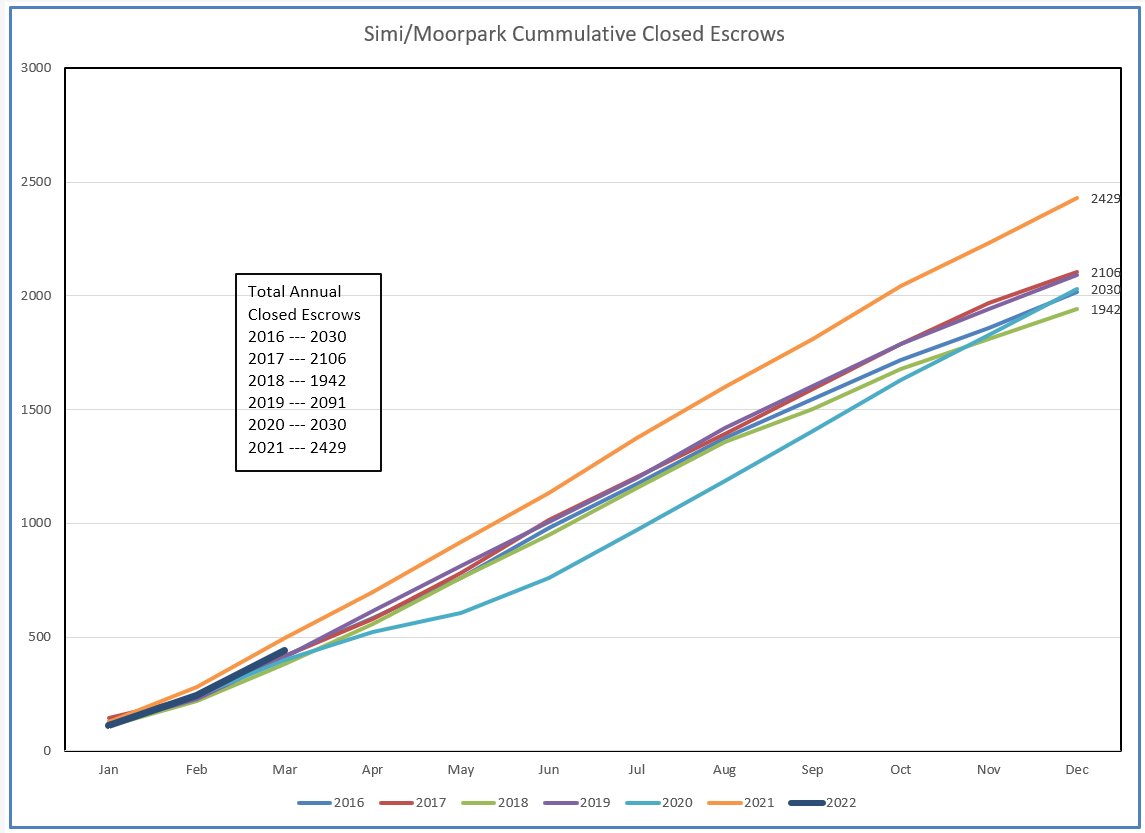
CUMMULATIVE SALES (year to date totals)
The Cumulative charts below seem to indicate that 2022 is trending more normal.
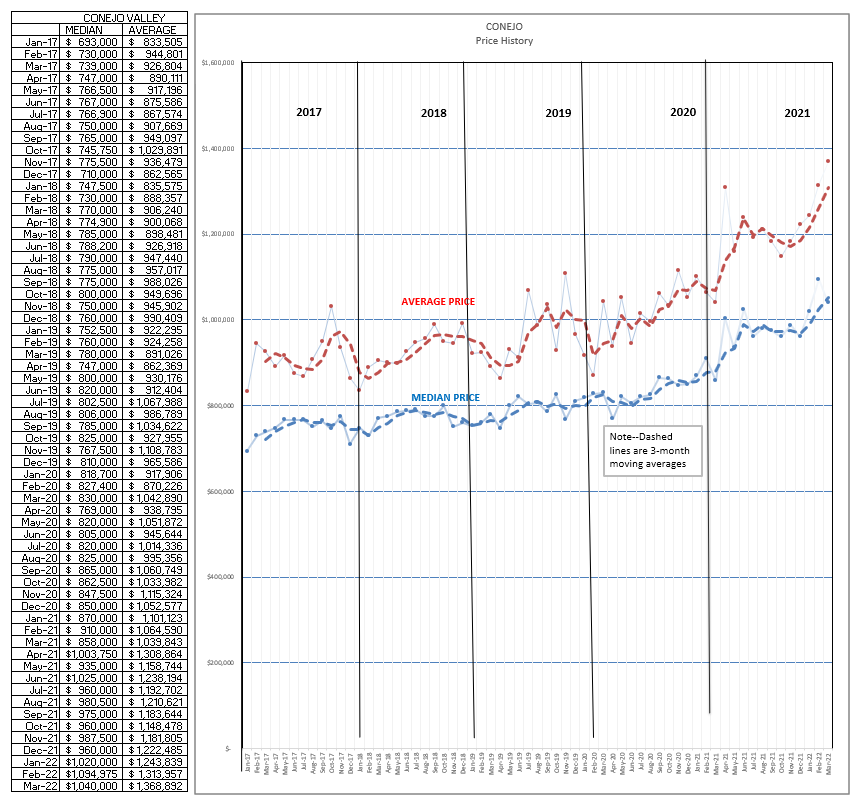
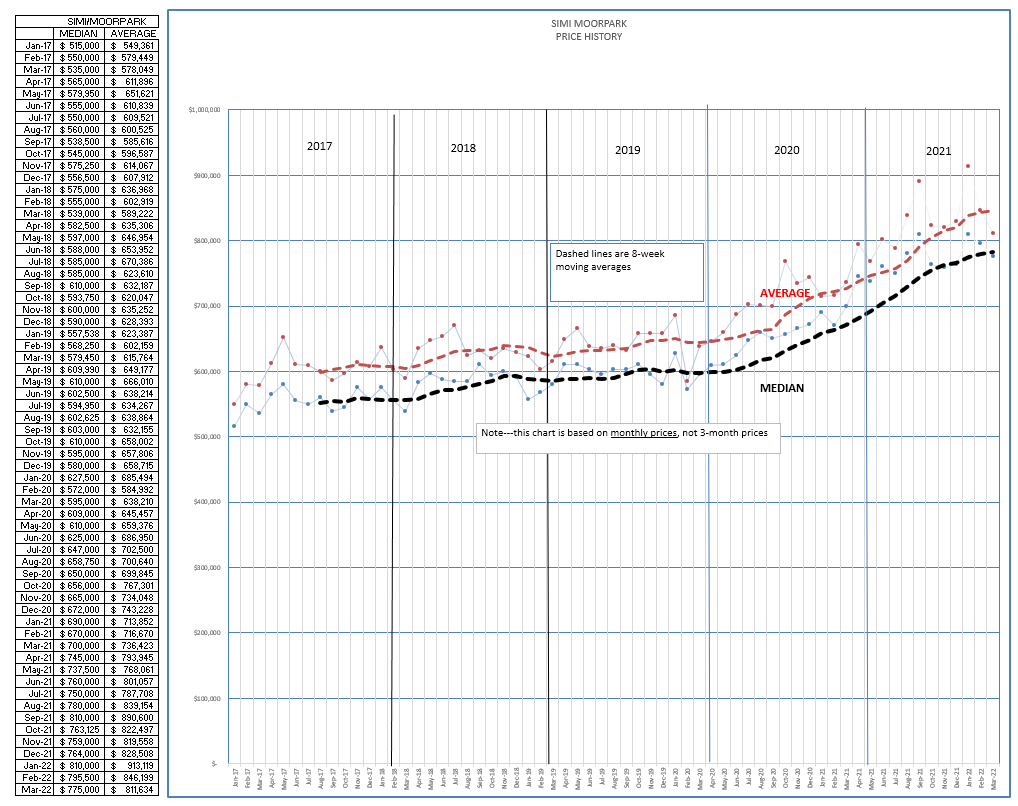
PRICES
Prices continue to rise. Unlike the numbers in the statistics comparison chart, which are three-month medians and averages, the numbers in the charts below represent prices for only a single month. That may give the chart a little more volatility, but it also gives an earlier indication where prices are trending. The median prices in both Conejo and Simi/Moorpark seem to have taken a breather in March. (see the March prices in the left hand columns).
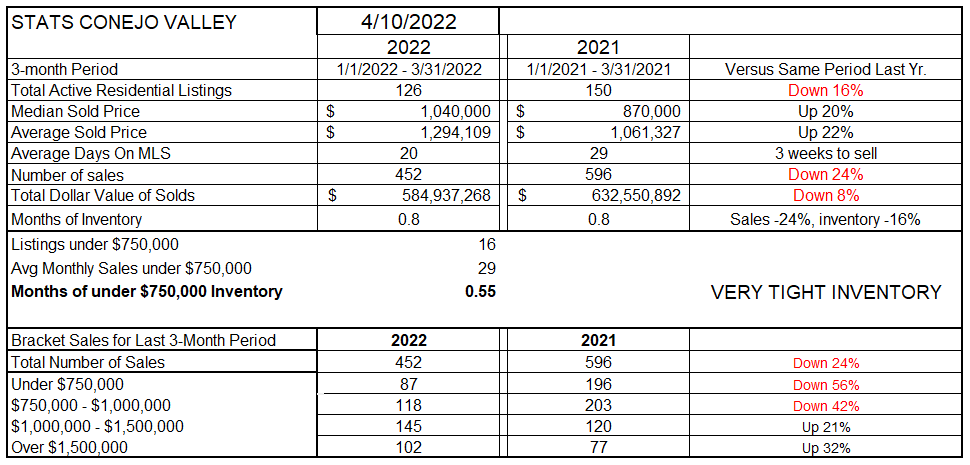
STATISTICAL COMPARISONS
This is the table we usually talk about. It shows actual numbers, not graphs. For the Conejo Valley, prices comparing the most recent three months to the same months last year, shows that prices have increased by 20-22%. Part of the reason is miniscule inventory, down 16% from last year. But note the Number of Sales. Down 24%. Is that due to lack of inventory, or? Note the Months of Inventory. The same for both years, about 3 weeks. Still a strong number. But in 2021, three weeks worth of inventory was 596. In 2022, three weeks worth of inventory is 452. Homes continue to sell quickly, but there is weakness developing.
WHAT DO YOU THINK?
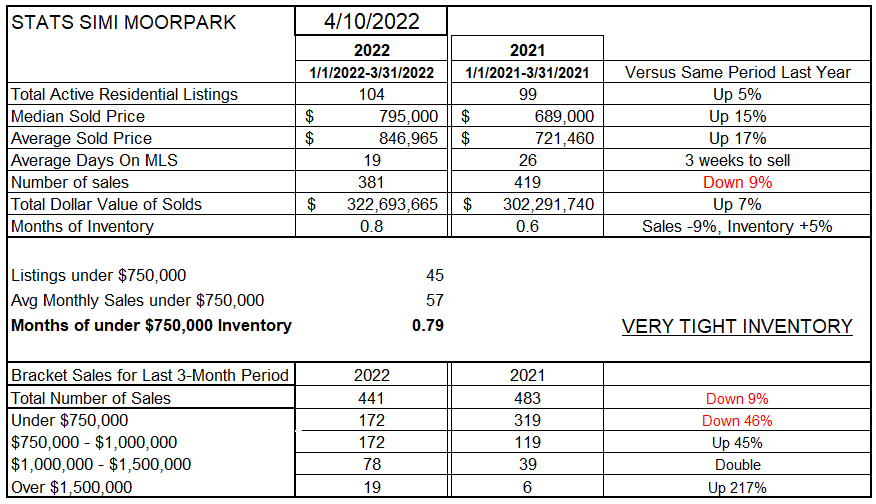
Simi Valley/Moorpark figures show an inventory up 5%, but the total is still miniscule. But for the last three months, compared to last year,. sales were down 9%. Prices were up 15-17%. The Months of Inventory figure represents three weeks worth of sales in 2022, only a little over two weeks worth of sales in 2021. There is weakness developing.
Have people slowed buying because housing is no longer attractive to own, or have they slowed buying because they cannot afford to buy homes at these prices? Or at these interest rates?
Do sellers want to move up to a nicer home? Or is their current home looking more attractive because it has a no-longer-available interest rate?
WHAT DO YOU THINK?
A crash is not in our future. But a slowdown is. That’s what I think.
WHAT DO YOU THINK?
Have a fabulous month of April. Life is getting more normal. Went to church this morning and practically no one was wearing a mask. But went to get a coffee and people there were in line with masks on. We are no longer dealing with mandates, we are dealing with individual decisions. Things are better, but they are still not “normal”.
Stay safe, stay healthy, and keep up with the basics to keep your real estate business healthy for years to come.
Chuck