Sorry, you have reached the wrong blog, at least the wrong person to give you that decision. Lots of high-priced economists are arguing over that one.
When the great recession of 2008 was upon us, people said the difference between a recession and a depression was that a recession is when your neighbor lost their job, a depression was when you lost your job.
Neither is happening. Jobs are being created at a solid, high pace, and unemployment remains at record lows. People are working and earning money. However, the FED is working dilligently to increase interest rates in order to slow down inflation, and that will eventually have the effect of increasing unemployment. It has already had the effect of raising mortgage rates, thereby slowing down the real estate market.
Instead of talking about the larger economy, let’s talk about our part of it, our real estate market. All real estate is local.
With the onset of Covid-19, everyone forecasted that the entire economy would tank. The real estate market looked as if it would cease to exist. Everyone was locked up inside their home, fearing the freeze of all economic activity. No open houses, no listing appointments, no showings, no offers.
Instead, it lead to a period of high home price inflation coupled with a high rate of sales. I am not talking about the inflation figures that the Bureau of Labor Statistics publishes, but inflation of home values. The Fed noticed inflation climbing in the past few months. Our real estate inflation has already taken place, and most of it happened before the start of this year.
The graph below is a history of monthly Conejo Valley Median and Average home prices from January 2017 to July 2022. In those five years, median prices increased a total of 58%. ( Average prices increased 43%. For the remainder of this writing, I am going to reference only Median prices. If you want to compute the average prices, the figures are below.)
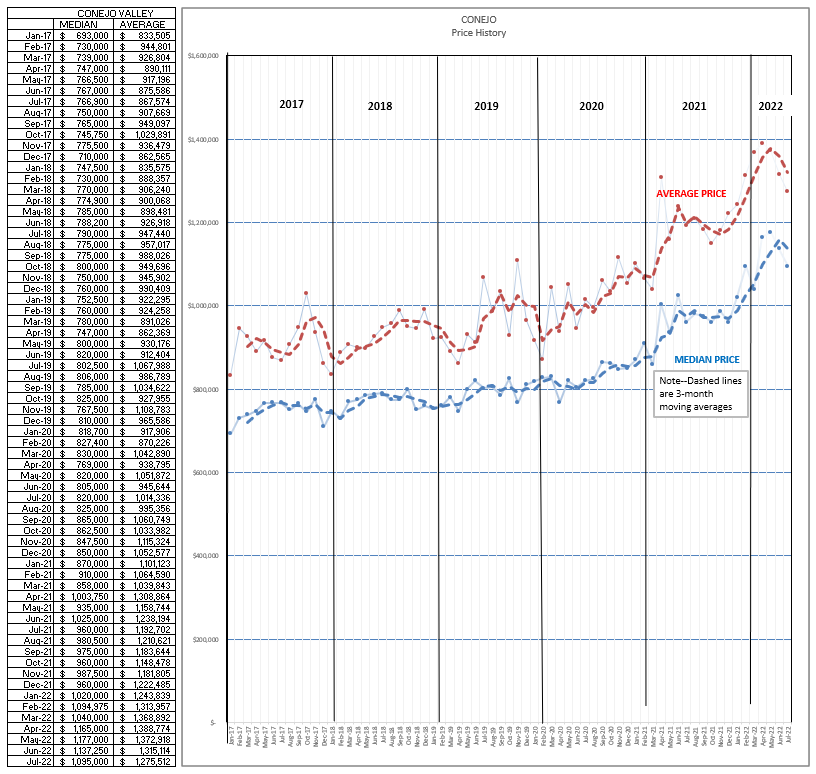
Covid hit in March 2020, and due to 60-day escrows, we reported the drop-off in sales 60 days later, in May 2020.
During the roughly three years from January 2017 until May 2020, median home prices increased from $693,000 to $820,000, a total increase of $127,000 or 6% a year. A realistic number, considering the absolute shortage of homes.
What happened after Covid hit? Median home prices in May 2020 were $820,000, versus last month’s price of $1,095,000, an increase over those two years of $275,000 or an average increase of 17% per year (34% over two years). Almost triple the annual home price inflation rate of the prior three years.
The media talks about how inflation has gotten out of control this year, gasoline prices jumped significantly, with housing and food costs also rising.
News flash: housing prices already increased over the prior two years, by 34%. Inflation has already taken place. Activity and prices are now leveling out. You can see from the chart above that prices are beginning to trend downward. That can be expected when mortgage rates significantly increase and consumer confidence tanks. The question everyone wants to know is: How far down will prices adjust?
Someone a lot smarter than I, CAR Chief Economist Jordan Levine, gave a market update on July 7. His forecast is that prices may decline by as much as 7% next year. That seems realistic to me. After the rambunctious market of the past two years, it is time for the market to pause, to take a breather. Balancing that 33% increase in the last two years with a 7% decrease next year, prices will have risen by 26% over this three year period, or an 8% average increase per year. A realistic number, compared to the 6% annual increase from 2017 to 2020. You might even call it normal.
And the 7% price drop comes with some good news attached. Affordability will go up, enabling more people to buy a home, creating more demand.
Buyers are hesitant to buy when the market is declining, waiting for it to balance out. There will be a short period of time during which the market will see a slowdown. But when that market begins to level out, buyers will come roaring back. We have a shortage of homes. We have millennials making excellent salaries, and they are saving up for a down payment. The market will not cease to exist, it will just be less active for a short while.
How about Simi Valley and Moorpark?
Covid hit in March 2020, and due to 60-day escrows, we reported the drop-off in sales 60 days later, in May 2020. During the roughly three years from January 2017 until May 2020, median home prices increased from $515,000 to $610,000, a total increase of $95,000 or 6% a year. A realistic number, considering the absolute shortage of homes.
What happened after Covid hit? Median home prices in May 2020 were $610,000, versus last month’s price of $840,000, an increase over those two years of $230,000 or an average of 18% per year (36% over two years). Similar to Conejo, almost triple the inflation rate of the prior three years.
Balancing that 36% increase in the last two years with a 7% decrease next year, prices will have risen by 29% over this three year period (2021-2023) . Or a 9% average increase per year. A realistic number, compared to the 6% annual increase from 2017 to 2020. Considering the shortage of housing, you might even call it normal.
And the 7% price drop comes with some good news attached. Affordability will go up, enabling more people to buy a home.

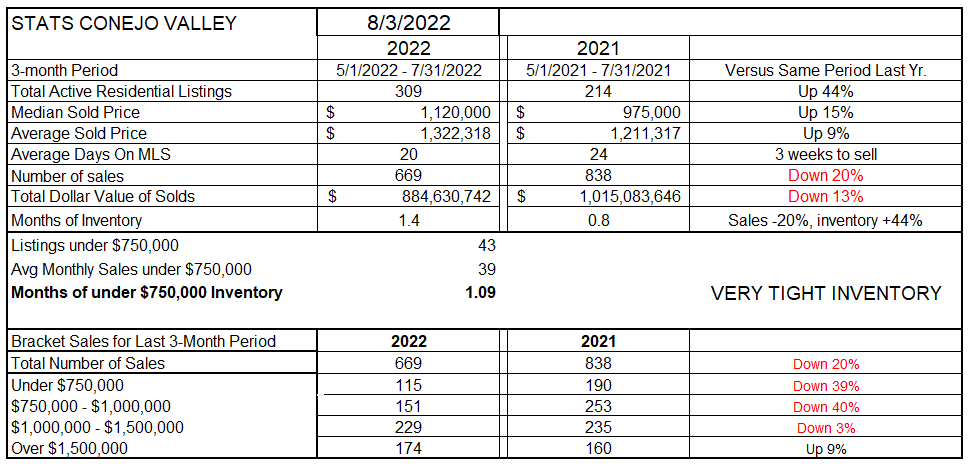
Now let’s look at what happened in July. Remember, these stats are for a three month period, May through July. That averages out the changes, but it also does not give the best picture of what is happening currently.
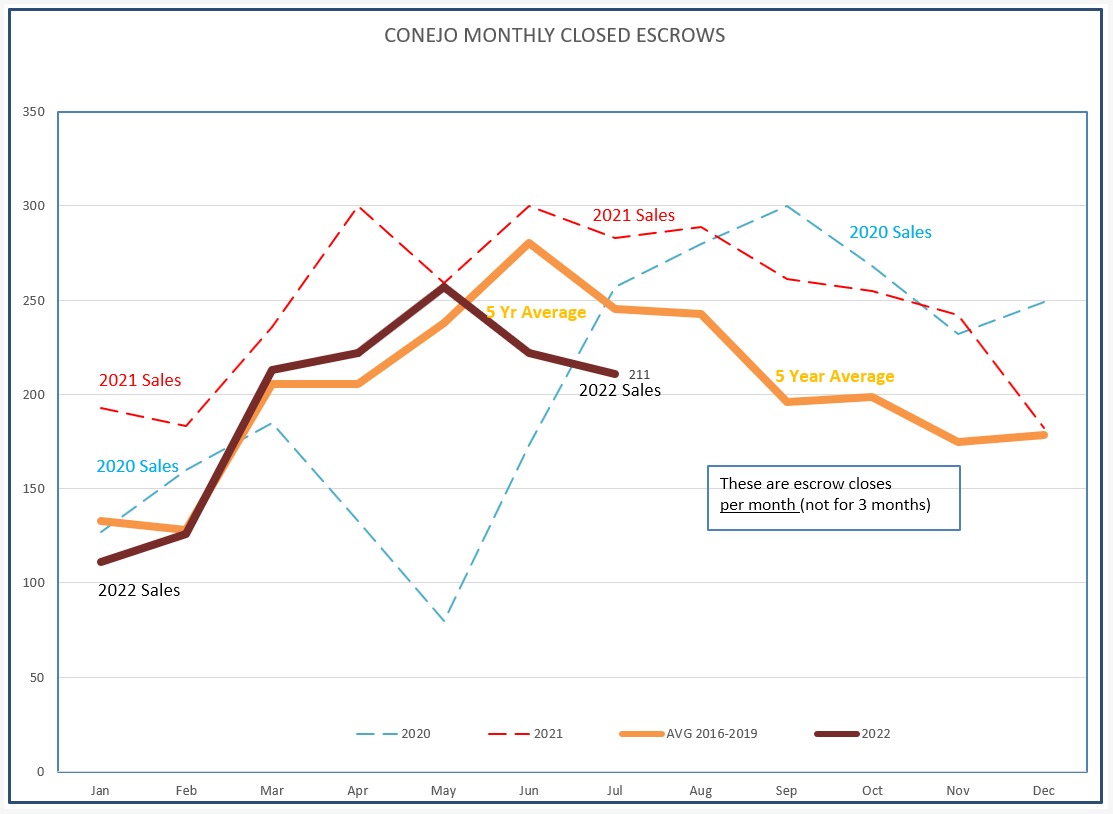
Inventory has grown compared to the same time period last year, up by 44%. Home price increases have been in the high teens, but the average price has now pulled back to 9% year over year. The number of sales during this three month period is down 20%. (For the month of July, 211 homes closed escrow in 2022 versus 281 in 2021, a decrease of 25%.)
When sales decrease and inventory increases, the months-worth-of-sales figure climbs. For the past two years our inventory has represented about three weeks worth of sales. This year, with inventory growing (numerator) and sales declining (denominator) the inventory now represents about six weeks worth of sales.
Where have we seen the biggest drop in sales? Inflation has played havoc with comparisons. The figures have to be adjusted to higher brackets. You can play with the numbers yourself, for your areas, but the overall sales decline of 20% for all homes is important to note, as is the 25% decline for the month of July 2022 versus July 2021.
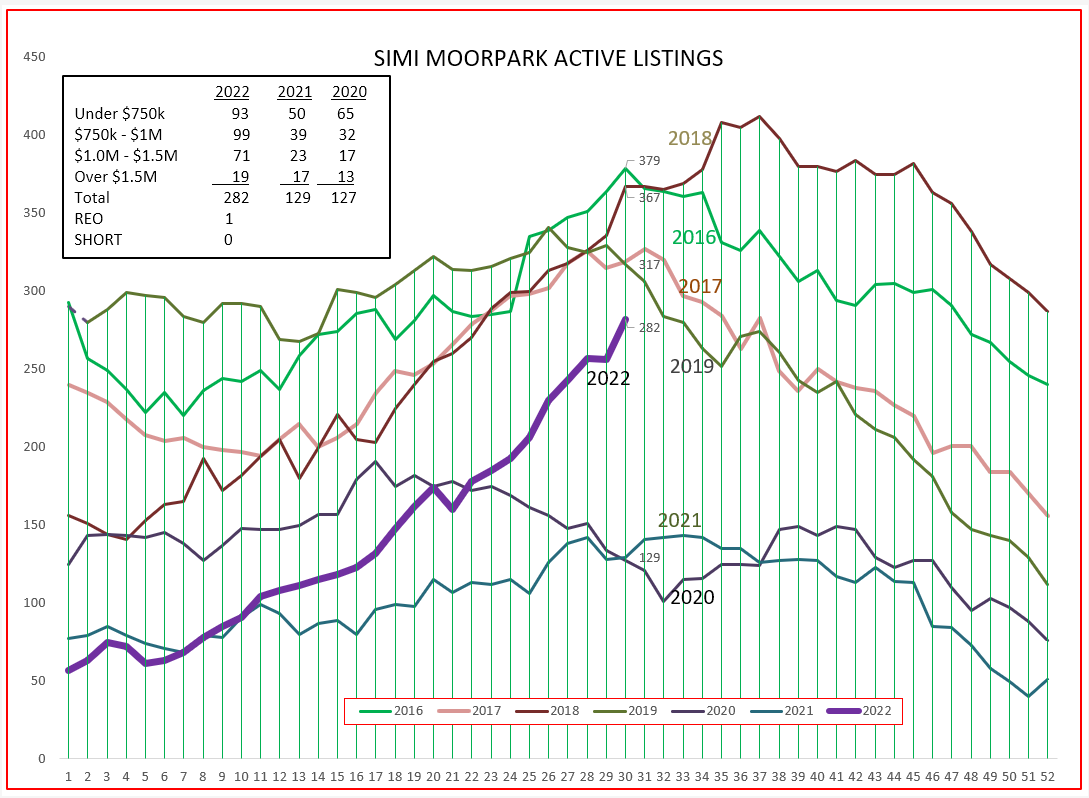
The table for Simi Valley and Moorpark is below. Simi/Moorpark has been working under extremely tight inventory for over two years.
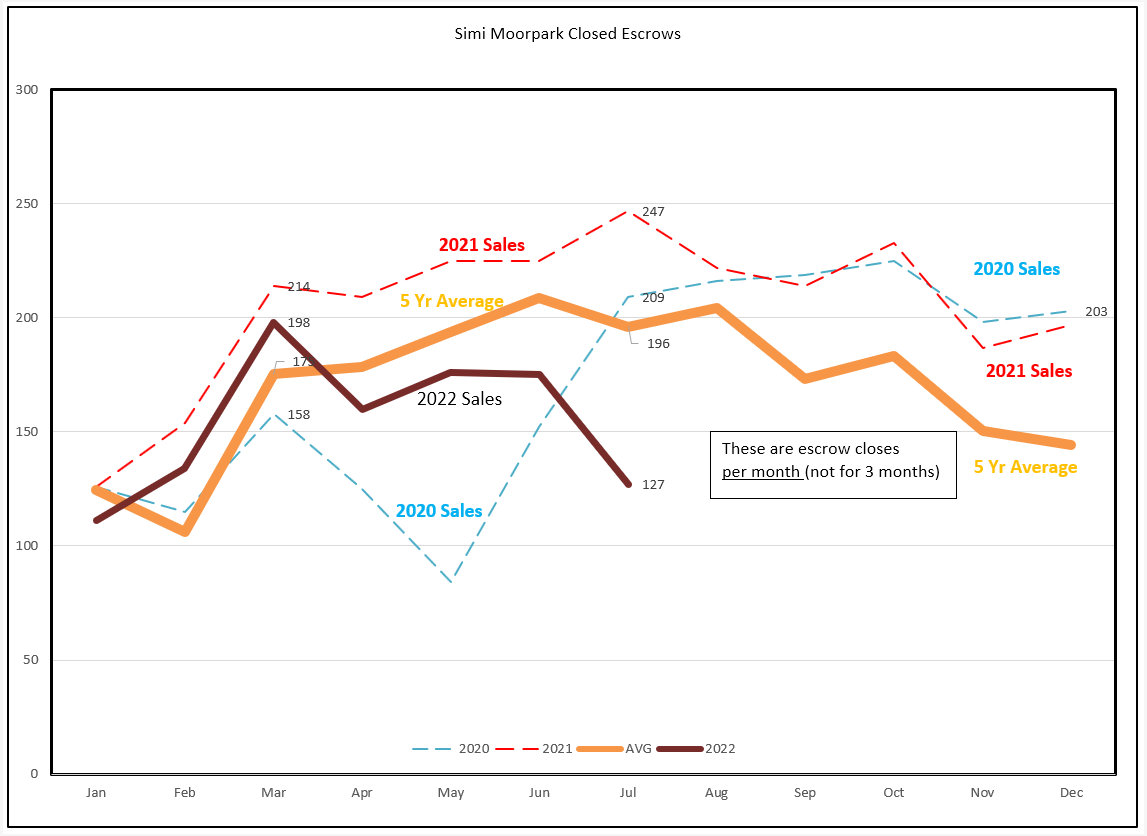
Inventory has skyrocketed compared to the same time period last year, up by 119%. Home price increases have been in the high teens, but the average price has now pulled back to the low teens. The number of sales during this three month period is down a whopping 30%. (For the month of July, 127 homes closed escrow in 2022 versus 247 in 2021, a decrease of almost 50%.)
When sales decrease and inventory increases, the months-worth-of-sales figure climbs. For the past two years our inventory has represented two-three weeks worth of sales. This year, with inventory growing (numerator) and sales declining (denominator) the inventory now represents about seven weeks worth of sales.
Where have we seen the biggest drop in sales? Inflation has played havoc with comparisons, particularly since the median home price in Simi/Moorpark is now $830,000, and last year was $750,000. The figures have to be adjusted to higher brackets. You can play with the numbers yourself, for your areas, but the overall decline of 30% for all homes is important to note, as is a 50% decline for the month of July 2022 versus July 2021. Clearly the market has slowed down.

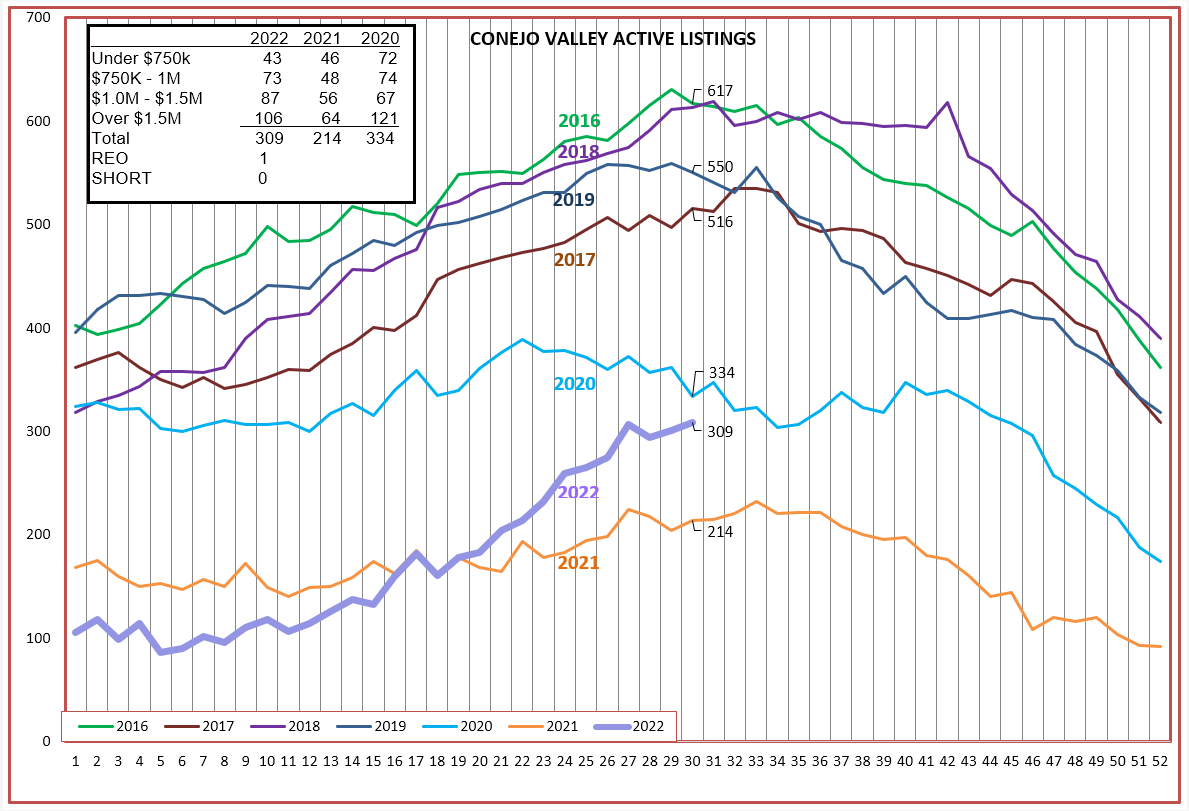
Let’s look at these increases on the inventory graphs, to compare them to the past six years. 2020 and 2021 were anomalies, whereas the graph for 2022 more closely resembles the behavior of a normal year. However, I don’t think that 2022 will finish as a normal year. Sales have slowed dramatically, and inventory may continue to increase as we approach the usual inventory downturn in September. Unlike 2008, notice that the area only has one REO out of 309 listings.
The graph for Simi/Moorpark is even more pronounced. This is what a 119% increase in inventory year over year looks like, starting from only around 60 listings at the beginning of the year. This is something to watch. Also, only one REO in the 282 listings.
Let’s next see how sales are doing in the Conejo. Rather than the table with three-month figures, this more accurately shows the drop in sales that began two months ago. 2020 and 2021 are dashed lines, because those figures were truly out of the ordinary. The orange 5-year average line is more like what a normal market looks like, and you can see that 2022 has now deviated from the expected curves.
For Simi/Moorpark, the same thing is happening. Things will get better, but the combination of higher mortgage rates and dropping consumer confidence is causing the real estate market to pause and catch its breath.
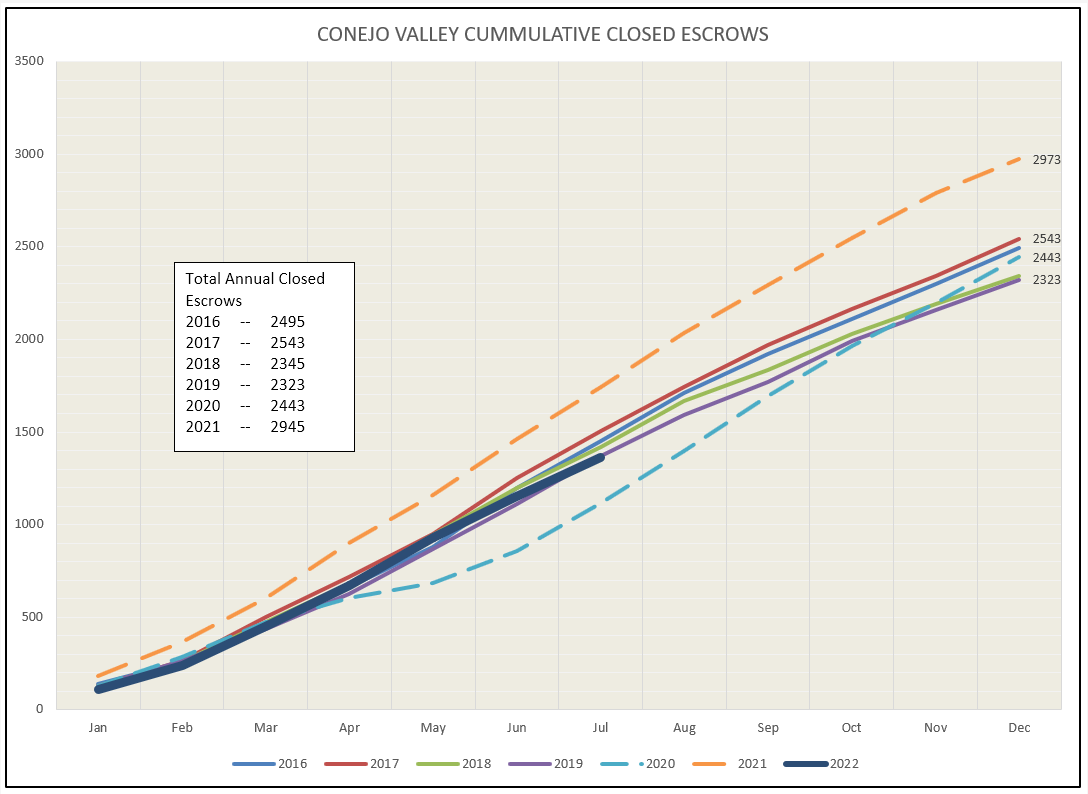
Looking at the Cumulative Sales chart, we can see as the year progresses, the weakness in sales is causing the 2022 line to slowly lose altitude. Not a crash landing, but we look to finish the year a little lower than any of the past six.
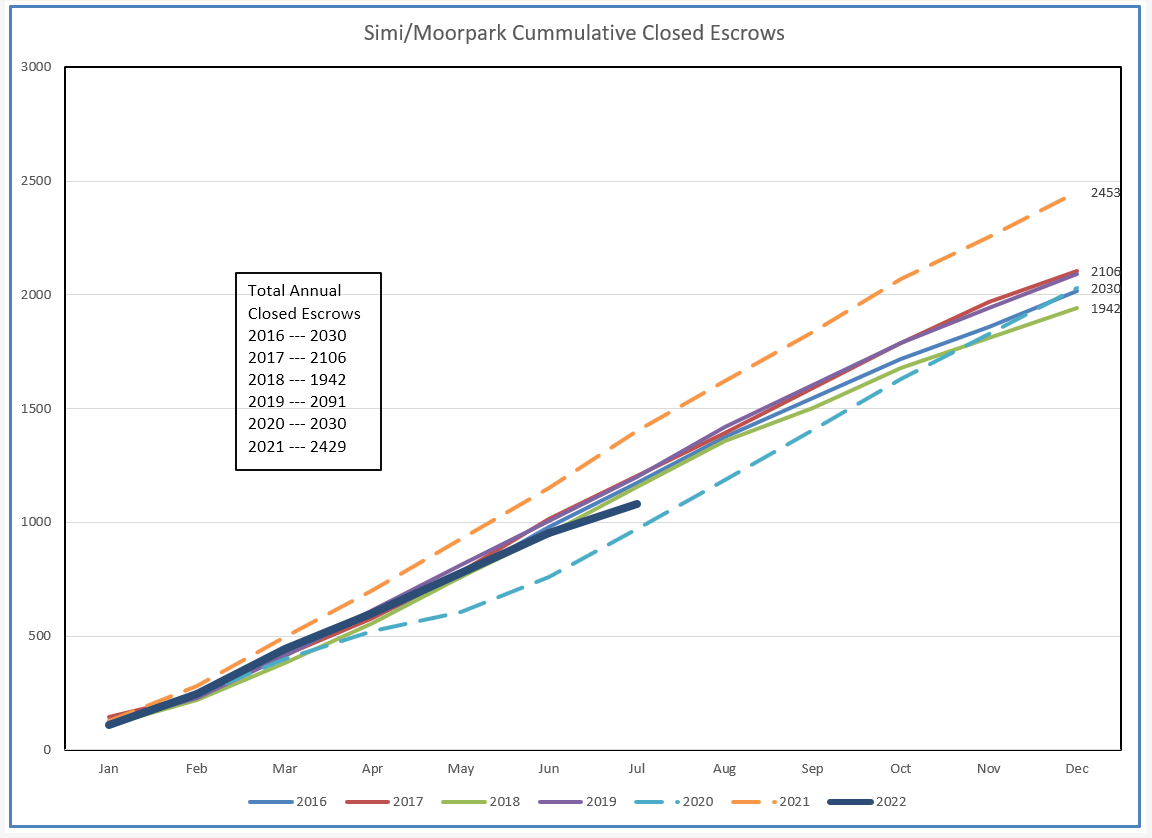
Simi/Moorpark sales figures show a more pronounced drop occurring.
A wise speaker at an event I attended spoke of the value of information. If you knew what happened, and that could help you foretell what was going to happen, you could prosper from the information. It did not matter whether things were going up or going down, you could still prosper because you had knowledge of what the future would be like.
That is the best message for today’s market. Multiple offers are lessening, price adjustments are increasing. Understanding the market can help you give the right advice to your clients. Think about what has happening, about what is happening now, and armed with that information you can remain the valued real estate advisor that you have worked hard to be. Everyone will still want to know “How is the Market Doing?”
Stay safe, stay healthy, and stay in touch.
Chuck