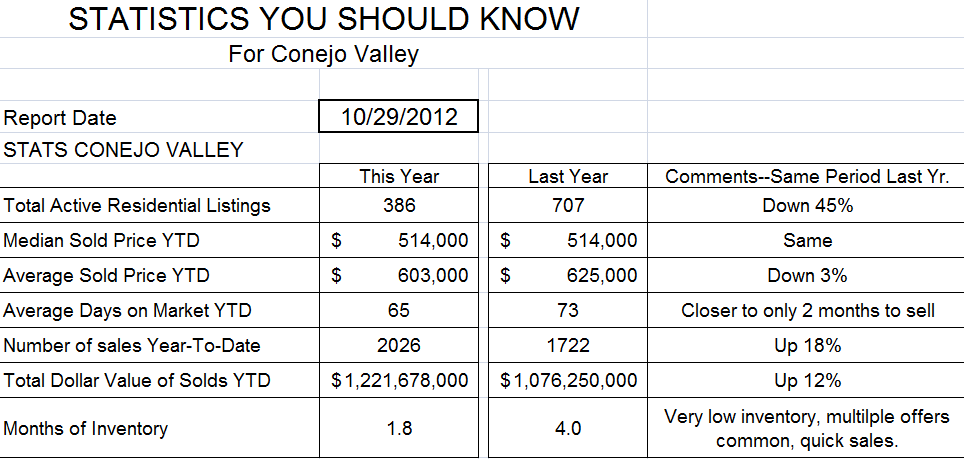
What was the market like 10 years ago? This was the Stat Table in 2012.
Compared that to today
If you bought or owned a house 10 years ago, just a couple of years after the start of the Great Recession, that home is worth twice as much today, and it took twice as long to sell it in 2012 . There were lots of listings in 2011 and 2012, but unfortunately most of them were REOs..
Notice the final comment for the 2012 table. Very low inventory, multiple offers common, quick sales. Ten years later we had the same experience.
Nice to know that housing values doubled, but now to more pressing issues—INFLATION.
Why has inflation become such a big problem, and what caused it? These are my thoughts.
First, below is an explanation from the Treasury Department website defining the National Deficit.
Understanding the National Deficit (Which adds to the National Debt)
A budget deficit occurs when money going out (spending) exceeds money coming in (revenue) during a defined period. In FY 2022, the federal government spent $6.27 trillion and collected $4.90 trillion in revenue, resulting in a deficit. The amount by which spending exceeds revenue, in this case $1.38 trillion, is referred to as deficit spending.
The opposite of a budget deficit is a budget surplus, which occurs when the federal government collects more money than it spends. The U.S. has experienced a fiscal year-end budget surplus only five times in the last 50 years, most recently in 2001.
Budget surpluses are unicorns.
The Federal Government always seems to be in a deficit situation, spending more money than they take in. We would like Congress to spend less, but we really don’t approve of them taking in more money, because that comes from us in the form of taxes. The National Debt (the running total of all the National Deficits) is an extremely large number. It grows almost every year.
For 2019, the last year prior to COVID, the deficit was :
- Revenues $3.462 TRILLION
- Outlays $4.447 TRILLION
- Deficit ($0.984 TRILLION)
The National Debt in 2019 was $22.719 Trillion
COVID hit in March 2020. Lets think about what the government did to keep the economy going. By government, I do not mean the FEDERAL RESERVE, I mean Congress—what Congress does is called Fiscal Policy.
For a close-to-home example, for the first time in history, independent contractor real estate agents were able to apply for unemployment (Thank you, N.A.R.!) Not only normal state unemployment payments, but payments dramatically increased by Federal supplements. Some agents and most brokerages applied for PPP loans, which were given with the promise that they would be forgiven. Most companies also applied for PPP loans. Even huge companies, like airlines, cruise ships, hotels and car manufacturers.
Rents were not being paid, so the Federal Government decided to pay them for the renter, to the landlord. Basically this was more income for the renter. Additionally, renters could not be evicted. Some rents were not paid, but that was usually due to confusion at the state and local levels, as the Federal government printed plenty of cash. Many Section 8 renters lost their jobs in hospitality and restaurants, causing the local Area Housing Authorities to pay 100% of the rent to the those landlords. Restaurants were closed, but groups provided meals cooked by the restaurants, bought with grant money, and delivered by volunteers to qualified elderly groups. Schools could not provide classes, but did provide take-home lunches. People lined up for free COVID shots and boxes of free groceries.
During this same time period, savings rates rose dramatically, because the government was basically providing wages while helping pay expenses.
All in all, the Federal Government funneled so much money, through the states, that the economy kept moving along at a healthy clip, even though many were out of work.
How much money did the Federal Government spend during this time?
These are the fiscal policy measures passed in 2020 to boost the economy flattened by COVID:
- Coronavirus Preparedness and Response Supplemental Appropriations Act, became law March 6, 2020 $8 Billion
- Families First Coronavirus Response Act, became law on March 18, 2020 $192 Billion
- Coronavirus Aid, Relief, and Economic Security (CARES) Act, signed into law on March 27, 2020 $2,200 Billion
- Paycheck Protection Program and Health Care Enhancement Act, signed into law on April 24, 2020 $484 Billion
- Consolidated Appropriations Act (CAA), 2021, signed into law on Dec. 27, 2020 $900 Billion
SUBTOTAL $3.784 TRILLION
All the above were signed into law by President Trump.
- The American Rescue Plan Act of 2021, signed into law by President Biden on March 11, 2021 $1,900 Billion
BILLS PASSED BY BOTH ADMINISTRATIONS—(FUNDS ALREADY SPENT) TOTAL $5.684 TRILLION
These were funds over and above what the government usually needs to run the government. This was Deficit Spending.
What happened to the National Debt due to this additional spending?
The National Debit increased from $22 Trillion to $27 Trillion. Due to COVID and the government response.
In short, a tremendous amount of money was shoveled into the economy to keep it working. The good news—it worked.
However, whenever this much money is put into the economy, the consequence is INFLATION. (Econ 101).
Inflation results from too much money pursuing too few goods. Because the Federal Government provided a huge increase in the money supply, spread throughout the economy, we and the world are now suffering from inflation.
The Federal Reserve, who deals with MONETARY POLICY, not FISCAL POLICY, is now tightening up monetary policy to deal with the problems caused by FISCAL POLICY during COVID.
Think of the National Debt as a credit card bill owed by all of us. Usually the only payment is interest. Thankfully, interest rates were extremely low. But not any more.
Unfortunately, housing is squarely in the Fed’s sights. Mortgage rates this year have risen from a low around 3-1/2% to the current 7% and will be headed higher, thanks to the Feds decision last week to increase rates another 3/4%. To make matters worse, the FED stopped buying Mortgage Backed Securities, which they previously bought to keep mortgage rates down. Without the additional FED support to keep mortgage rates low, they are now totally guided by market forces.
Things will eventually get better, but it will take some time. How long? Many economists are hoping for a year.
This is my simplistic view of the economy and inflation. Given this background, it is not easy to lower inflation. But it needs to happen.
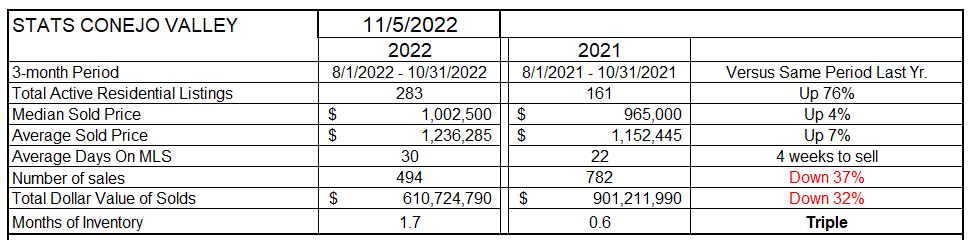
Let’s see how our local market did last month.
A portion of this table has already been included above. Inventory is up by 76% compared to last year, when we basically had nothing to sell. Median and Average prices, which in recent comparisons have been up double digits, are now computed at 4% and 7%. In this table, I historically use three months to average out the statistics. As we see prices go down, and at the time see the number of sales go down, the comparison can be confusing. Last month is not equivalent in activity to the previous two months, which can skew the numbers. When we look at the individual monthly prices a little later, we will see that prices have really begun to go down, not up. Additionally, the Months of Inventory number has increased, both because inventory (numerator) has increased and the number of sales (denominator) has decreased. In this 3-month period, sales are down 37%. This last month was a more drastic decline.
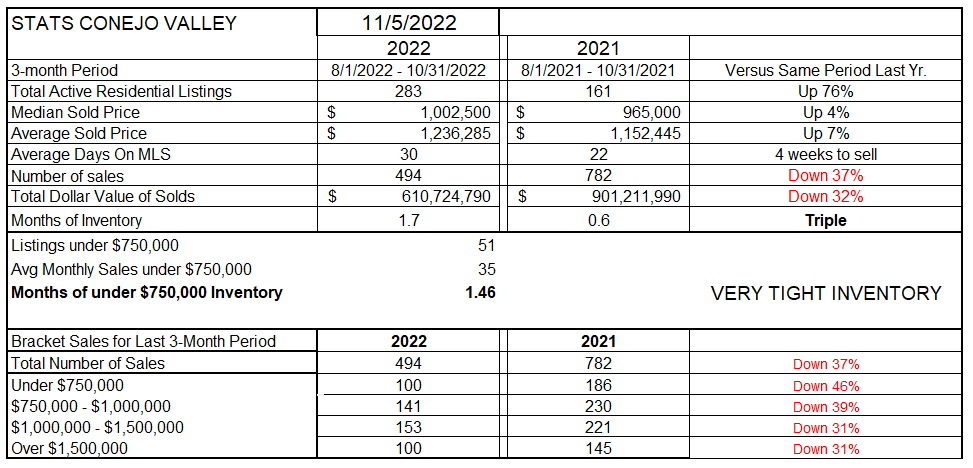
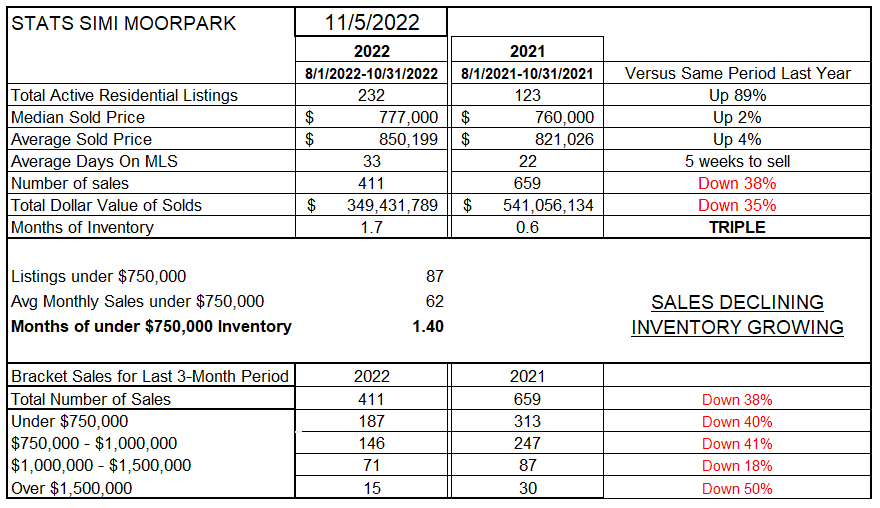
In Simi Valley/Moorpark, a similar experience. Inventory is up 89%, sales down 38%. Prices in this 3-month table are up only 2% and 4%. In both tables, the Months of Inventory is now triple what it was last year.
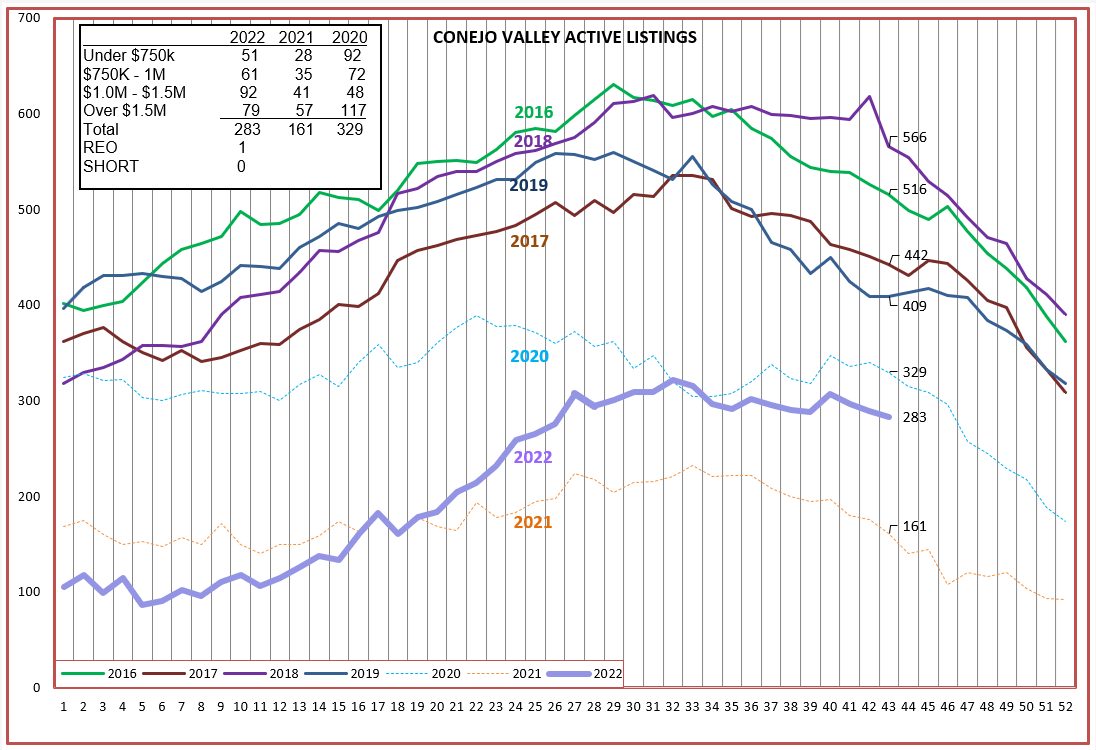
A closer look at inventory growth can be seen below. I have put the 2020 and 2021 experience in muted, dotted lines. They tend to confuse how things are going today because those two years were such an anomaly. Although lower in the chart due to much lower inventory, the 2022 inventory line is behaving much like the normal years of 2016-2019.
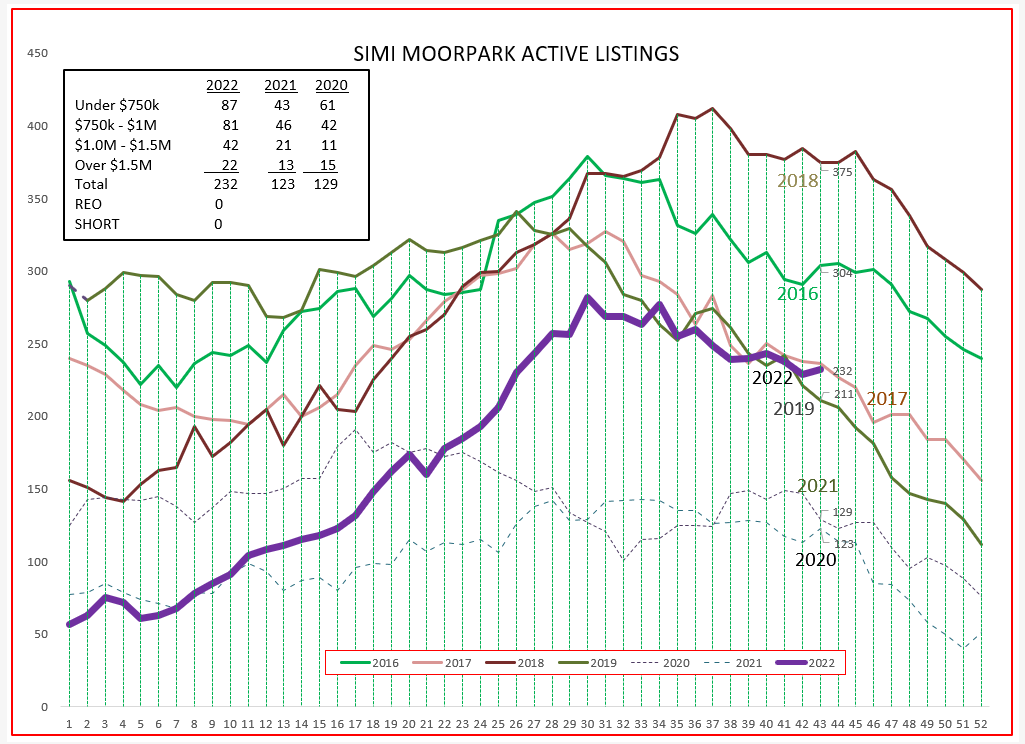
For Simi Valley/Moorpark, the same explanation holds. The 2022 inventory is actually behaving normally, as expected.
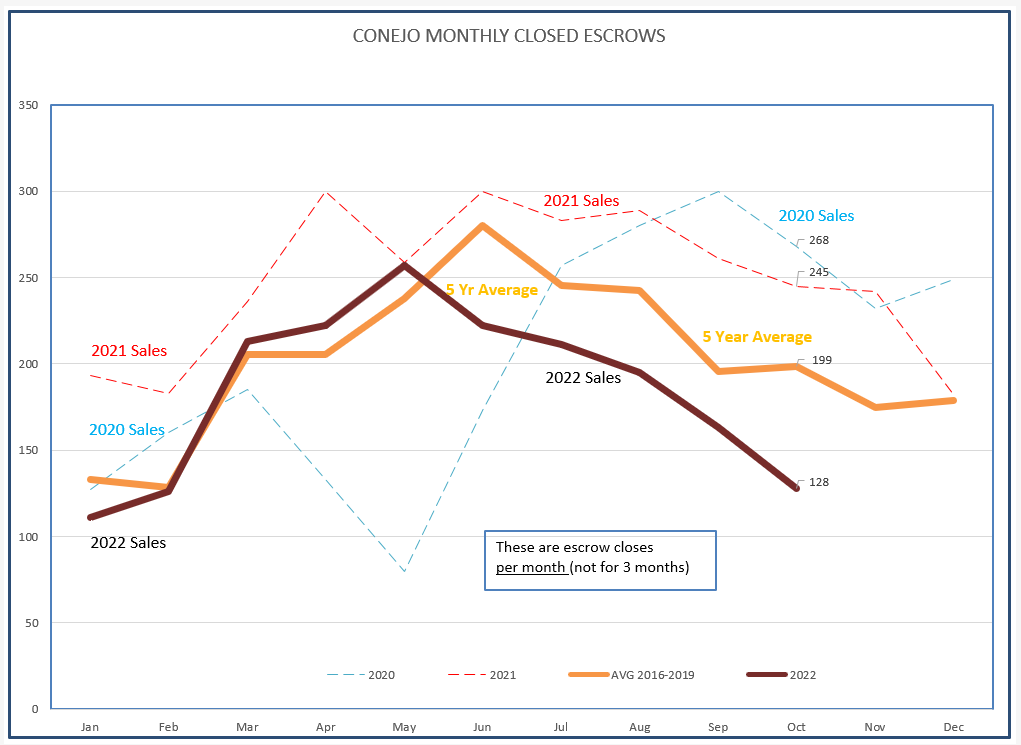
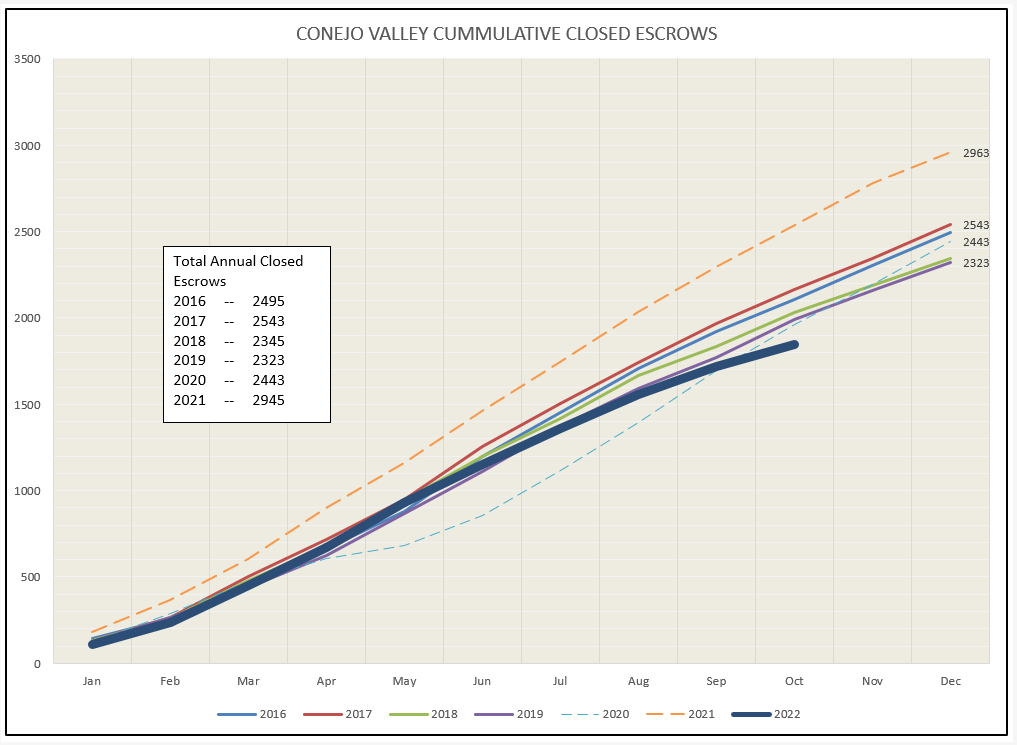
Let’s look next at closed sales for Conejo. Again, 2020 and 2021 were very unusual years. They are shown, but 2022 is behaving much like the 5-yer average of sales prior to covid. And yes, the numbers are much lower, but the graph is similar. How much lower? This gives you an idea of lower. The market is lower, but not dead.
If we look at how the history of closed sales is moving by looking at the chart of cumulative closed escrows as the year progresses, you get a better idea of how this year is turning out compared to other normal years.
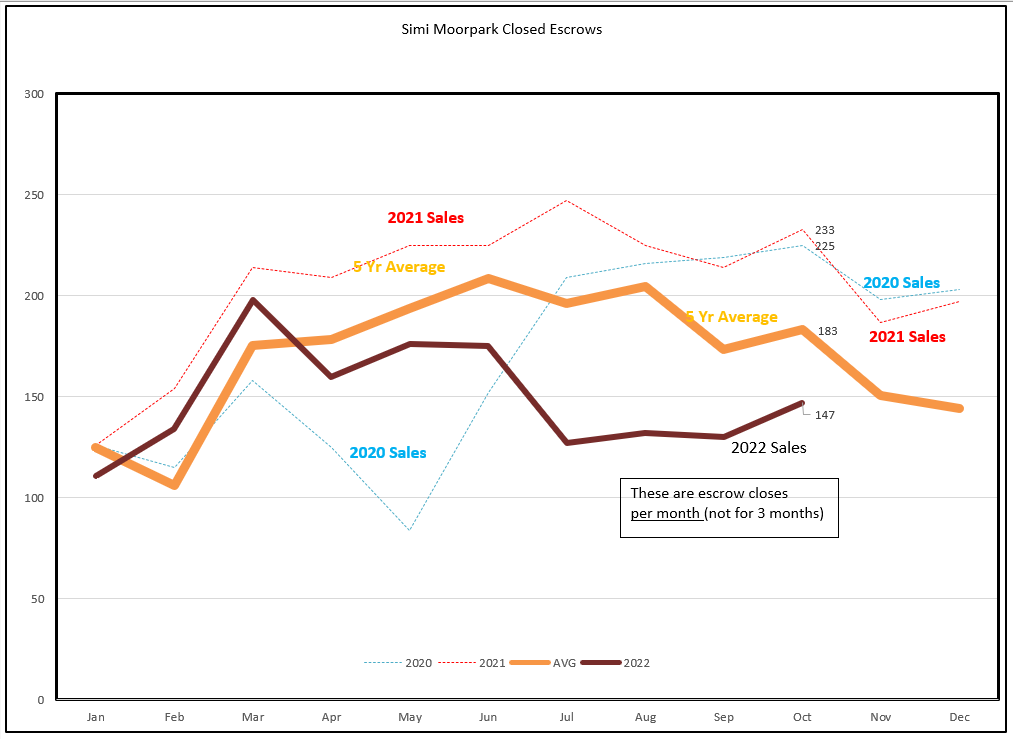
Simi Valley/Moorpark sales are similar. Closed sales took a little jump due to the temporary drop in mortgage interest rates in August. Unfortunately, that will not continue.
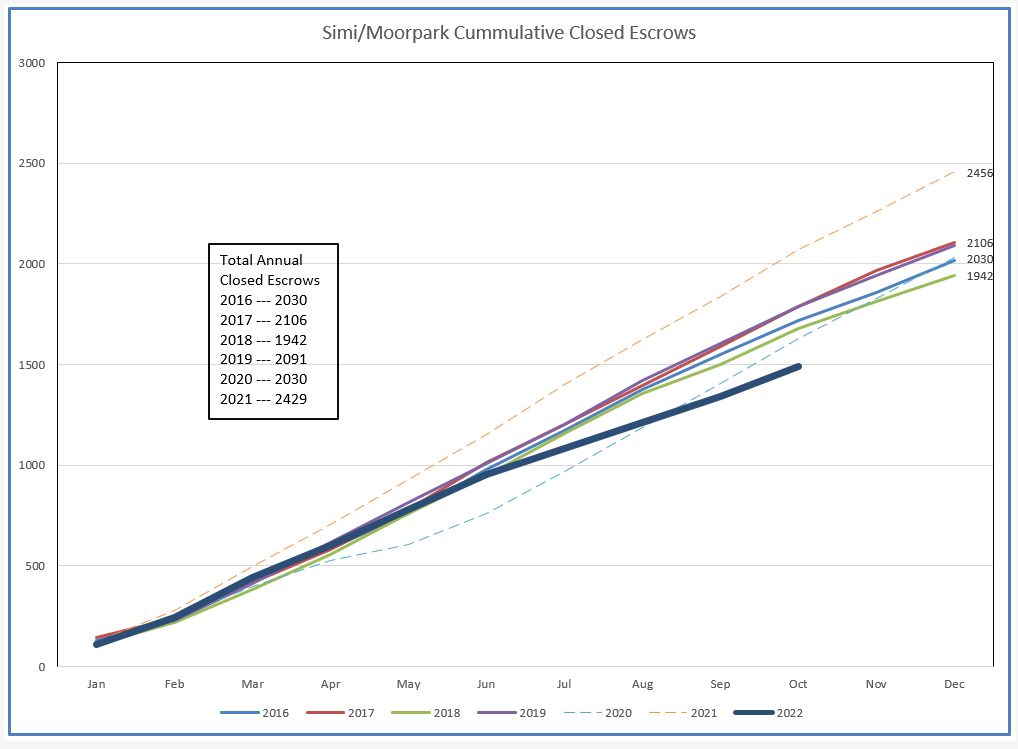
Below is the closed escrow cumulative chart for Simi/Moorpark.
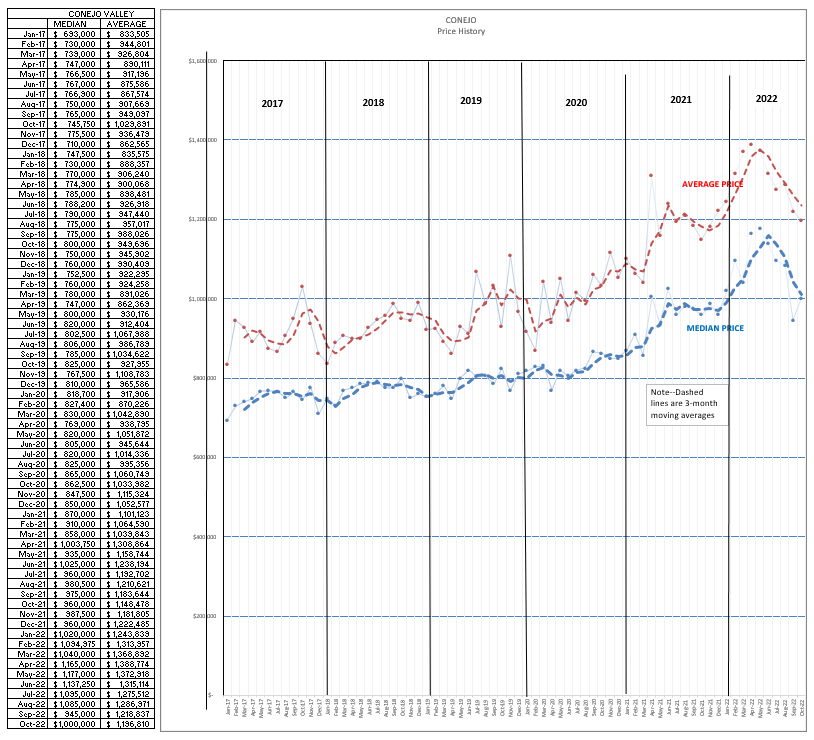
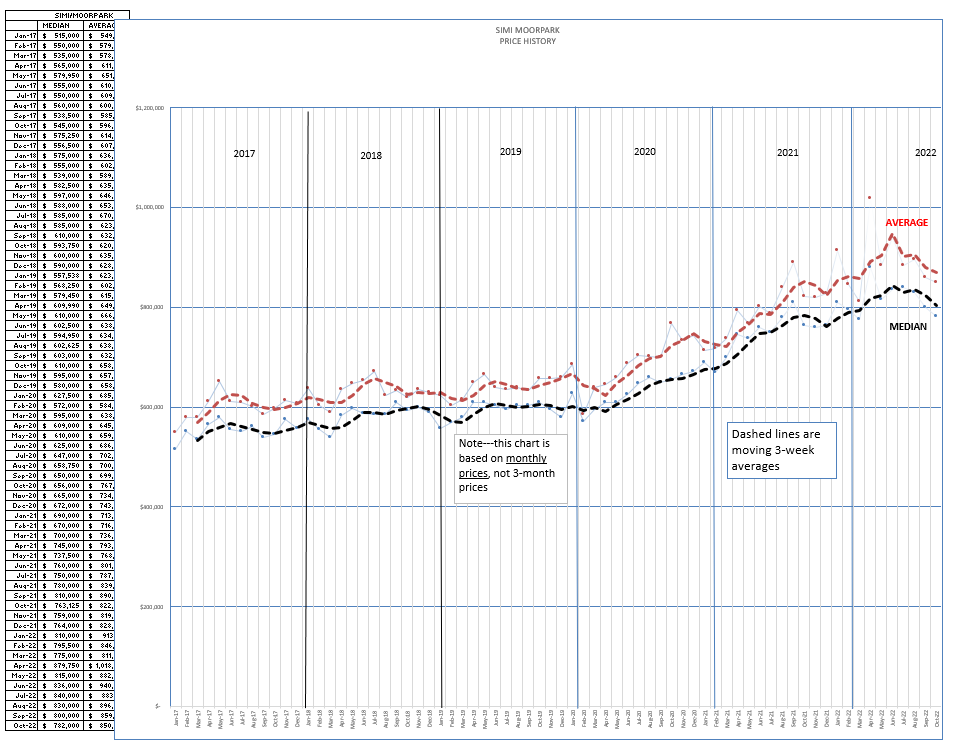
And finally, prices. This is probably what everyone is most interested in, particularly your clients. There are some new tools, that can help you provide that information to them. But first, let’s look at the graphs. This graph does not utilize the 3-month figures, but instead uses the one month average. It is obvious prices are dipping.
Simi Valley/Moorpark has the same picture.
So there you have the latest statistics. But these are average for the two main valleys of concern to us. Your clients are interested in their home value, and the home that sold just down the block.
There are some new, excellent tools to make it easier for you to do your own research, and drill down from the Federal and State Figures that get so much publicity.
Two impressive tools are available from from our C.A.R economists, One is an Interest Rate Tool that explains the effects of increasing mortgage rates on payments and affordability. There is a whole series of interactive tools that lets you use all the data that C.A.R. economists have and drill down to local statistics. https://www.car.org/en/marketdata/interactive
The third tool is the new STATS Button in the MLS. Excellent analytics, done with you in mind. Just do your area search and click on STATS in the upper right hand corner and a full range of statistics is available for you to share with your clients.
Stay safe out there. Get those flu shots and stay healthy.
Chuck