How is the market?
It depends.
Are you are homeowner? Or are you a Realtor?
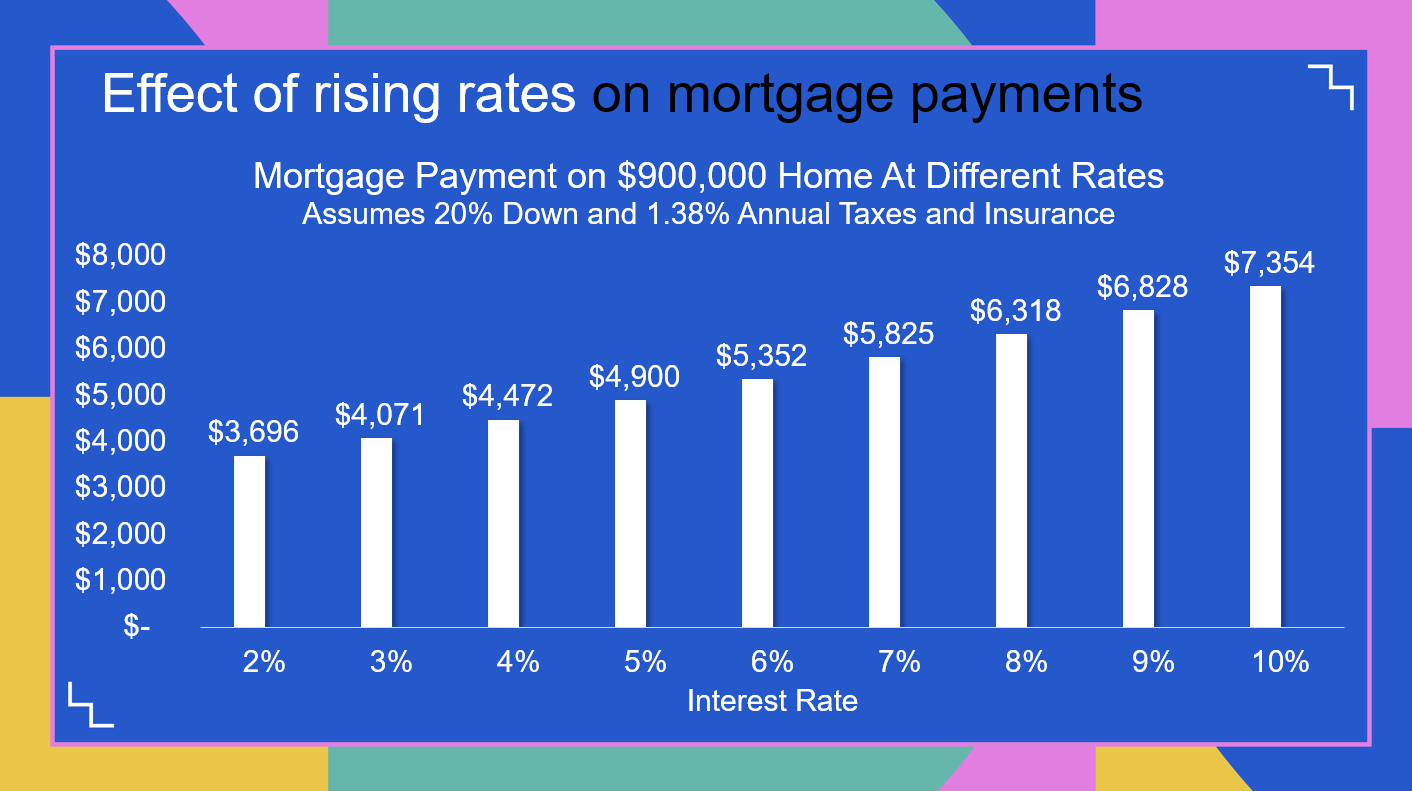
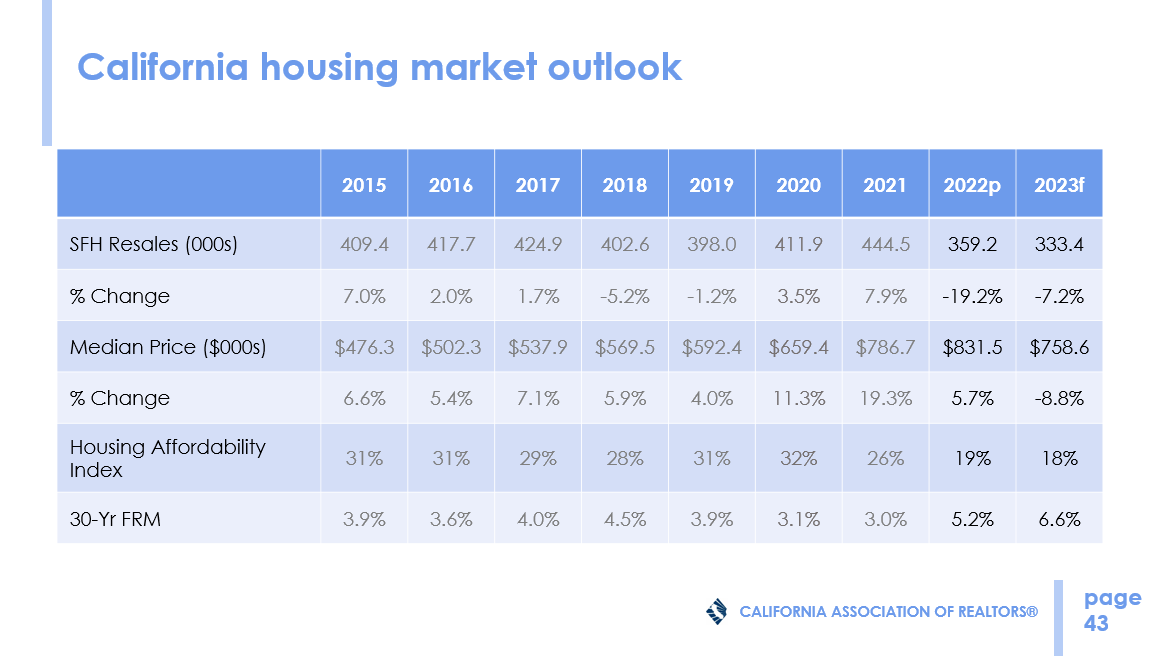
I have documented our market information mainly to pass on to your clients. Everyone is interested in how prices are going and how sales are going. We are all interested in the changes to mortgage interest rates. Interest rates have a great deal to do with affordability. The lower the rates, the more house buyers can afford. The higher the rates, buyers can still afford to buy a house, but not as big a house, not as nice a house, not as expensive a house. Our median home values are between $800,00 (SImi/Moorpark) and $1 million (Conejo). Let’s split the difference and see (thank you CAR) at how increasing mortgage rates affect affordability. With FED intervention, rates have moved from 3% earlier this year to nearly 7% currently, with the FED probably raising rates again in December.
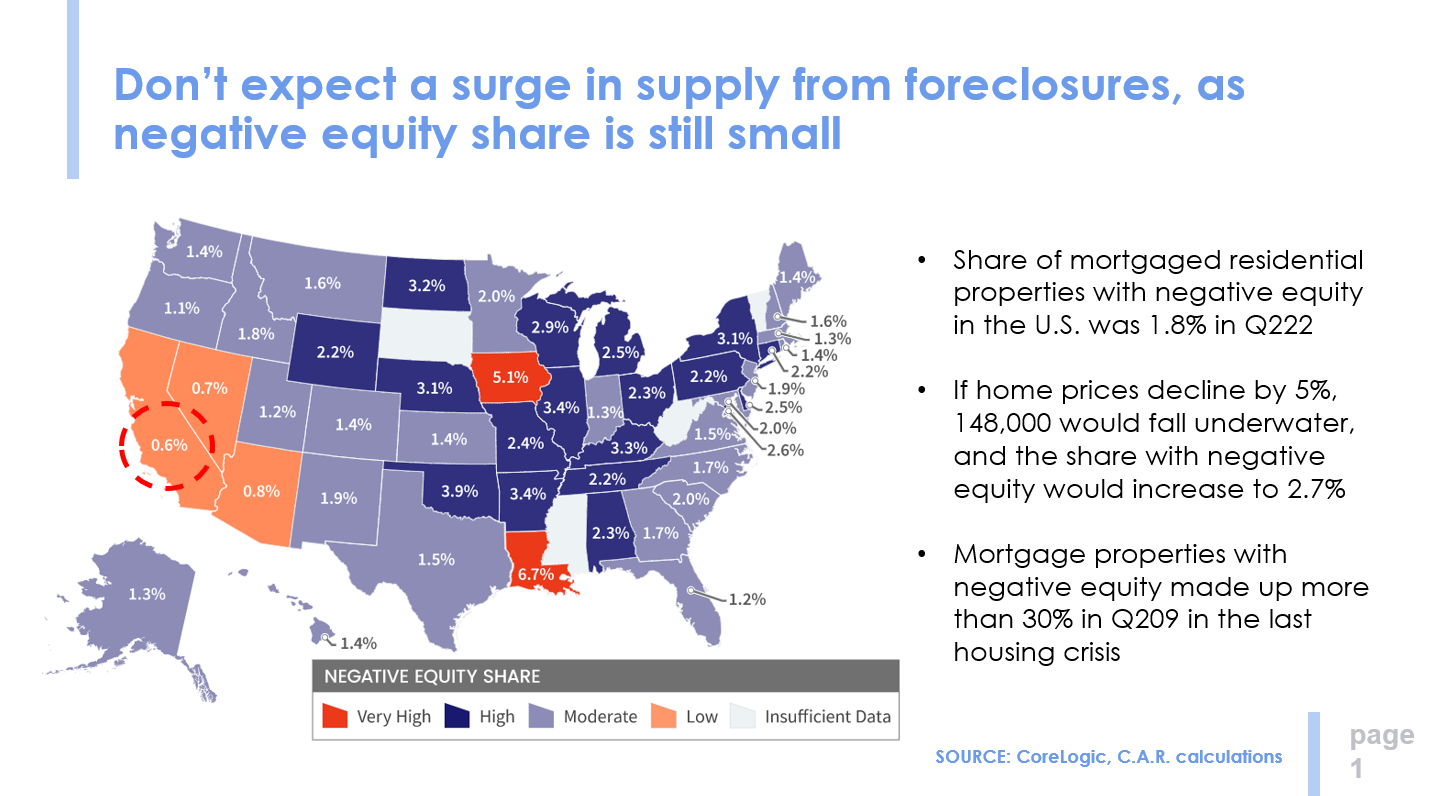
The Chicken Little contingent has been suggesting that the market and home prices will crash, similar to 2008. There are a couple of very sound reasons why this will not take place. In 2008, low teaser mortgage rates required refinancing within 2-5 years. As rates increased, owners were forced to basically either abandon their properties to the banks or face foreclosure. They did not have equity in their homes, meaning there was nothing to protect. With negative equity, walking away was easy. Not so today.
I want to borrow some information from CAR economists Jordan Levine and Oscar Wei. They have been providing a lot of information that is helpful to understand what is happening.
For example, I stated that today’s homeowners don’t need to sell. In 2008, that is what caused inventory to skyrocket.
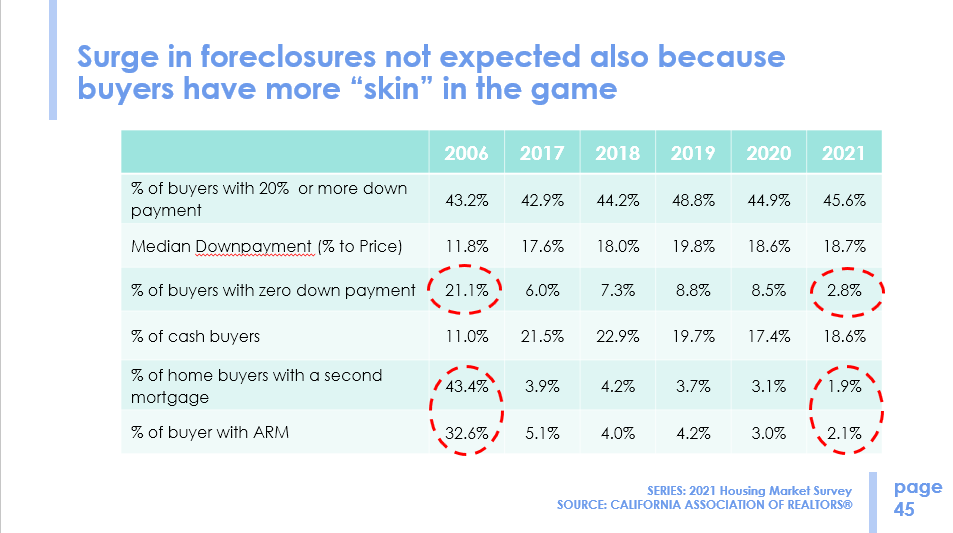
The 2008 experience of short term, variable, anybody-can-qualify-for-a-mortgage has been replaced by 20% down, 30-year fixed mortgages. Homeowners have stability and equity, low interest rates, only one mortgage (no second) and no need to re-finance.
Will home sales completely come to a grinding halt? No. There are many reasons why sellers decide to sell. Below is information from the NAR 2021 Seller Profile report:
Home Sellers and Their Selling Experience
- The typical home seller was 60 years old, an increase from 56 last year.
- For all sellers, the most commonly cited reason for selling their home was the desire to move closer to friends and family (21%), moving due to retirement (11%), or the neighborhood has become less desirable (11%).
- Sellers typically lived in their home for 10 years before selling. This is an increase from eight years in last year’s report, but reverts back to the same tenure seen in 2019 and 2020.
- 41% of sellers traded up to a larger home and 32% purchased the same size home.
- 86% of home sellers worked with a real estate agent to sell their home, 10% sold via FSBO, and less than 1% sold via iBuyer.
- For recently sold homes, the final sales price was a median of 100% of the final listing price, the highest recorded since 2002.
- Recently sold homes were on the market for a median of two weeks, an increase from one week last year.
There are many reasons why sellers list their homes. A couple not listed above were due to death and divorce. Unfortunately, life happens, and those remain reasons to sell.
The market will slow down, but not screech to a halt. The precarious financial position of newer buyers in 2008 are not a major concern today. People will not lose homes in droves, REOs will not become the majority of sellers. But supply and demand will cause prices to slip, and have already done so.
INVENTORY
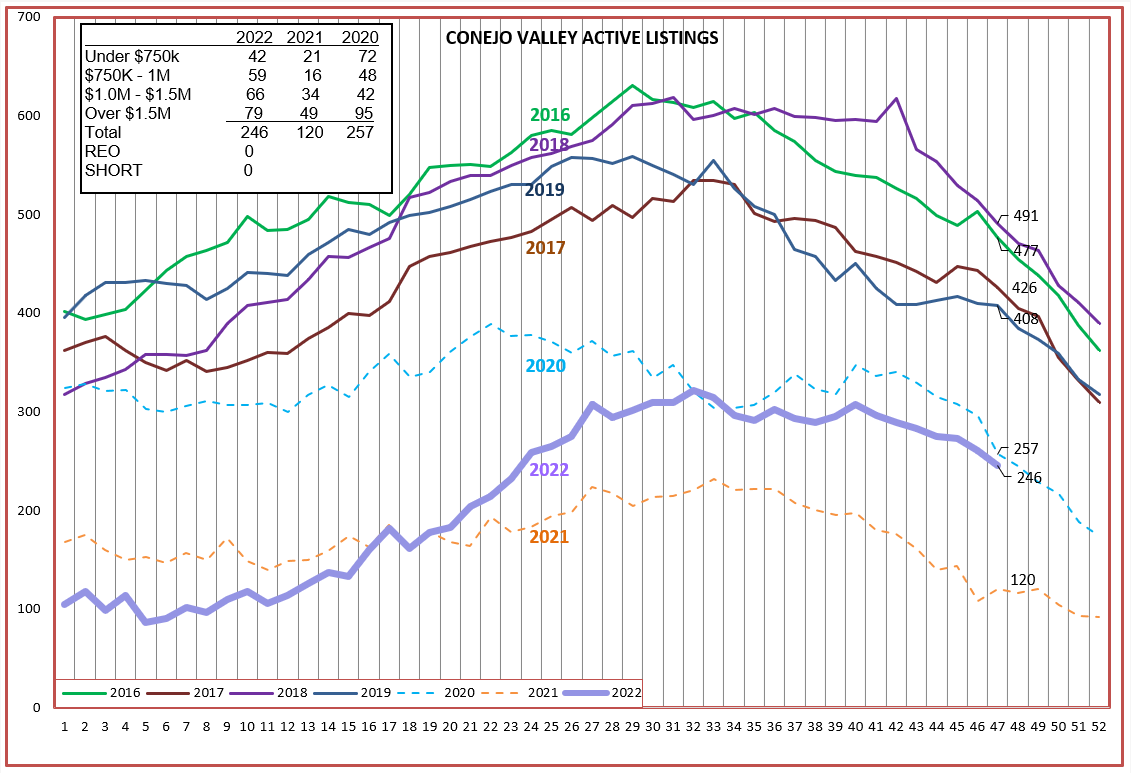
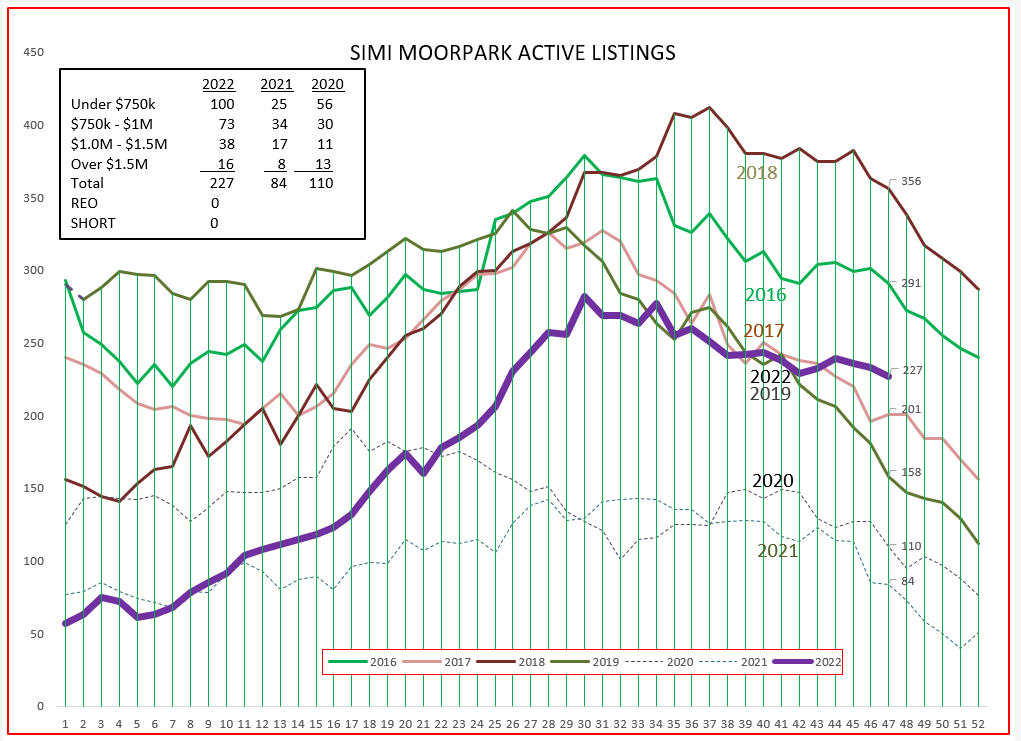
The purple line below seems to represent a normal year. It is lower than the years 2016-2019, but it follows along the same curve. Start the year low, increase inventory going into the summer, recede as we head into the end of the year. The dashed lines of 2020 and 2021 were abnormal, what we experienced during the COVID pandemic. Interest rates have doubled from rates available at the beginning of the year, and that has stifled sales as affordability plunged. But the good news is we have not seen inventory climb significantly, as it did in 2008. MOST HOMEOWNERS DO NOT HAVE TO SELL THEIR HOMES. In the box within the chart, you can see that REOs and Short Sales are currently non-existent.
For Simi Valley and Moorpark, inventory has built a little more. REOs and Short Sales are currently non-existent. Simi/Moorpark inventory was ridiculously low for 2020 and 2021, part of the reason why this chart may show a stronger build of inventory compared to the “normal market” curve,
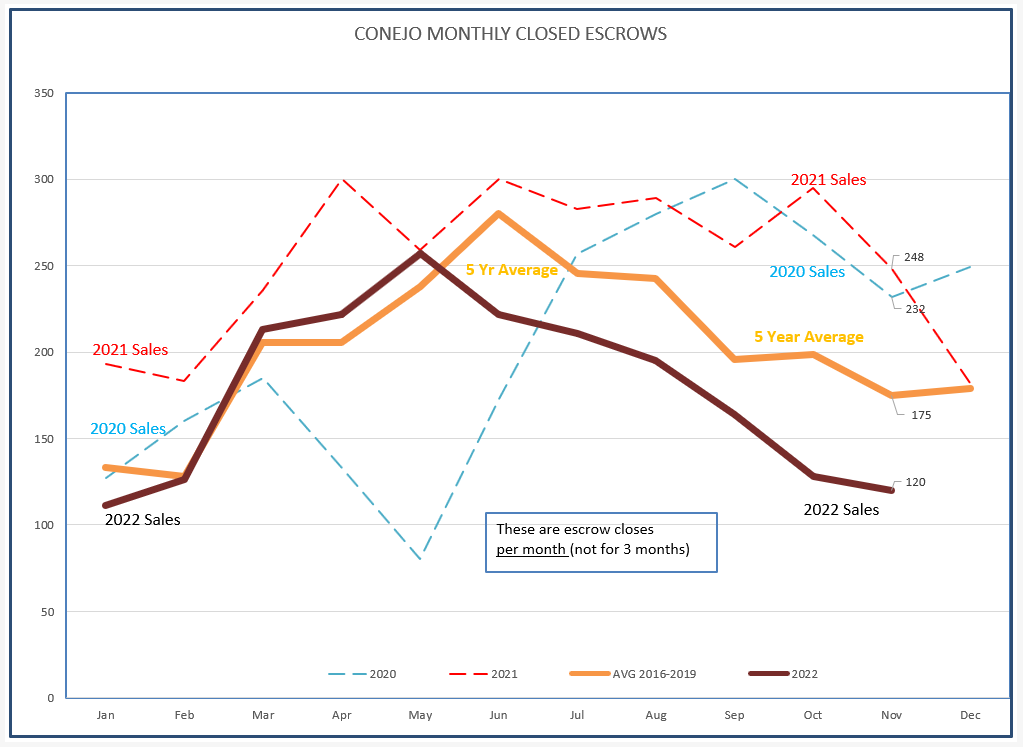
Is the buildup in inventory the result of sales slipping? Yes. The normal sales number at this time of the year, based on a five-year average in non-covid years, is 175 units. Last month Conejo had 120 sales.
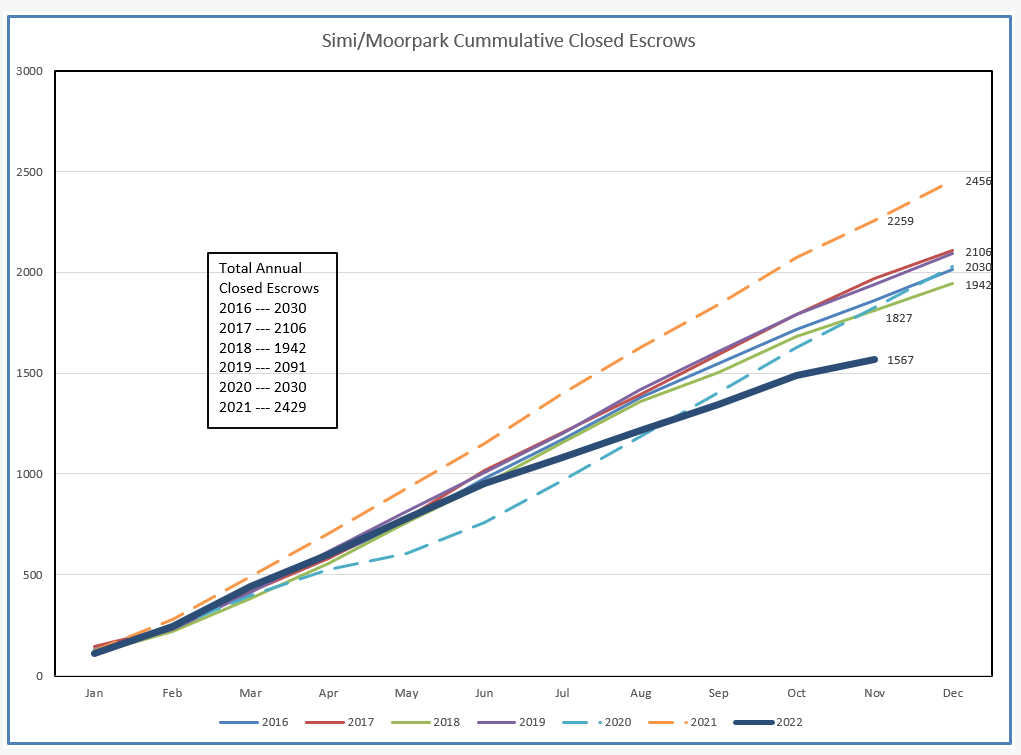
CLOSED ESCROWS (SALES)
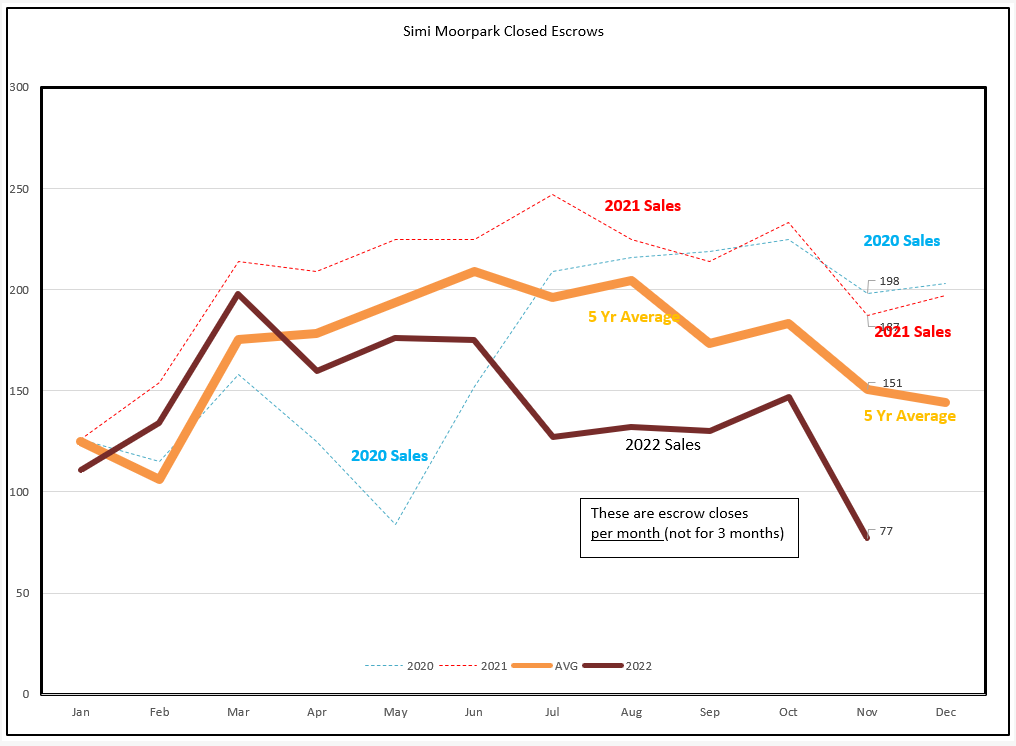
Simi Valley/Moorpark experienced a little bump in sales last month, followed by a bigger drop in November. The average of non-covid sales for November is 151, but November 2022 only saw 77 sales.
Looking at sales a little differently, let’s see how total sales have been accumulating for the year as we approach year end. As interest rate increases began mid-year, you can see how sales are flattening. and affecting how we will end the year.
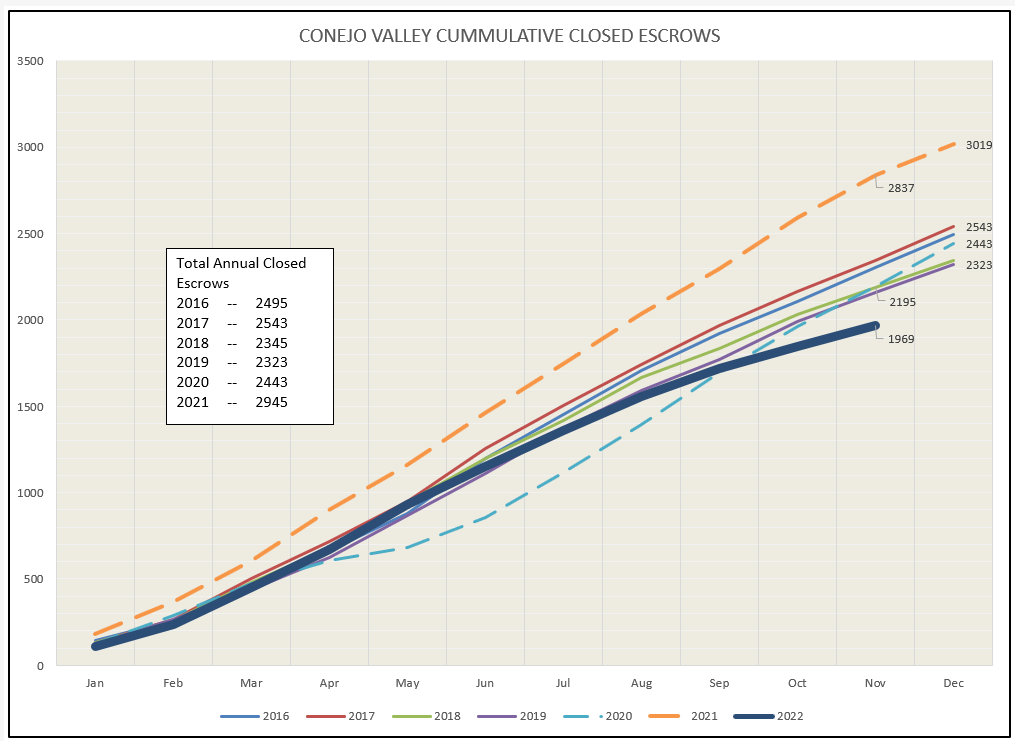
The sales dip in Simi/Moorpark is even more pronounced.
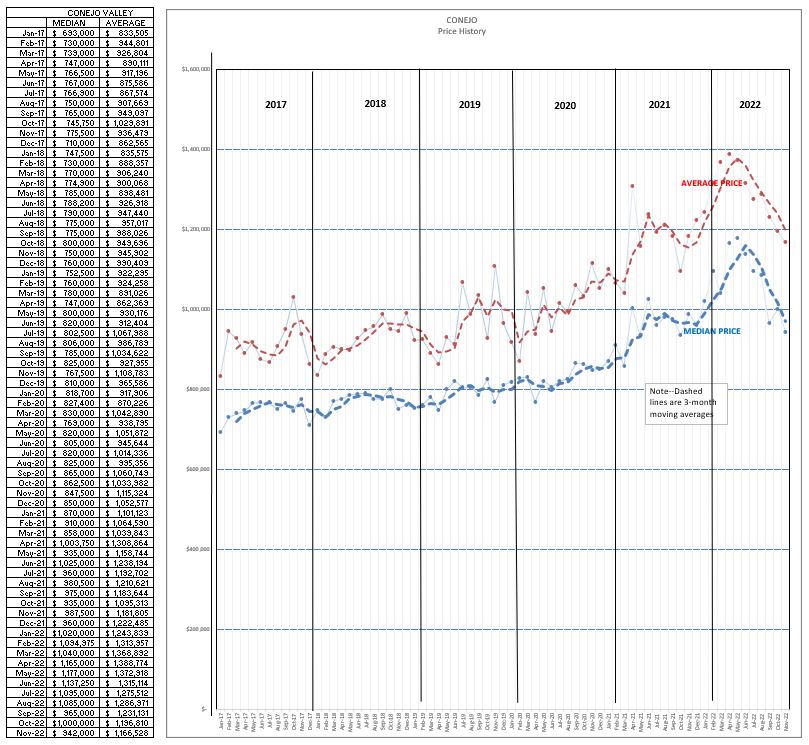
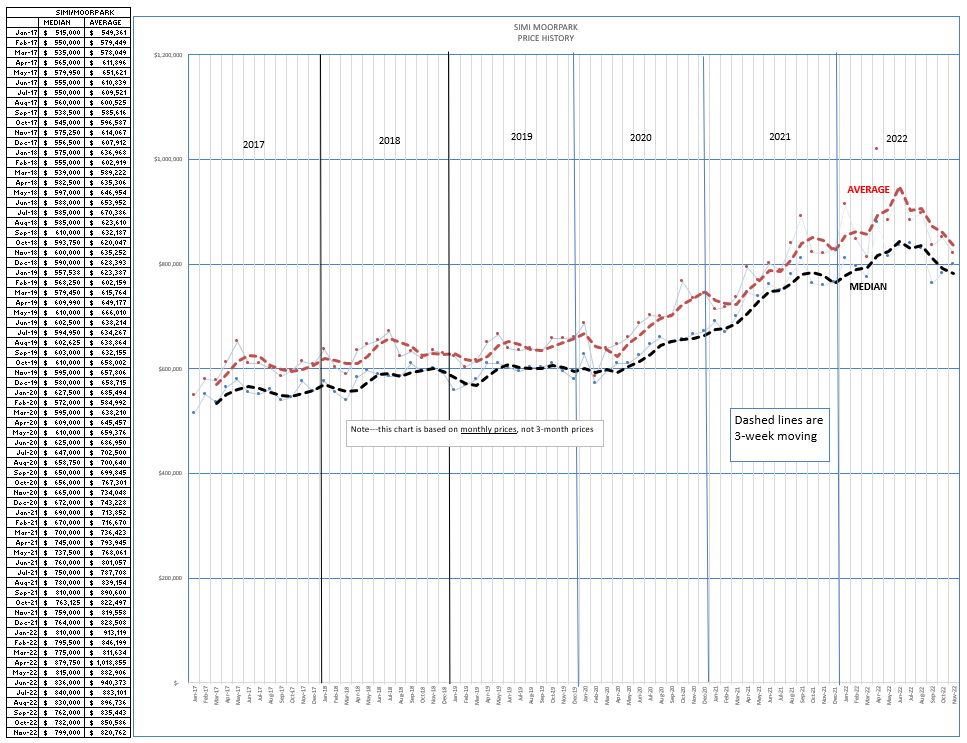
PRICES
Supply and Demand works. Some call it a law, others a theory. Whichever, it works. Prices have been receding.
In the Conejo Valley, prices peaked just about mid-year, and have been dropping since summer. The summer median price was around $1.1 million, and we now have a median just below $1 million. Let’s call it a 10% drop. But prices at the end of the year are equivalent to prices at the beginning of the year, so if you are using that measurement, prices are the same. They have not dropped. Prices during the year rose 10%, then they dropped 10%.
For SImi/Moorpark, the summer Median price of about $830,000 has fallen to currently around $780,000, a drop of about 5%. Again, if you are comparing prices from the end of 2021 to the end of 2022, prices are the same. Depending on the yardstick you are using, prices have not dropped, they remain the same. Prices during the year rose 5%, then dropped 5%.
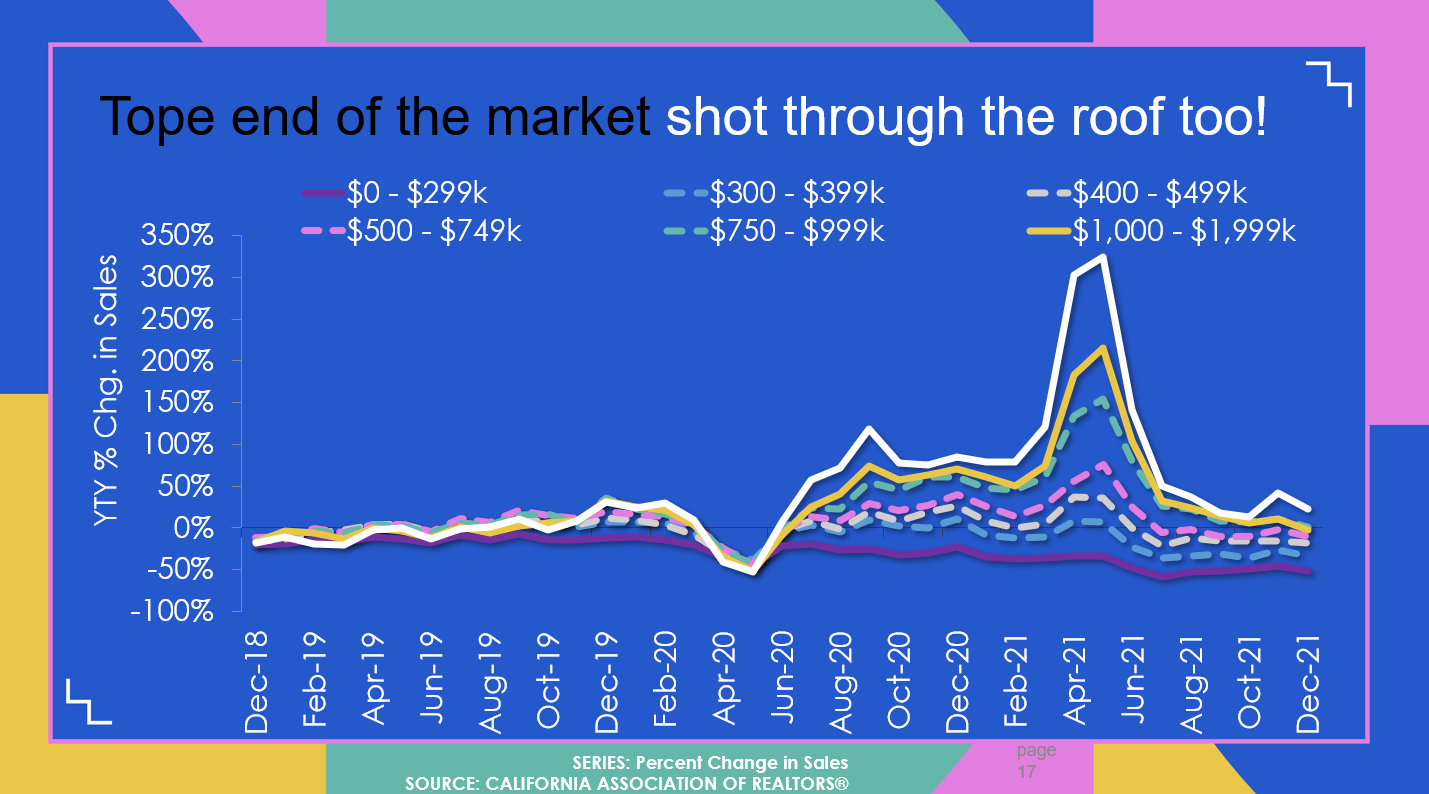
The difference in the 2022 percentage of price increase and price drop between Conejo and Simi/Moorpark has to do with the the mix of price categories. Conejo has a much wider range of price categories than Simi/Moorpark. Looking again at CAR information, the higher end of the market experienced the highest increase in price. The opposite is now occurring.
What can we expect as prices change during this FED-induced market declines? CAR economists Jordan Levine and Oscar Wei are suggesting the following in their forecast. The number of sales will decrease, with 2022 coming in19% lower than 2021, and a further decrease of 7.2% in 2023. 2023 is forecast to have a two-year difference of 25% fewer sales compared to 2021. That may not be important to every homeowner, but it is very important to Realtors. The number of closed transactions will be 25% lower. That is very important for your business planning purposes.
The median price was steadily increasing in our valleys during the first half of the year, but the end of year price is pretty much equal to prices at the beginning of the year, wiping out the increases in the first half of 2022 with similar decreases in the second half of 2022. CAR is forecasting a drop of 8.8% for 2023. While that may sound bad, when compared to the 40% run-up of prices from 2019-2022, it is an expected adjustment in prices. This is not 2008, when prices dropped between 35-40%. Prices have already dropped from the peak experienced this summer. However, they ended the year at the same level as they began the year. A further 8.8% decrease is the forecast for 2023.
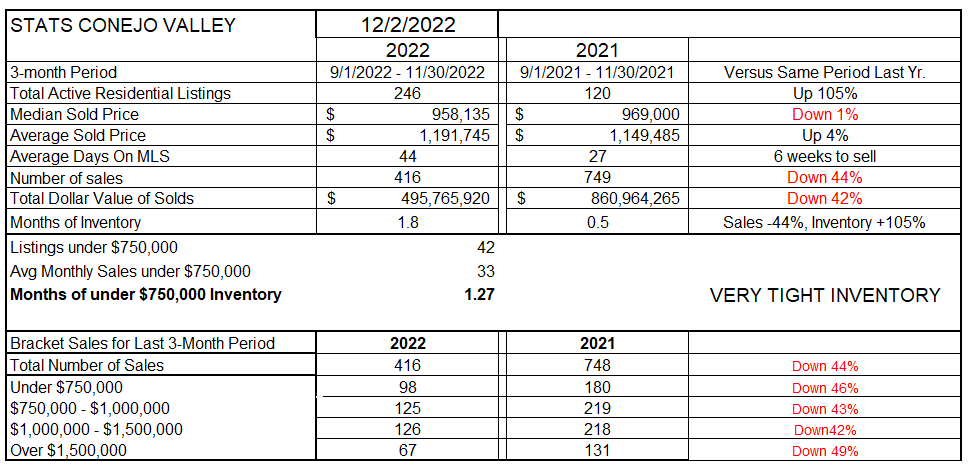
Finally, lets look at the table I have been using for many years now. It presents the market in a little different light, due to the fact that I have historically used a three-month average to even out monthly statistical swings. The inventory is double what it was last year. This table shows Median prices down 1%, Average prices up 4%. Let’s call it even by the end of the year. The number of sales are down 44% from a year ago. (average of last three months versus the same three months a year ago). Notice the bottom of the chart. The price category with the highest decline in the number of sales is the highest price group, properties over $1.5 million. All categories are down.
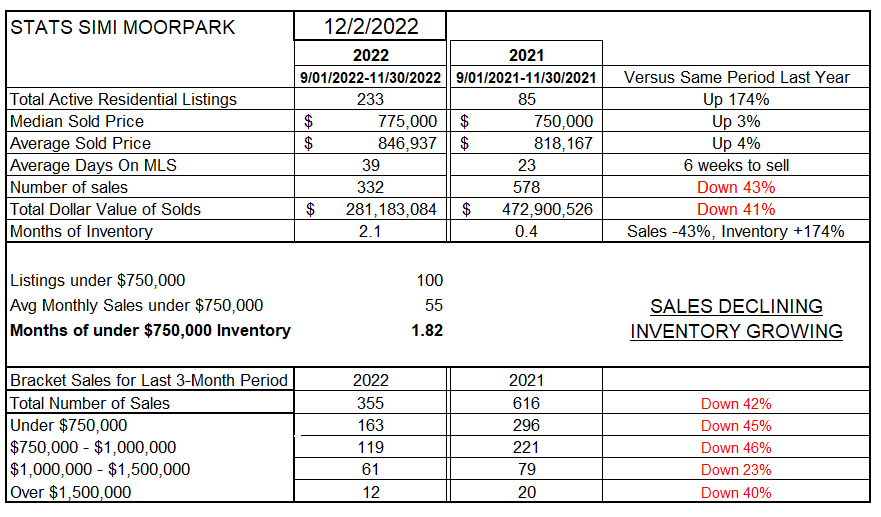
For Simi/Moorpark, the inventory is almost triple the anemic inventory last year. Prices still show up 3-4%, but are trending downward. We should finish the year with prices even with what they began the year. The number of sales is down 43% versus the activity at the end of 2021, similar to the decrease in Conejo. Simi/Moorpark does not have the range of inventory prices that Conejo enjoys, but it seems the homes priced above $1 million are still more attractive.
So the good news is that both homeowners and realtors have had a couple of really great years.
The new reality is that the Federal Reserve wants to control inflation, and that is temporarily putting the housing market under pressure. There are a variety of estimates of how long this will last, but most economists seem to think by the end of next year things will again be better. Keep paying attention to what the FED is doing. They are in charge, and what they do will decide how and when things turn around. The FED are not the bad guys. Over the past few years, their purchase of high quantities of Mortgage Backed Securities have caused mortgage interest rates to be very attractive to buyers, probably lower than they would be if it were not for FED intervention. Then they stopped buying these securities, and started raising rates to deal with inflation. Right or wrong, they have enormous power.
We just enjoyed Thanksgiving, and we have had a lot to be grateful for. The end of year holidays, Hanukkah, Christmas, and New Years are upon us. We have a great deal to be thankful for.
Stay safe, stay well, Happy Hanukkah and Merry Christmas and Happy New Year.
Chuck