Mortgage rates have doubled since last summer. Buyer are finding themselves limited as to what they can afford. You would think that 1) sales would decline, 2) prices would decline, and 3) inventory would rise.
How does what should be happening compare to what is happening?
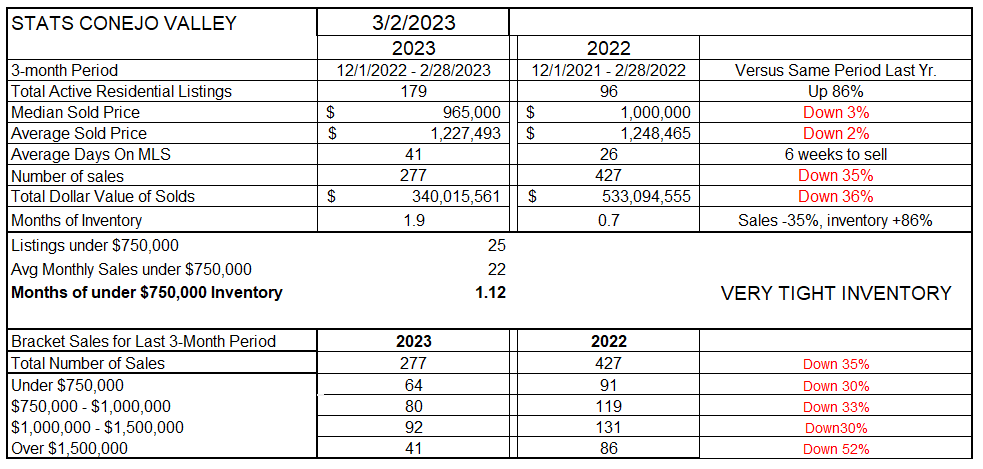
Inventory is now up, by 86% compared to last year. But don’t be misled by percentages. Last year, still affected by COVID, the inventory was so low that a large percentage increase still leaves us with a very low actual inventory number. Since the beginning of the year, inventory is declining. However, if you look at the history of listings in the early couple of months every year, the inventory consistently drops. It is too early to decide whether the current downturn in inventory is just normal or may be telling us something.
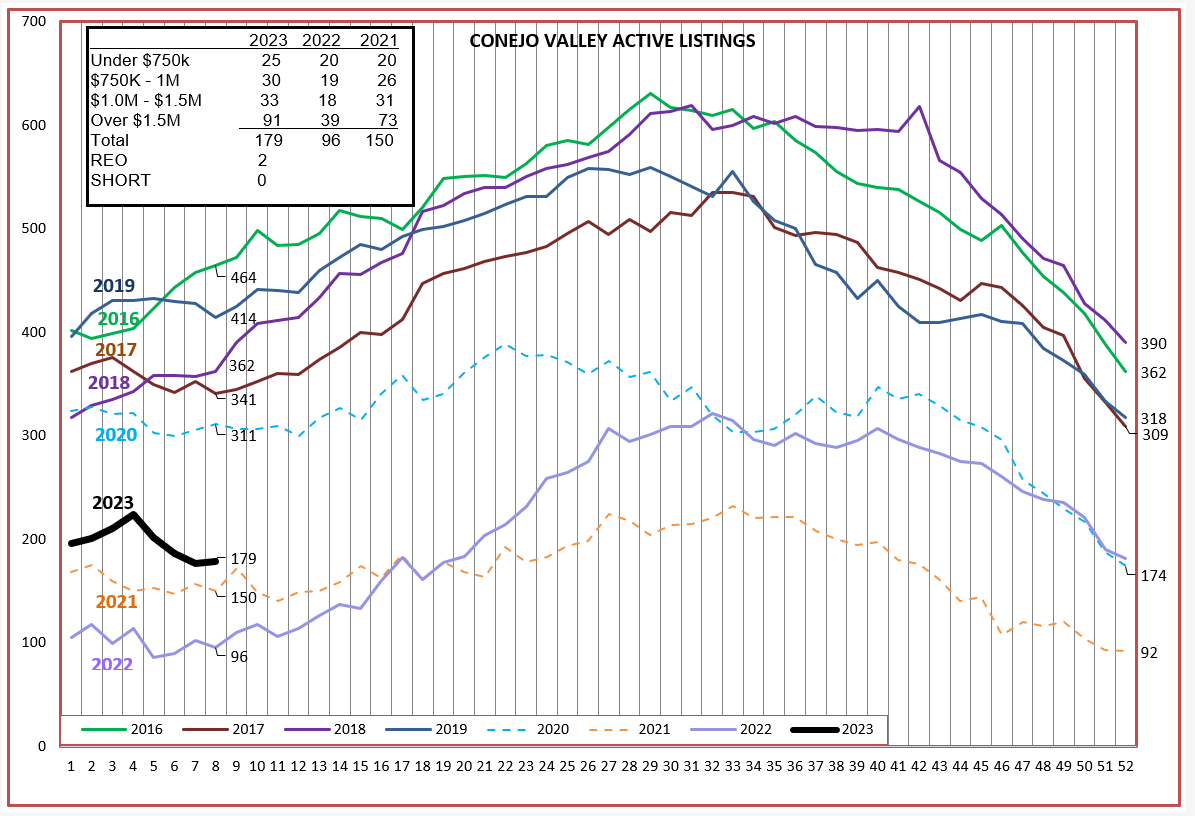
How is this influencing prices? Prices have come down compared to the same three months a year ago, now down 2-3%. According to the statistics chart, there has been a big percentage increase in inventory, and a small percentage decrease in prices. More importantly to the real estate profession is the Number of Sales—down 35% from the same three months a year ago.
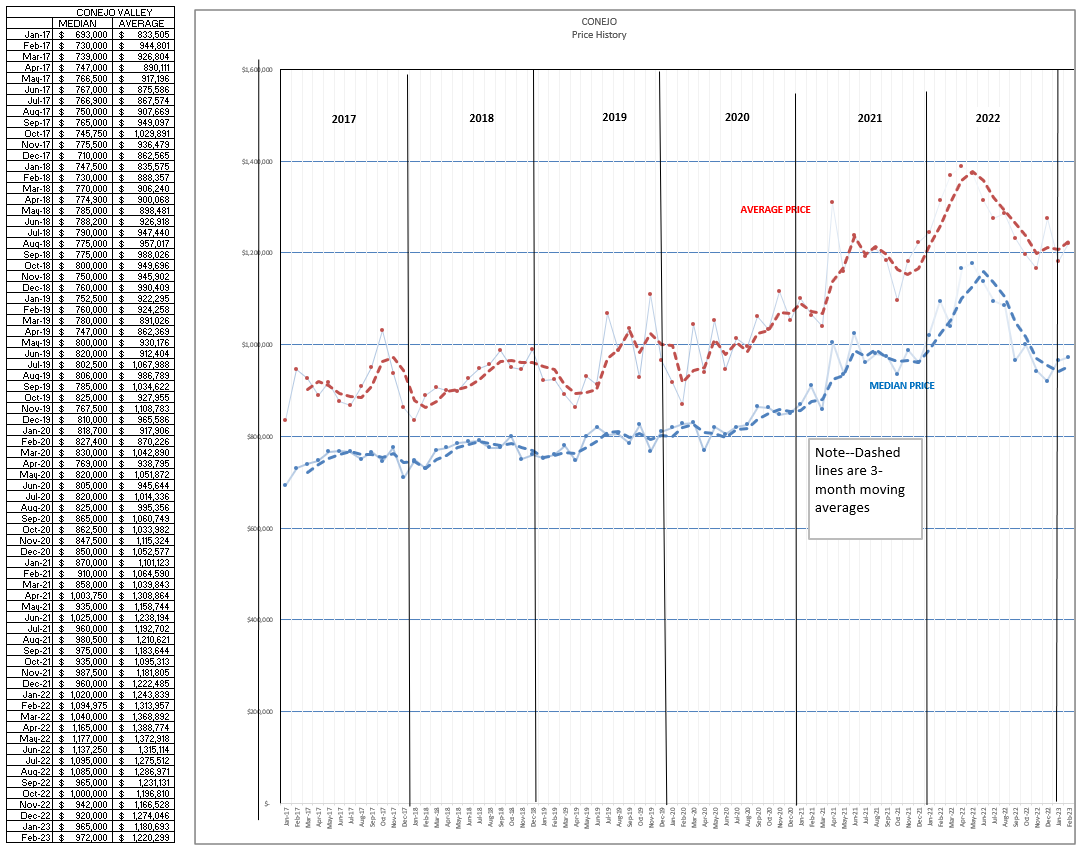
However, looking at the monthly pricing history, we get a different picture. Prices increased substantially in the early part of 2022, then declined rapidly in the second half of the year. The Conejo median price in December 2021 was $960,000, then increased to $1,177,000 (an increase of 22%) then declined in December 2022 to $920,000 (a decline of 18%). So 2022 was a real roller-coaster year for prices. Prices as we start 2023 appear to have stabilized around $960,000. The decline was caused by rising interest rates, since the middle of 2022 decline coincides with the FED beginning to dramatically increase interest rates.
Homeowners do not want to hear their home values declined 18%. But that is what they will begin to hear as this year progresses, comparing values this year to values 12 months ago. What they do want to hear is that their home value is currently pretty stable, which is what is happening now. Prices are stable compared to where they were a year ago, prices are stable based on the trend of the past few months.
For Simi Valley/Moorpark, the year-to-year shows a large percentage increase but on a very low base of only 78 listings a year ago. Prices show decreases of 7-8%. But the number of sales is down 41%.
Inventory is now way up, by 67% compared to last year. But last year’s inventory, still affected by COVID, was so low that a large percentage increase still leaves us with a very low actual inventory number compared to past non-COVID, “normal” years. Since the beginning of the year, inventory has been declining. However, if you look at the history of listings in the early couple of months every year, the inventory consistently drops. It is too early to indicate whether the current downturn in inventory is just normal or may be telling us something.
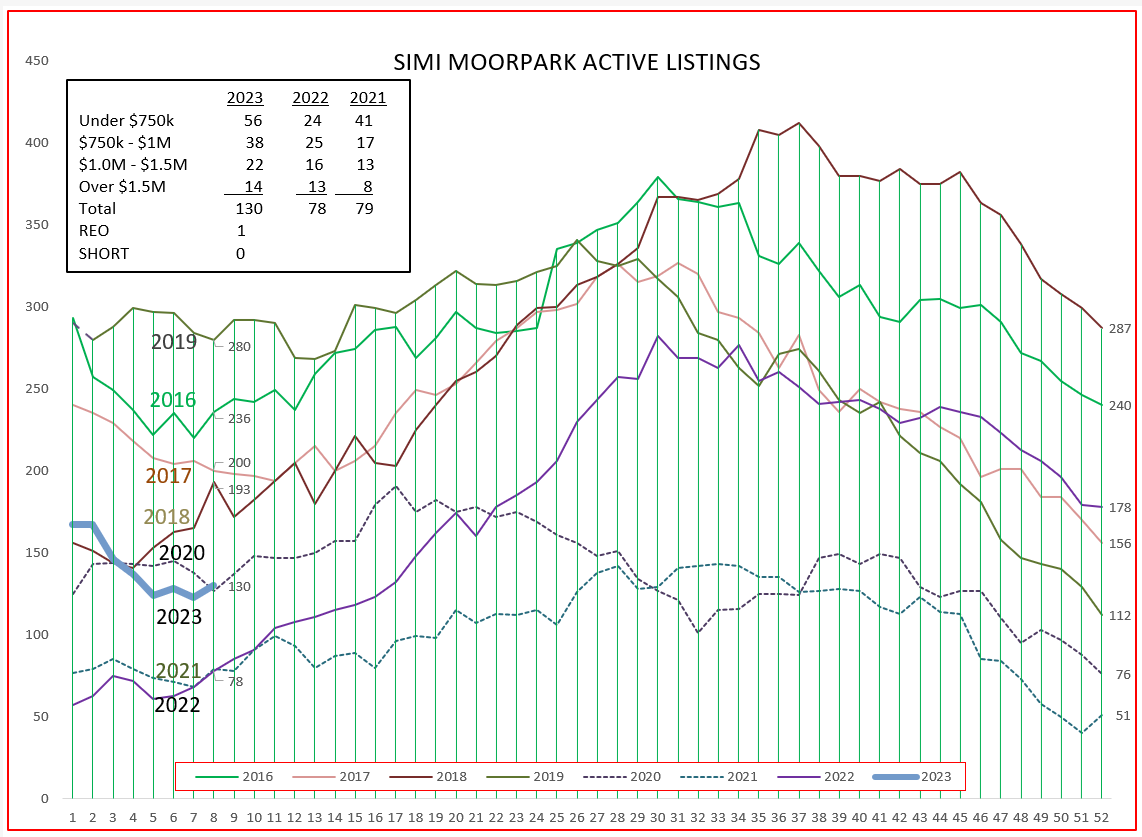
For Simi Valley and Moorpark, the statistics table shows similar numbers. Inventory is up, 67%. A large percentage but still a fairly low actual number of active listings. Prices for the past three months compared to prices for those same three month a year ago show a larger decrease, down 7-8%. But that is mostly a timing issue between Conejo and Simi/Moorpark. For our profession, the more important figure shows the Number of Sales down by 41%.
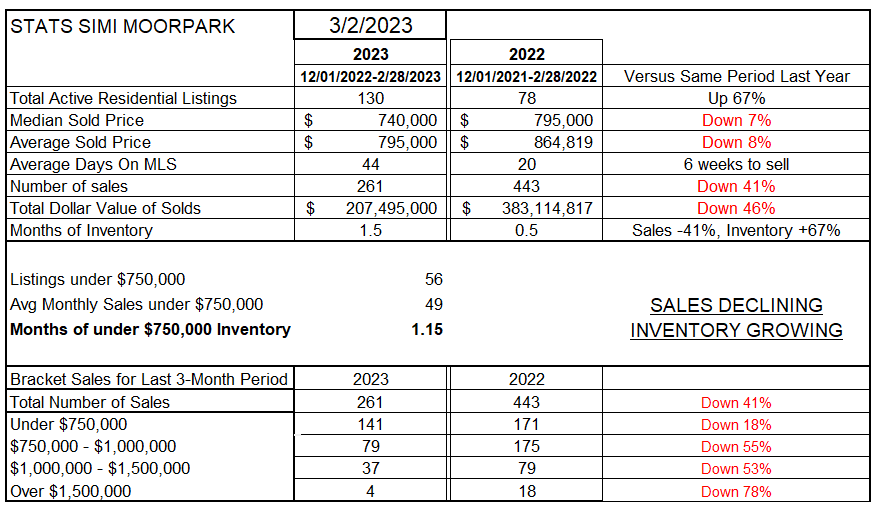
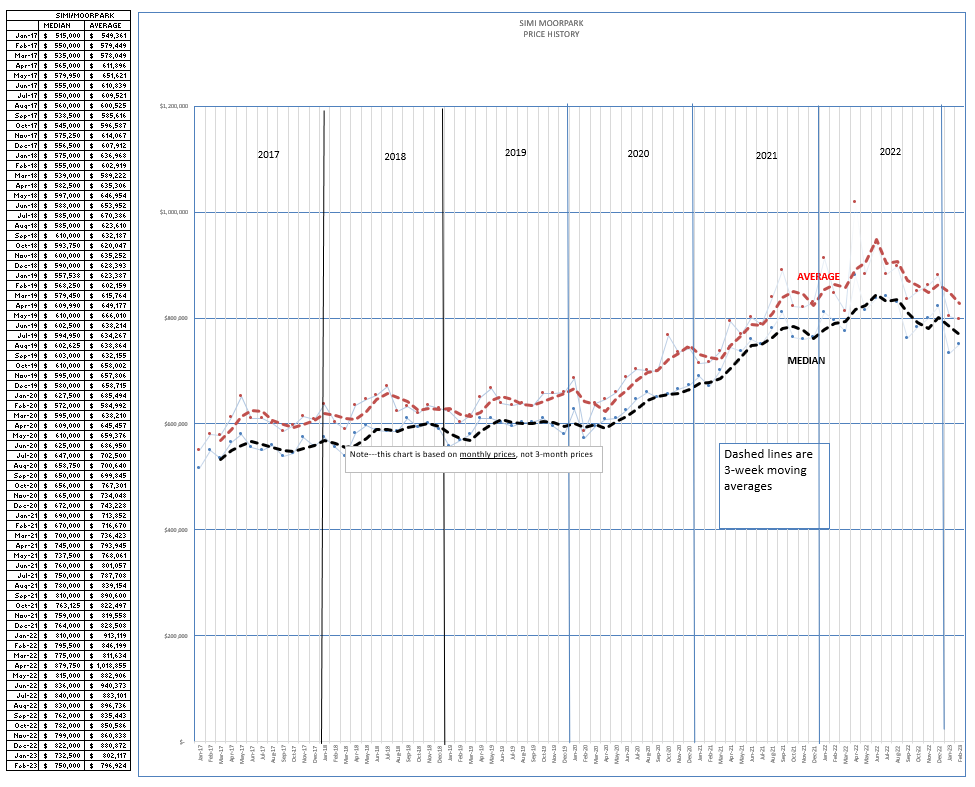
Pricing increased substantially in the early part of 2022, then declined rapidly in the second half of the year. The median price in February 2022 was $795,000, then increased to $879,000 in April (an increase of 11%) then declined in February 2023 to $750,000 (a decline of 14%). Prices as we start 2023 appear to be stabilizing around $750,000.
Homeowners do not want to hear their home values declined 14%. But that is what they will begin to hear as this year progresses, comparing values this year to values 12 months ago. What they do want to hear is that their home value is currently stabilizing. But that is not what some will be reporting, choosing instead to compare year-to-year. I believe the worst is over.
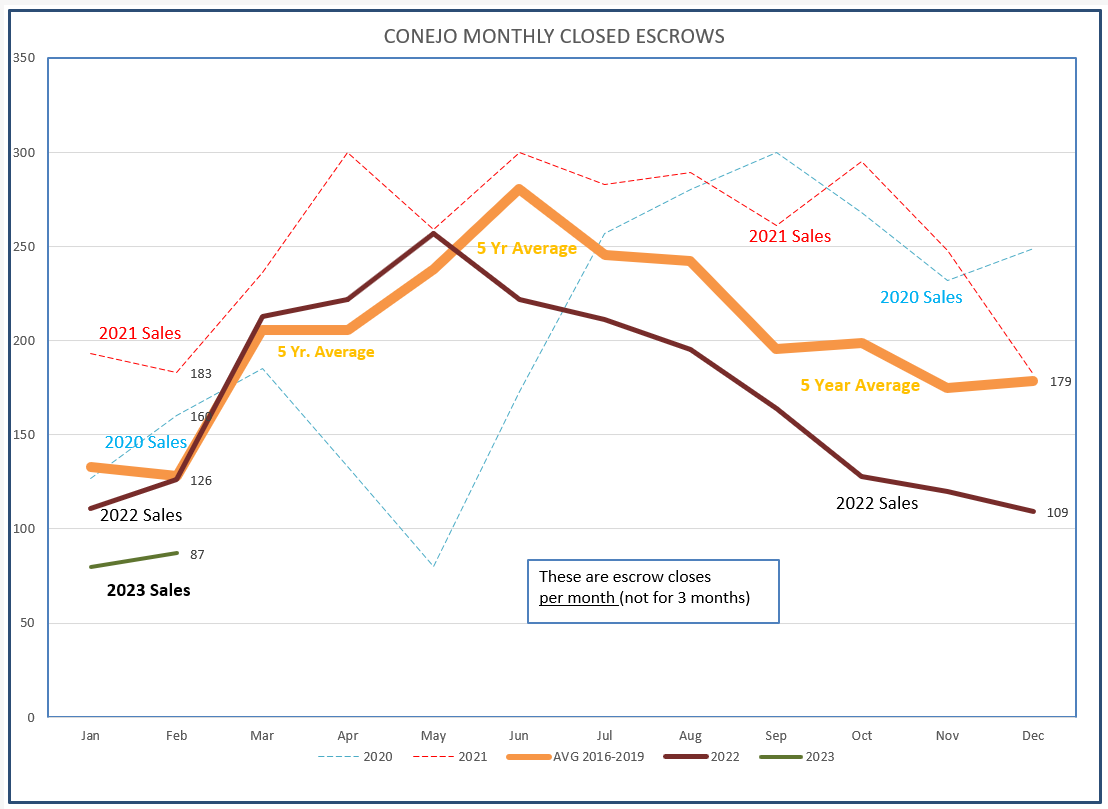
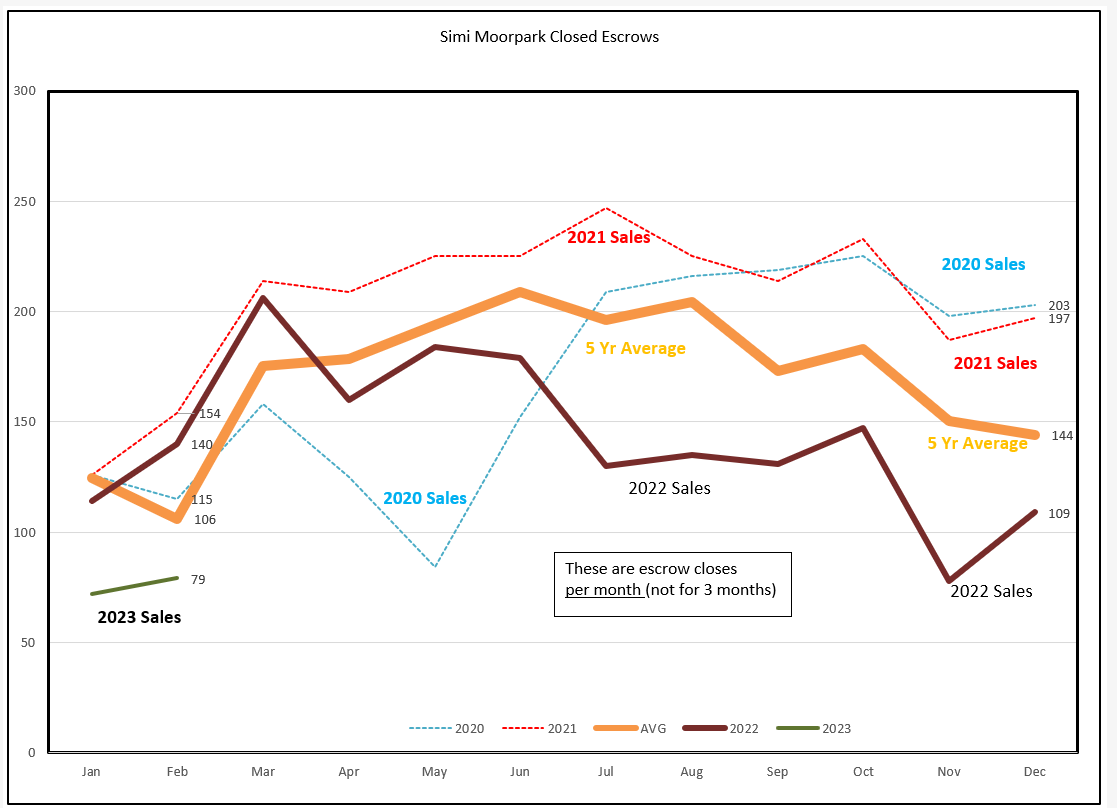
The biggest issue for our profession involves the number of sales. The 5-year average (orange) line represents normal, expected sales numbers. Sales are much lower to begin this year. Remember, these are closed sales, on contracts written up to two months ago.
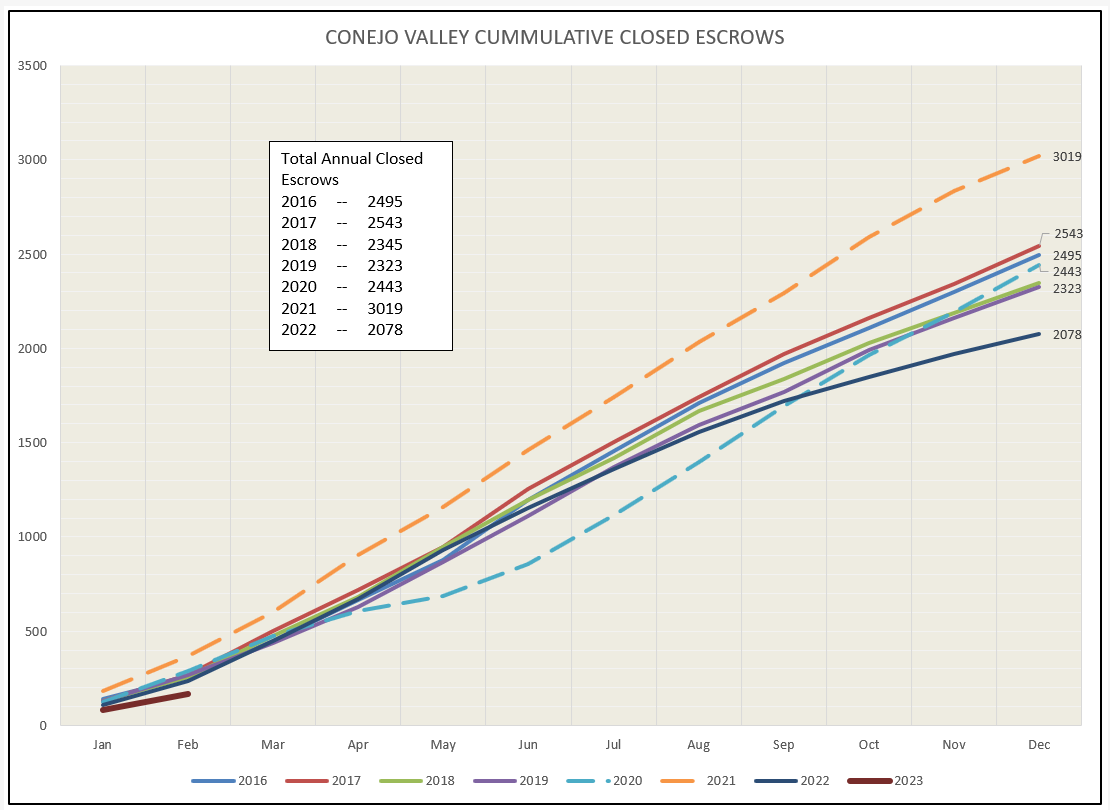
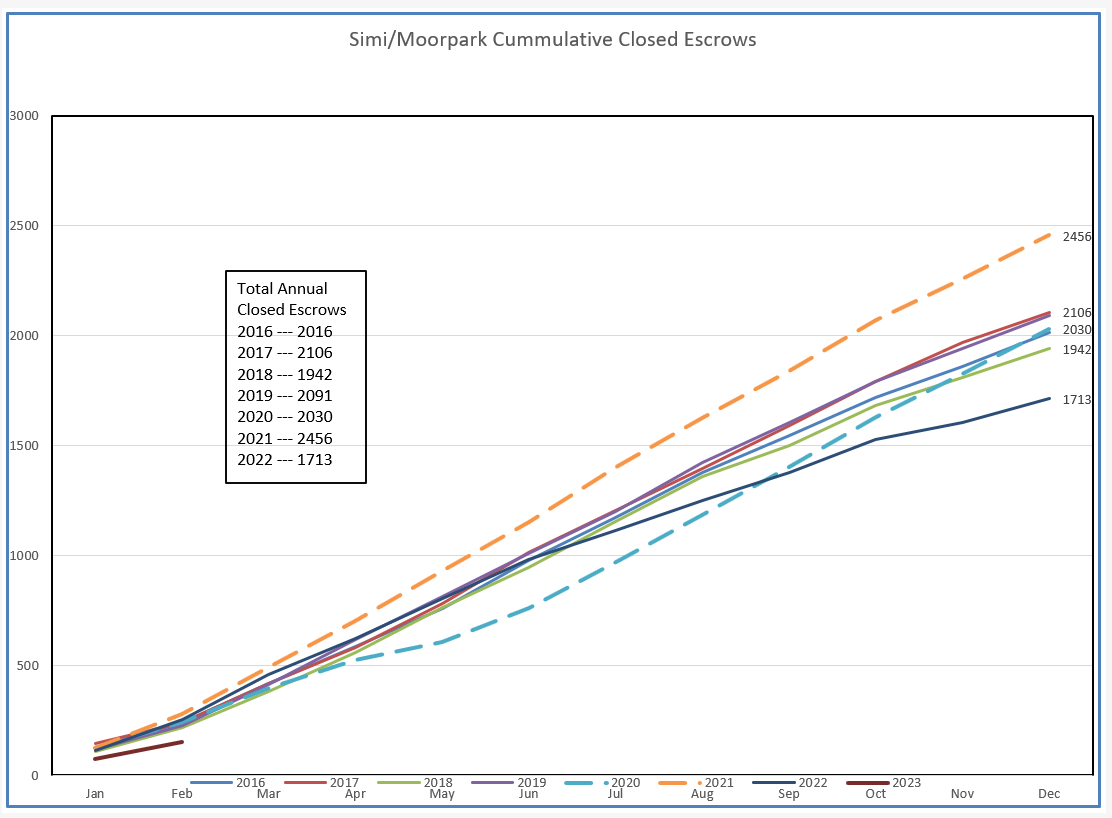
The cumulative sales chart also shows this year beginning much below the average.
For Simi Valley/Moorpark, sales show a similar low start for the year.
The Simi/Moorpark cumulative chart provided shows a similar result.
Back to the opening discussion above. Mortgage rates have doubled since last year. When buyers find it much more expensive to afford a mortgage, you would think that 1) sales would decline, 2) prices would decline, and 3) inventory would rise.
Sales have declined, between 35-41%.
Prices have declined, but they must be viewed with the spike and drop in 2022 to understand the numbers.
Inventory has risen compared to last year at this time. But is inventory going to continue to rise substantially?
I don’t believe so. With prices declining, will homeowners put their homes onto the market, or as happened in 2008, will they be forced to sell or to lose their homes to the banks?
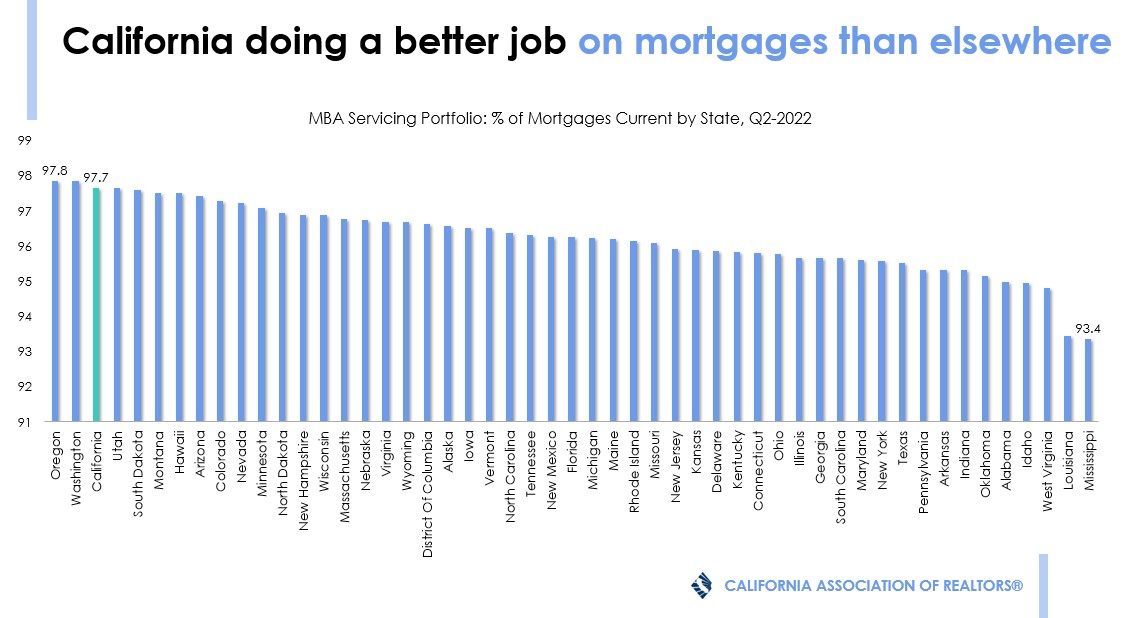
No, the foreclosure risk background today is much different than 2008. California has one of the highest percentage of owners current on their mortgage in the country.
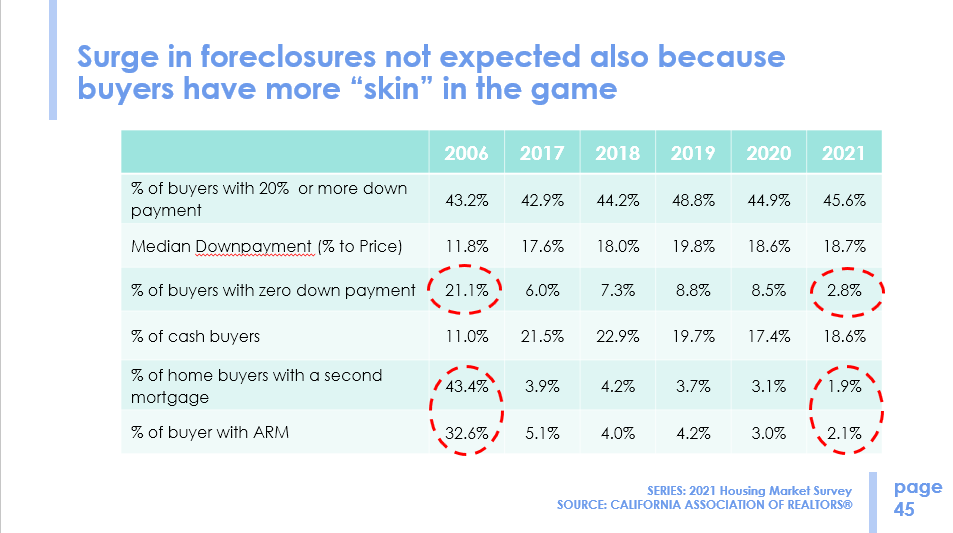
In addition, an extremely low number of homeowners have adjustable rate mortgages or second mortgages.
What factors may be keeping homeowners from putting their homes onto the market, thereby increasing the active inventory?
Some homeowners that timed it just right refinanced at 2.675%. Most refinanced around 3%. If they sell their home, they trade in that mortgage for something with a six in front of it. (Did you know that although an owner can’t take that mortgage with them, the new buyer of their home can assume their current low interest loan? For VA and FHA mortgages.)
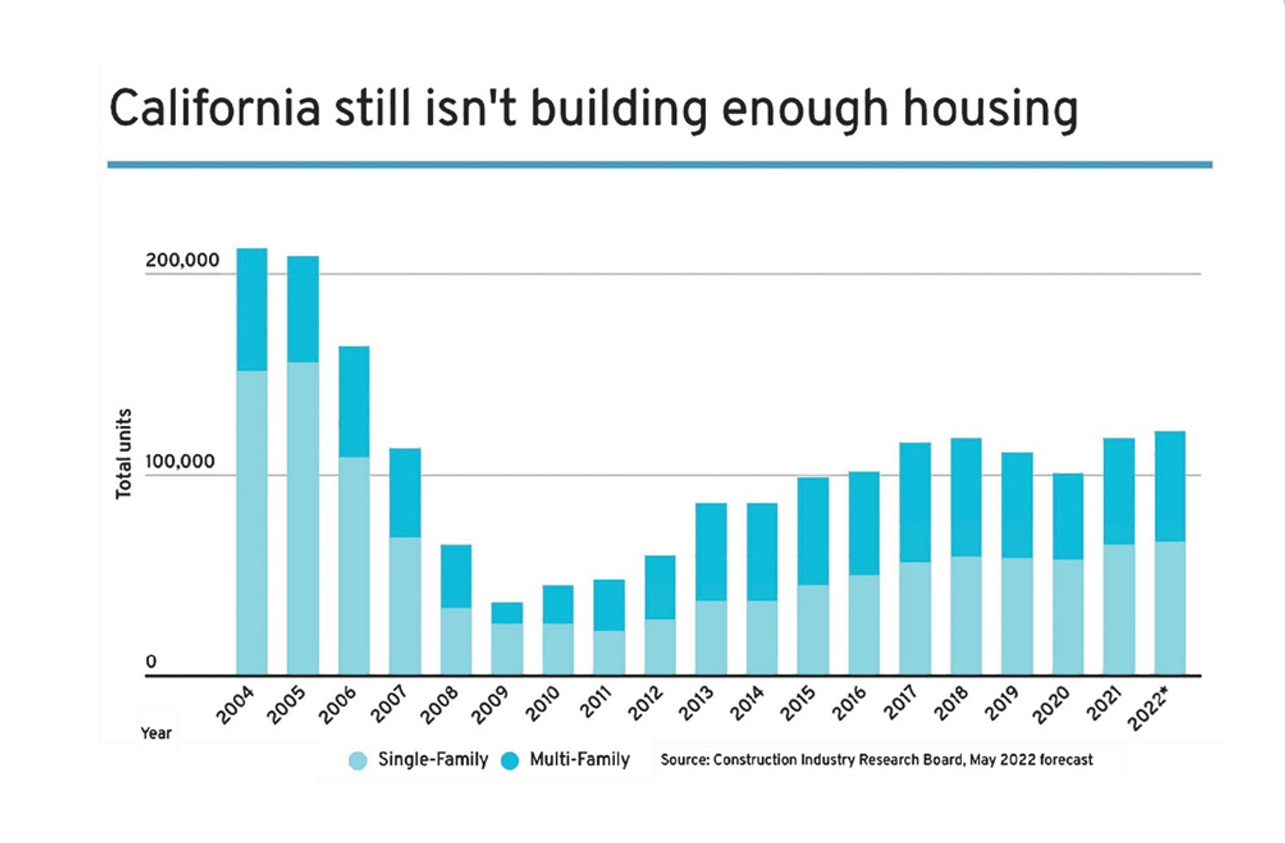
What is preventing home prices from free fall? Yep, good old supply and demand. Not just supply of active listings, but the supply of housing in general. We have a housing crisis. The number often used is that we need to create 180,000 housing units a year to keep up with our population and family unit formation. Here’s the history, and why we have a housing crisis. Way below 180,000 per year for a long time.
That is my rationale for why active inventory will not be growing out of control. The shortage of total housing is propping up prices. Homeowners will be hanging onto their homes because they have fabulously low mortgage rates. They will not be trading those homes and mortgage rates for better homes with worse mortgage rates.
There are many reasons why homes will become active. There are life changes. There are job changes. But the segment that may list their home to buy another will not participate in the market until mortgage rates come down. That will not only limit the number of new active listings coming onto the market, it will limit the total number of transaction per year.
That’s what I think. What do you think? Let me know.
Stay safe and be prosperous.
Chuck