Let’s begin this discussion with PRICES. How have they been tracking?
Remember that prices peaked in May-June 2022 after rising strongly in the beginning of 2022. After the May-June peak, prices fell back to roughly the same level that were common at the outset of 2022. Since the beginning of 2023, prices have been steady and have recently increased.
It is very common for real estate pundits to discuss the rise or fall in prices as current prices compared to last month and to last year.
Frankly, I keep away from a month-to-month comparison, there are too many factors that can change that outcome for a 30 day analysis.
A homeowner is interested in how his personal home is doing in comparison to others in the area, and month-to-month comparisons can be misleading.
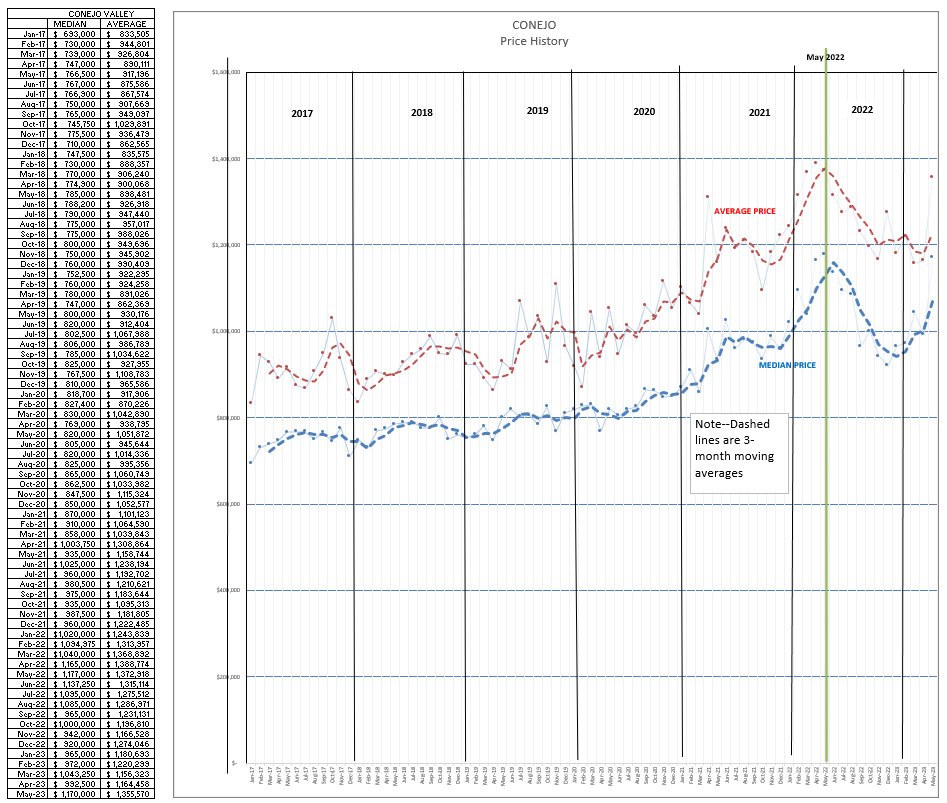
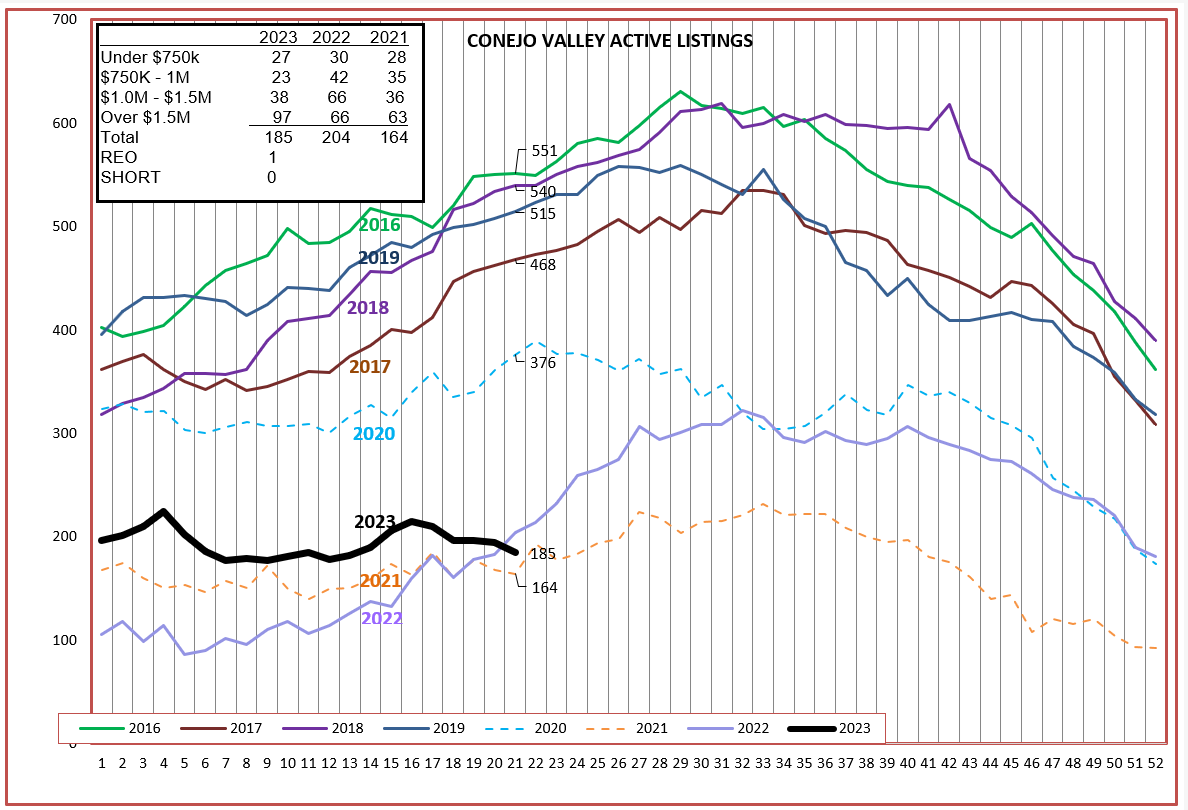
However, at this time, comparisons of year-to-year pricing can also be misleading. Let’s first look at the price chart for Conejo Valley.
Take note of the added green vertical line, which marks how prices have peaked in May-June 2022. Prices began and ended 2022 at roughly the same amount, but prices strongly rose at the beginning of the year and then rapidly fell after the May-June peak.
If we compare the current price, May 2023, to the price in May 2022, it looks as if prices have fallen dramatically. They did, but the fall took place in 2022, not in 2023. If you study the far right end of the two price lines, you can see that prices are currently on the upswing. That analysis will make homeowners much happier, and frankly more closely describes the current market reality.
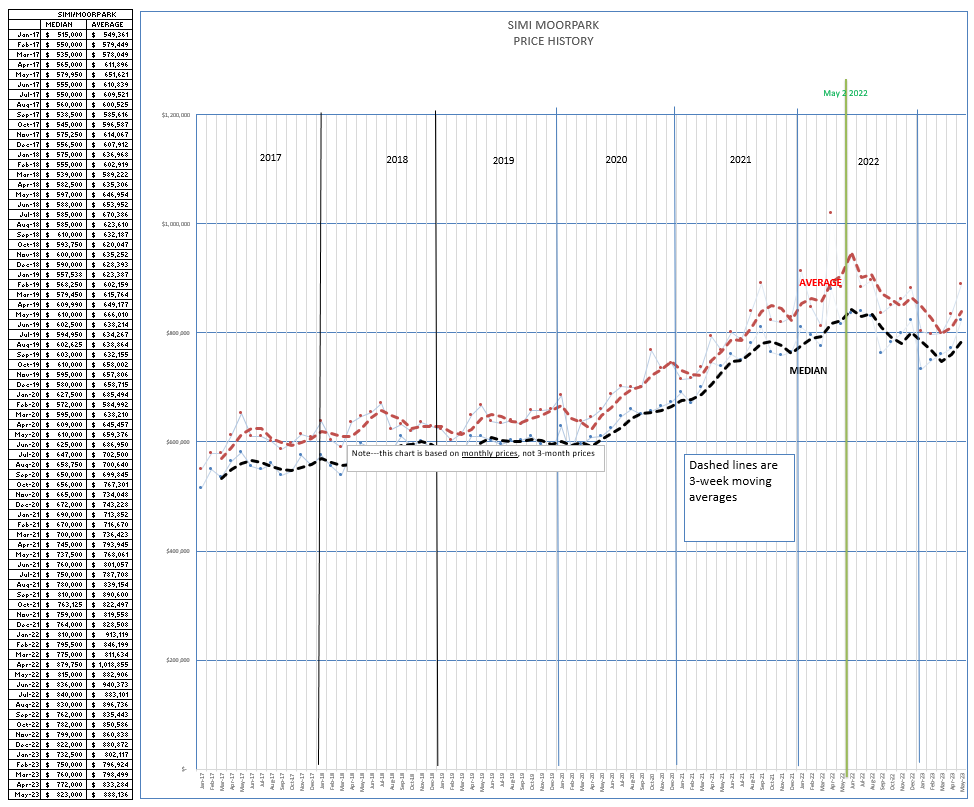
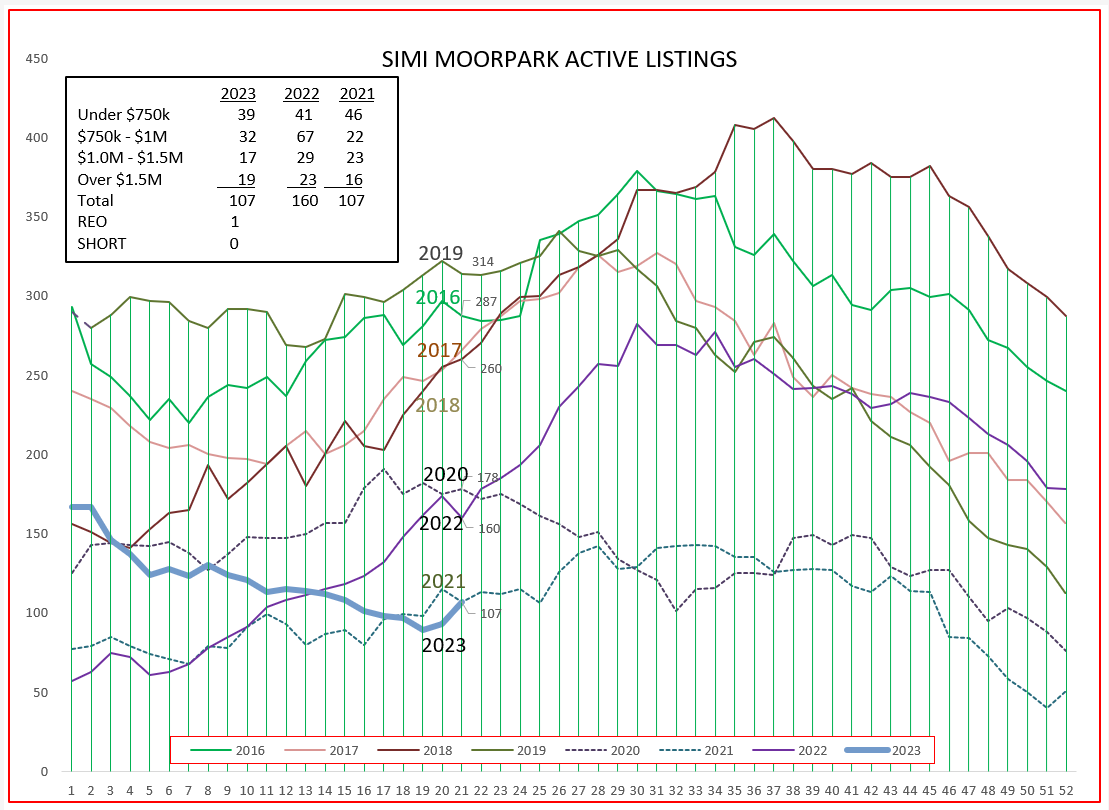
For Simi Valley and Moorpark, much the same took place. Prices at the beginning of 2022 are very similar to prices at the end of 2022, with the beginning of the year showing strong increases while the second half of the year showing similarly strong decreases. The most recent figures show prices beginning to again increase. When you and your clients hear information that home prices dropped, that analysis is based on what happened in 2022, not on what is happening in 2023. In 2023, pricing is on the upswing.
The tables below indicated how things look from year to year. Rather than take a particular month, the figures in these tables represent the sum of the previous three months, compared to those same months a year ago.
The first line compares available inventory. This inventory is active inventory only, and does not include homes under contract with contingencies still in force. I believe the active only inventory is a truer picture of the available inventory when inventory is this low and multiple offers and overbids are the usual. Rarely do homes under contract receive additional bids, except for backup offers.
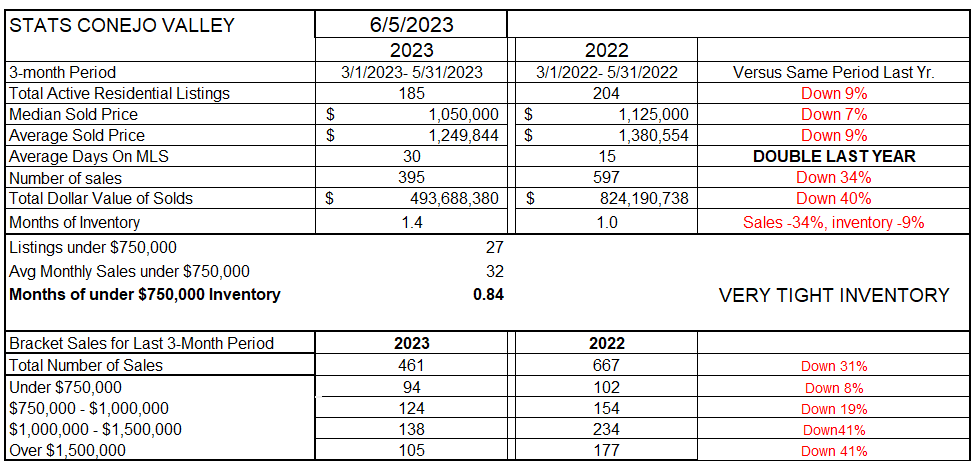
In this type of comparison, prices year-to-year are down 7-9%.
Although inventory is down about 9%, the number of sales is the big story, down 34% from a year ago. Often, a low inventory may be the reason behind lower sales numbers. But there is a much bigger story behind this huge decrease of 1/3. INTEREST RATES.
If we return to the price chart, and the turnaround of rising prices in mid-2022, the chart reversal coincides with the rise in interest rates by the FED. When the FED began to raise interest rates, prices began to decrease as fewer buyers qualified for the higher monthly payments, and with fewer buyers, prices began to decrease.
Looking at the final comparison in this history at the bottom of this table, you can see that the decrease in sales is not spread evenly across the board, but has been more acute in the higher price ranges, with homes priced over $1 million decreasing by 41% in volume. Higher priced homes are moving slower than the rest of the market. The inventory of higher priced homes is increasing, while others are falling. How long is a home on the market compared to last year? On average, twice as long. That is influenced by the growth in high priced inventory, with those homes staying on the market longer. For all homes, we have 1.4 months of inventory based on current sales levels, but only three weeks worth of sales on the low inventory of homes priced below $750,000.
Simi Valley and Moorpark have a much lower percentage of higher priced homes. Let’s see how that market is doing. This market has a lower percentage of the high priced homes, and is a truer picture of what is happening with homes priced below $1 million.
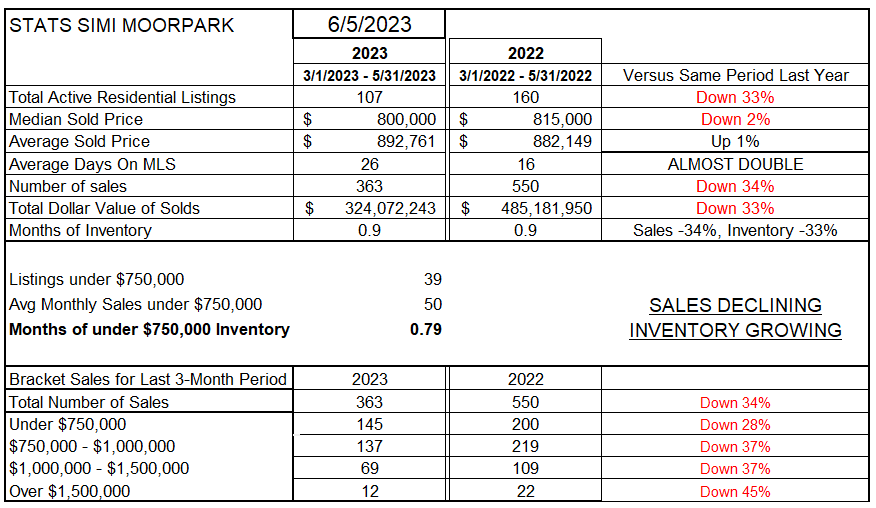
Listings are down 44% compared to last year. Prices are roughly the same as last year. How long does it take for a home to sell? Double the time last year. But the total number of sales, compared to last year, is also down by 1/3. There is less than one month worth of inventory, only three weeks worth of inventory for homes priced below $750,000. Sales numbers for all price categories are lower than last year, with higher priced homes taking a bigger hit.
Let’s look at the inventory of homes, particularly by breaking the inventory down into price categories.
For Conejo, the overall inventory is down 9%. But look at the inserted box. The number of homes priced above $1.5 million increased 50% compared to 2021 and 2022, while the homes in the lower three categories all decreased.
If the number of sales decreased by 1/3 compared to 2022, we can’t look to total inventory for understanding, since total inventory is relatively similar to 2022. However, from the table above, the inventory of active listings for homes priced below $1.5 million is lower, while the active listings for homes priced above $1.5 million is up 50%. The price category of home sales is a huge factor in understanding the market this year.
For Simi Valley and Moorpark, the number of homes in all price categories is lower than last year, an important distinction from Conejo. All price categories have fewer listings than last year. And the total number of listings is down 33%, as compared to only 9% for Conejo. In each area, there is only one REO and no Short Sales, making those troubled sales statistically unimportant.
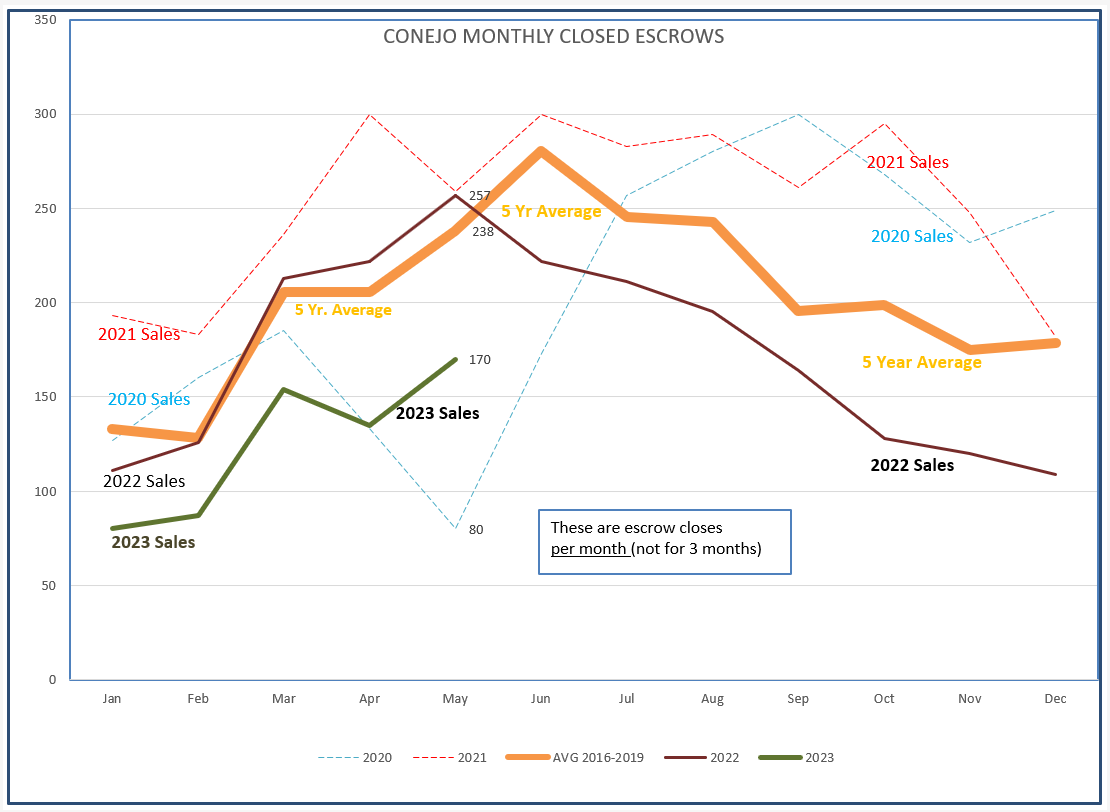
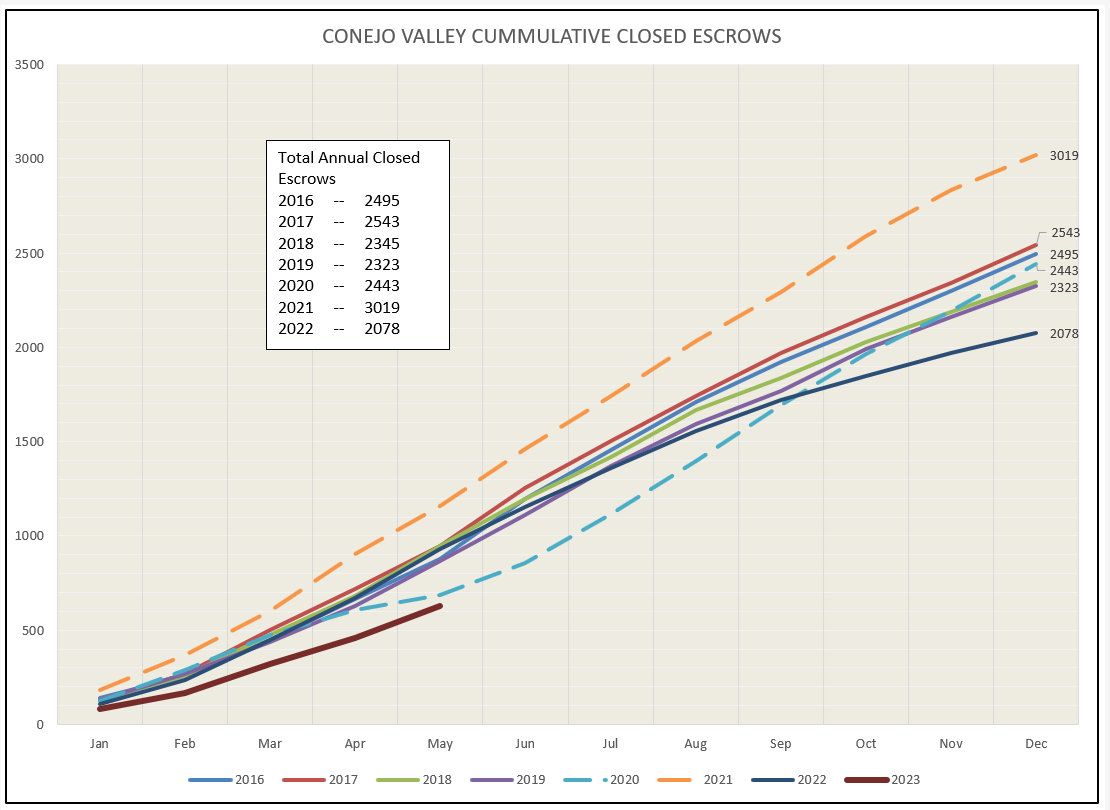
Finally, let’s look at how sales compare to the last two year (anomaly years), and to the 5-year average of sales from 2016-2020. Sales in 2022 came closer to the pattern of 5-year average as we compare the graphs, although 2022 ended the year much below the 5-year average. In June of 2022, the FED began to consistently increase interest rates, and those increases can be pointed to as causing the decline in housing sales. 2023 seems to be closely following both the 5-year and 2022 graphs, but at a much lower level, again the product of higher interest rates.
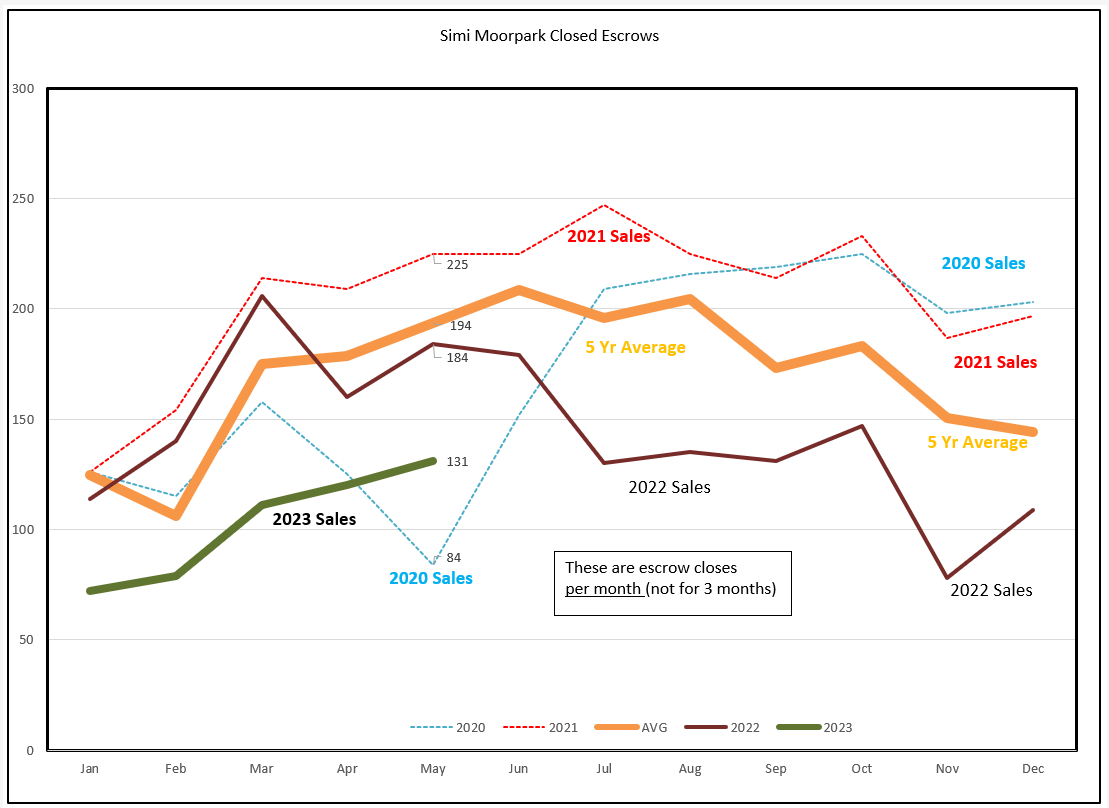
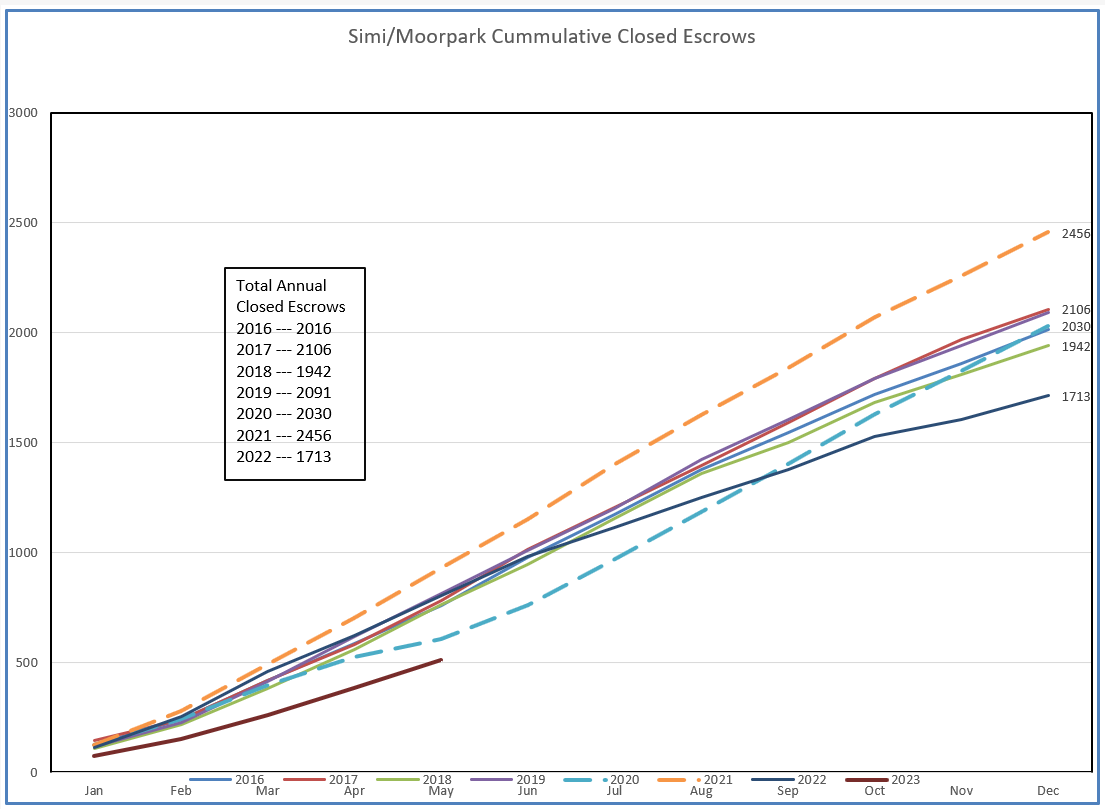
For Simi Valley and Moorpark, the same factors yielded similar results.
Takeaways from this history tell us that inventory remains sparse. Sales remain weak. The number of highest price homes are increasing as a percentage of active listings and decreasing as a percentage of homes sold. The market seems to behaving in a normal fashion compared to past history, but the level of sales is down by 1/3. With only 2/3 of normal volume this year, our real estate market looks to have the weakest showing in the previous seven years shown in the charts below.
The good news is that the market is not crashing, as expected by many. This is not 2008 all over again. Home prices are not crashing, but the number of homes sold this year will be very disappointing. Most of this can be traced to interest rates, and that war is not yet over. The FED is still unsure of what to do. With high inflation, low unemployment, and job openings far exceeding people to fill those jobs, the FED governors will have a difficult time convincing themselves to lower interest rates, indeed not to raise interest rates. Inflation is the main enemy of the FED, and they will everything they can to diminish inflation pressures. Unfortunately, that means there will be little to cheer about as interest rates for the housing market will continue to be high and push higher. Our market remains strong considering prices for individual homes, but it remains weak considering the number of transactions we can expect to see.
Keep working hard out there. There may be fewer sales, but the buyers and owners involved will be looking for the best real estate agents to help them in their transactions. Be the best.
Chuck