A rerun of 2023 will not make many of us happy. We would rather have a rerun of 2022.
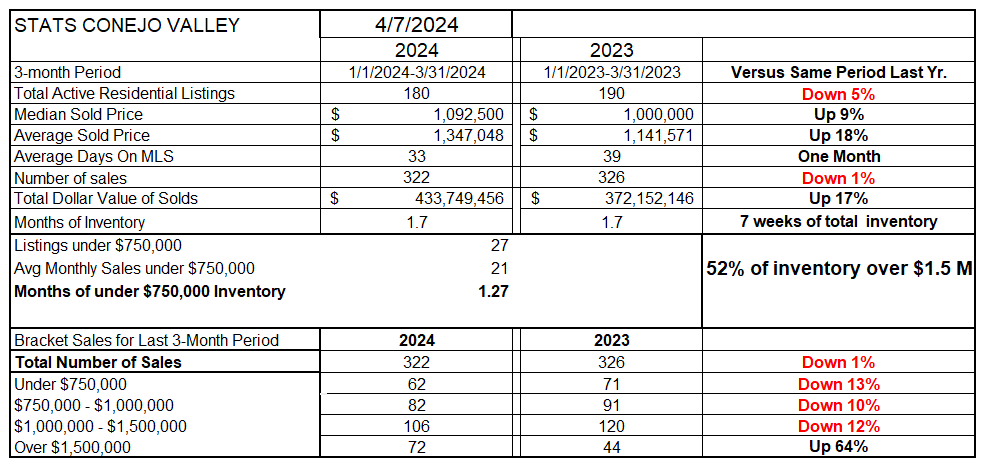
Let’s start this edition with our table comparing the first three months of 2024 with the first three months of 2023.
Inventory remains low, 5% below the low inventory of last year. Prices are rockeeting, mostly due to the low inventory. Median prices are up 9%. Thanks to the higher percentage of very expensive homes sold compared to last year, Average prices are up 18%. Sales of the highest trauch of homes was up 64% versus last year, while all other price categories were lower. The total number of sales is pretty close to last year, and listings fly off the MLS after one month, same as 2023. Due to low sales, the low inventory represents about 7 weeks worth of sales. However, over half of the inventory is priced above $1.5 million, restricting sales numbers. Not a normal price spread.
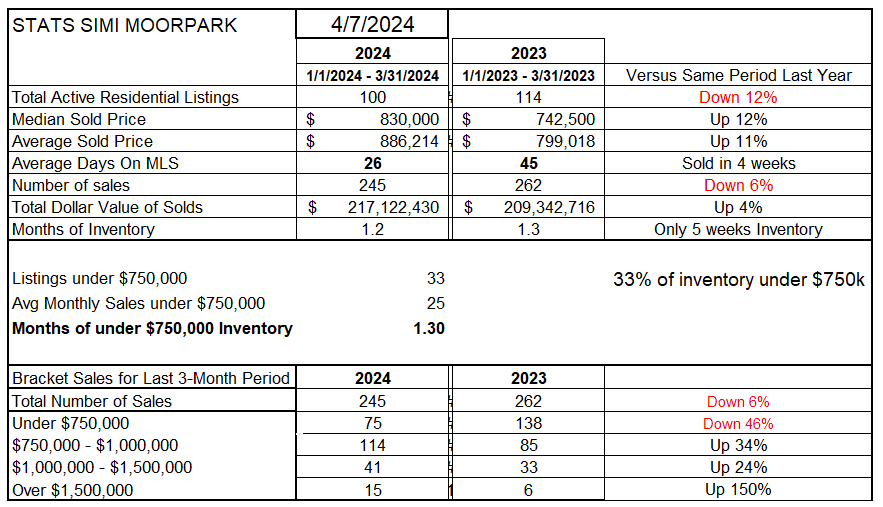
Simi Valley and Moorpark do not have as wide a spread in price categories. However, homes in the over $1.5 million category are increasing significantly. Still, about one third of the inventory is below a $750,000 list price. Compared to last year, prices have increase between 11-12%, while sales are down 6% overall. Inventory, down 12% compared to 2023, represents only 5 weeks worth of sales.
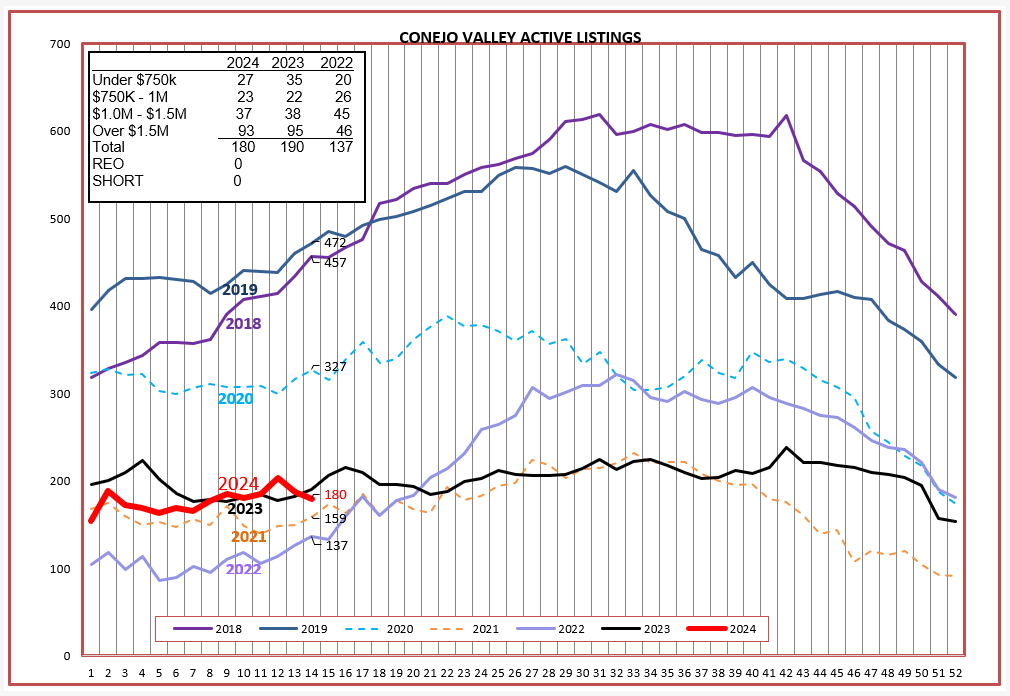
Comparing the active inventory to previous years, we remain extemely low, for the fourth year in a row. The spread of listings by price is very similar to 2023. The major change from the very low inventory year of 2022 is in the highest price category of homes.
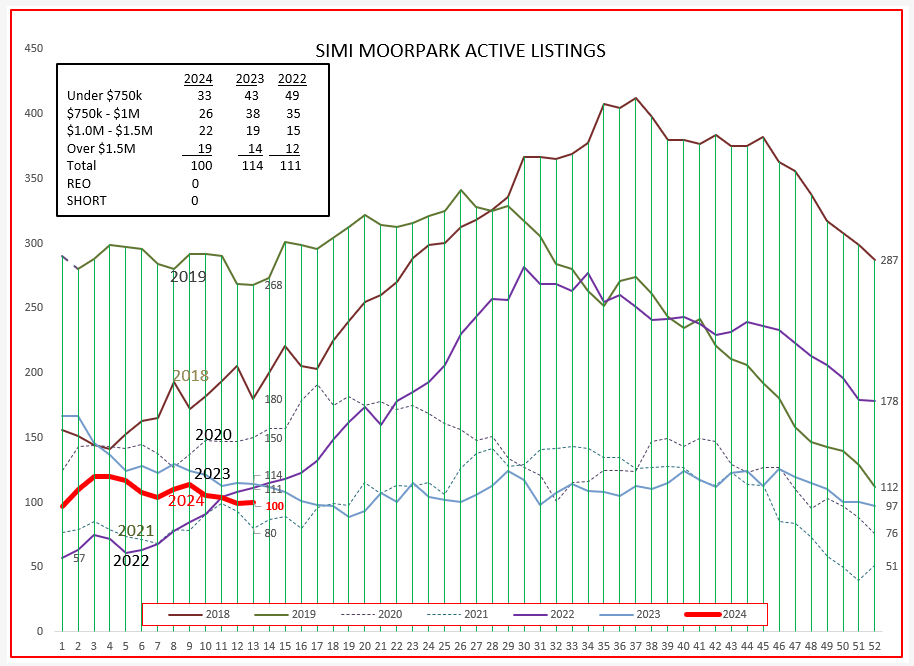
For Simi/Moorpark, inventory has remained very low for a full five years. 2024 is following 2023, not a good sign for our market to change.
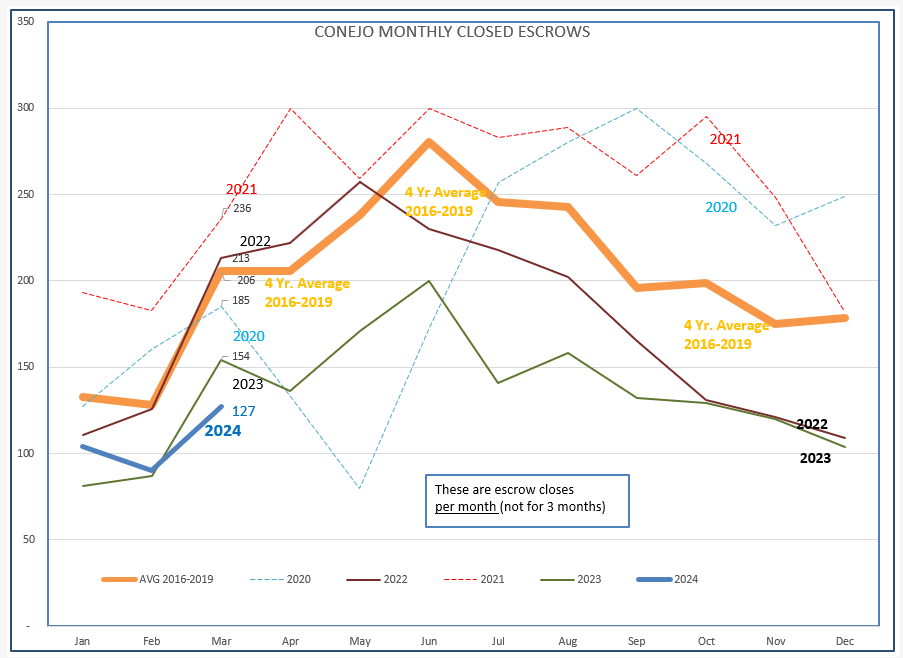
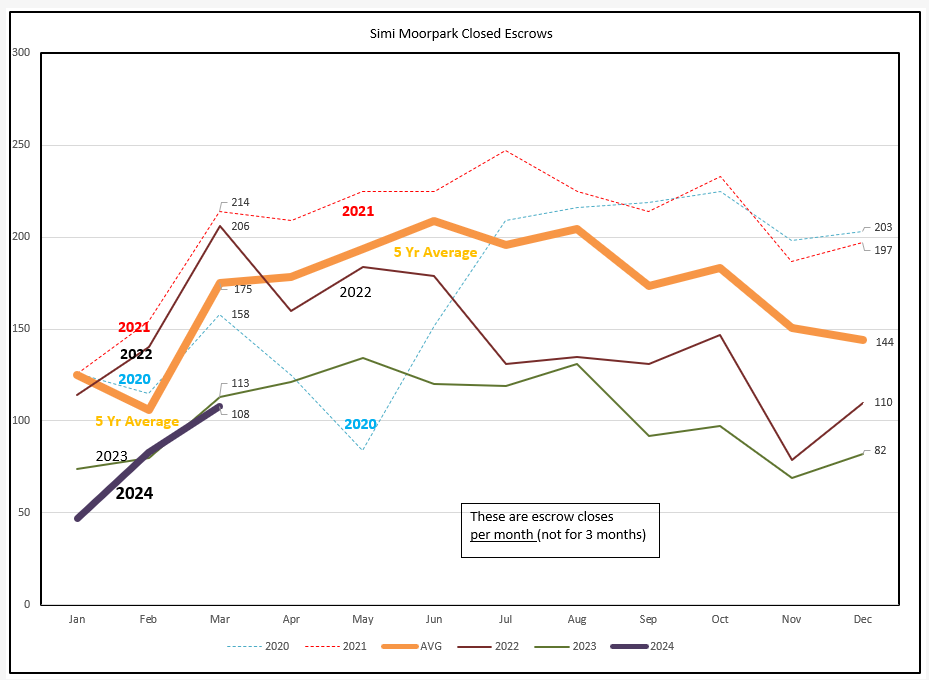
Sales are tracking close to 2023 levels, one of our lowest sales years in recent history. The FED continues the Higher For Longer conversation, with rate cuts now not expected until year end. The 2023 graph for both Conejo and Simi/Moorpark closely mirrors the orange 4-year average, only at a much lower level.
Simi/Moorpark is also going the same path experienced in 2023.
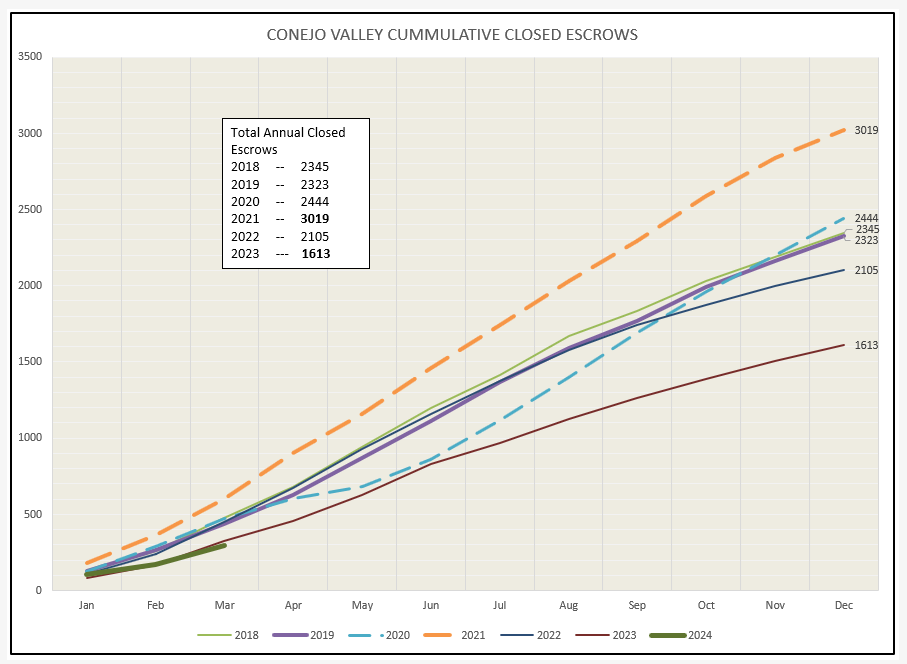
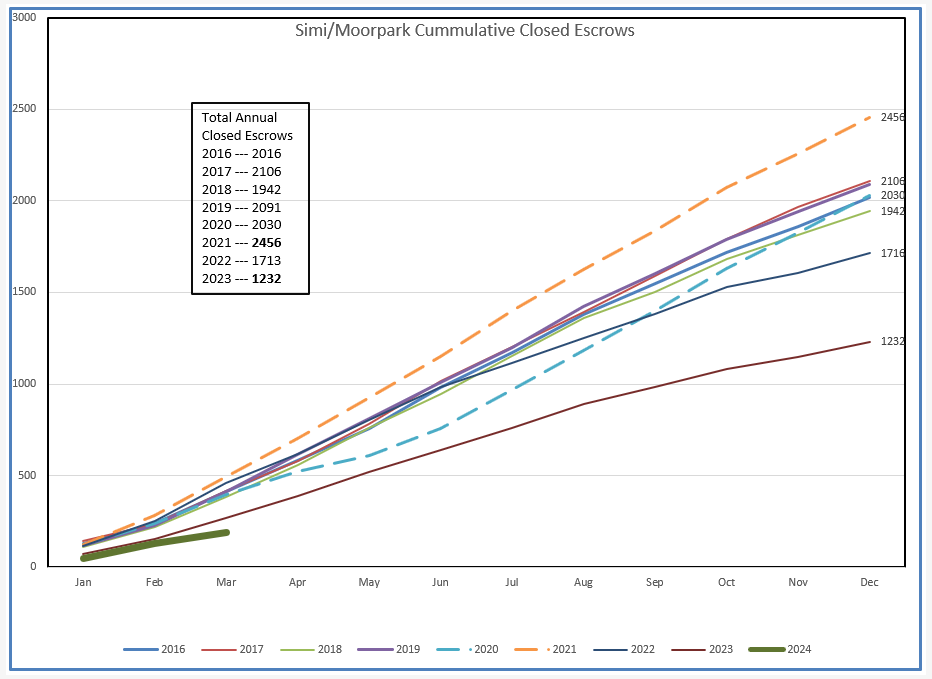
As expected, the cummulative sales chart, which tracks the total number of units sold as the year progresses, is also following the 2023 path.
The same comparison is true for Simi/Moorprk. We would be doing better if only we had more inventory.
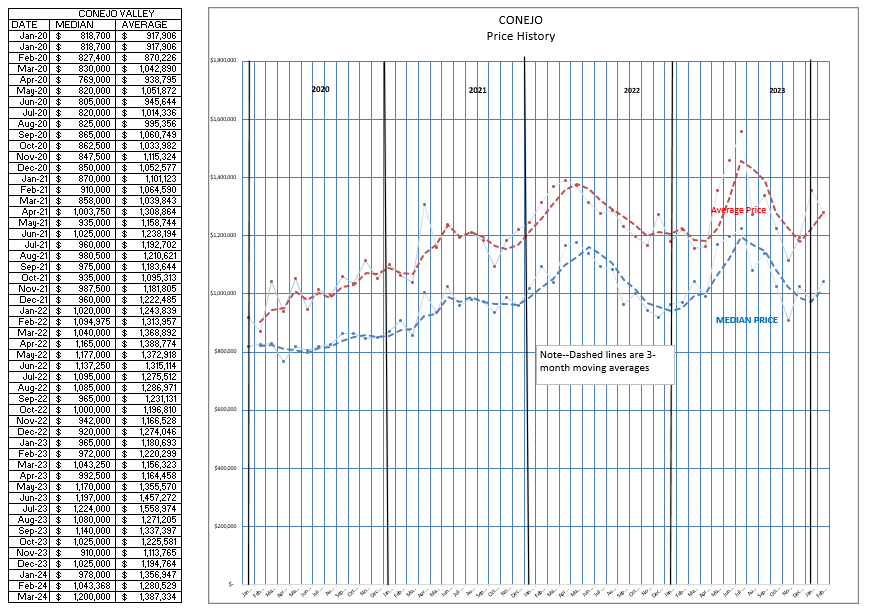
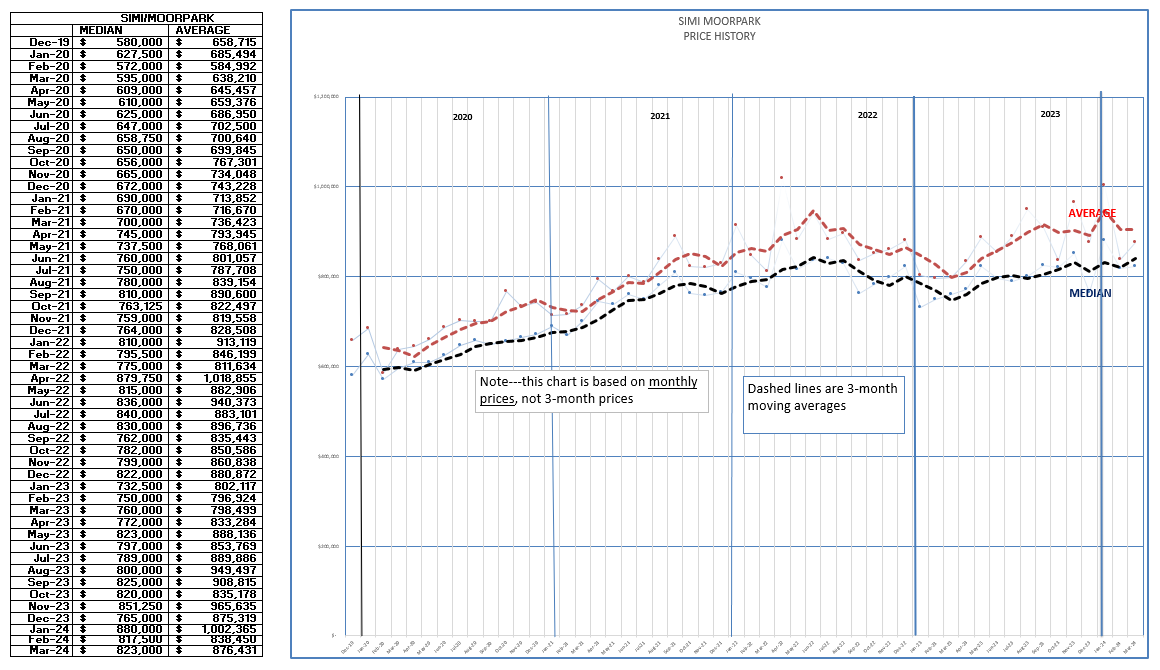
Finally, let’s explore how prices have been tracking. The charts below are not the 3-month statistics above, but are monthly measurements of both the median and average prices. 2023 Showed a big spike, then a strong decline in 2023. Prices are increasing again, compared to where they were at the beginning of 2023.
For SImi/Moorpark, prices did not experience the big spike and decline in 2023, and continue strong. The presence of higher priced homes increases the separation between the Median and Average lines.
I would rather not draw comparisons to last year, as last year was not a good year for agents. For owners, yes; agents, no.
With mortgage interest rates continuing close to 7% , and the FED backpedalling on when they will begin to cut rates, there is not much cause to expect different results from last year.
The FED most often raises rates until the job market experiences trauma. However, there is a continuing monthly increase in jobs created, and the unemployment rate remains below 4%. Most of the jobs created are lower paying jobs, jobs in hospitality and food service. These jobs are being filled by the influx of immigrants. Until job creation numbers go down and unemployment rates go up, the FED is hesitant to lower rates. This is a very different economy than we have experienced previously, much of it still influenced by the helicopter money spread during COVID. The jobs most affected by COVID are the jobs now increasing in numbers. Perhaps the FED needs a new strategy. Let’s hope it involves housing.
Until next month, keep safe out there.
Chuck
