This economy has proven stronger than everyone thought, particularly the FED. Inflation is Enemy #1 at the FED, and they have had success bringing inflation down. Their decisions have influenced many separate mnarkets. The job market remains strong. Unemployment remains low. The one we are most concerned with is housing.
By raising interest rates, mortgage rates went up, increasing the monthly carrying cost of home loans. Hopefully we have reached the peak, and can look forward to rates declining. This will allow buyers to qualify for bigger loans, and will also create a strong refinance market.
The best analysis I have seen was The Housing Market’s Deep Slump in 5 Charts from NBC. I suggest you take a moment to click on that link for an understanding of the entire US market.
However, remembering that all real estate is local, let’s look at our local numbers.
First, the statistic tables, which compares the most recent three months of 2023 to the same months in 2022. Prices should be approached with caution. Median prices, a price at which half the homes sold under and half sold over, was up a very strong 7%. But average prices, total sales value divided by the number of sales, is up only 2%. Why? Price appreciation is much stronger in the lower priced end, and not increasing as much in the higher priced end. Supporting this hypothesis is an inventory of homes priced above $1,500,000 that represents 45% of our entire inventory in 2023, versus 31% in 2022 and 37% in 2021. The strongest tranche in our market is for homes priced between $1.0 and $1.5 million, and those sales have been reasonably strong compared to last year, up 1%. Listings move under contract within one month, and we have 6 weeks worth of inventory at current sales volume.
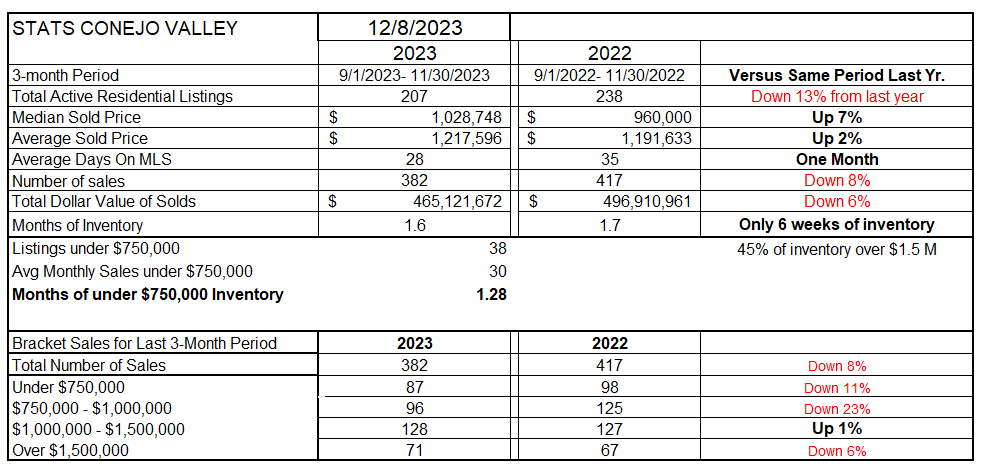
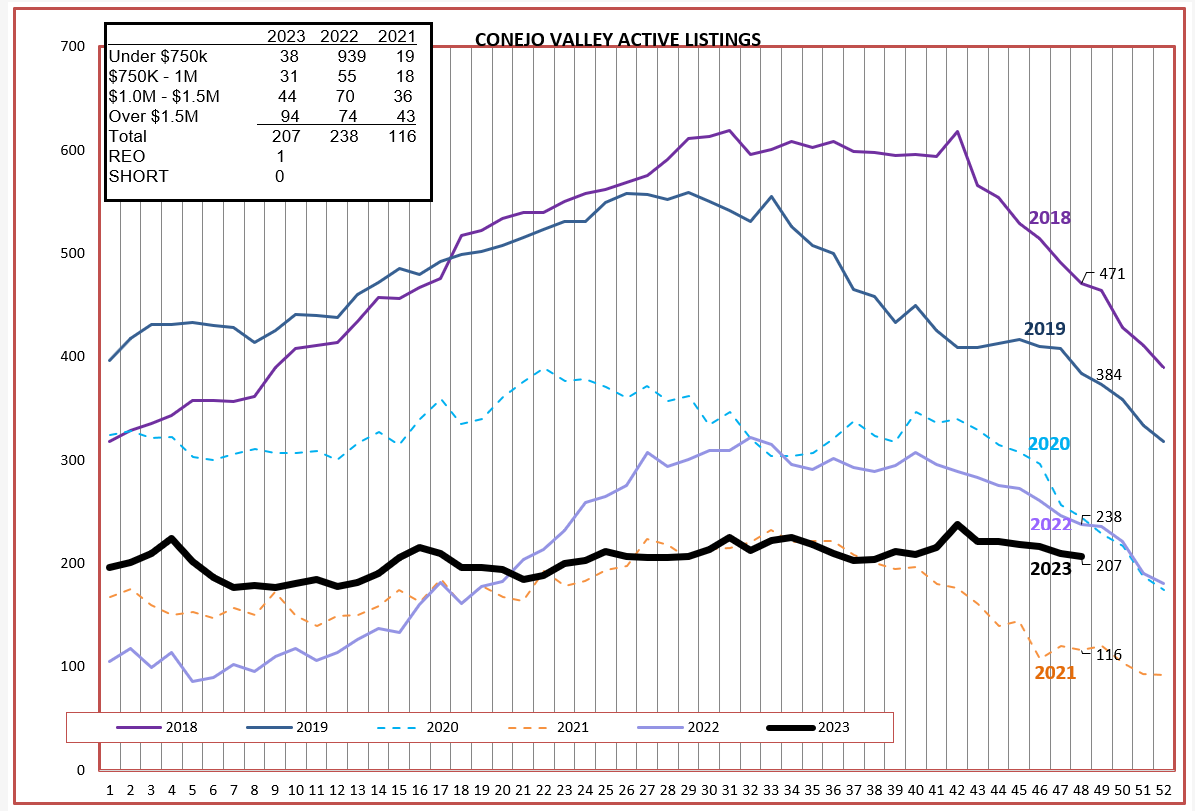
Inventory remains tight, down 13% from the already tight inventory of a year ago. but is up 78% from 2021’s extremely low figure. Inventory usually increases as the year moves into summer, and decreases as we move into fall. This year has not observed that pattern. That lack of inventory has kept prices strong.
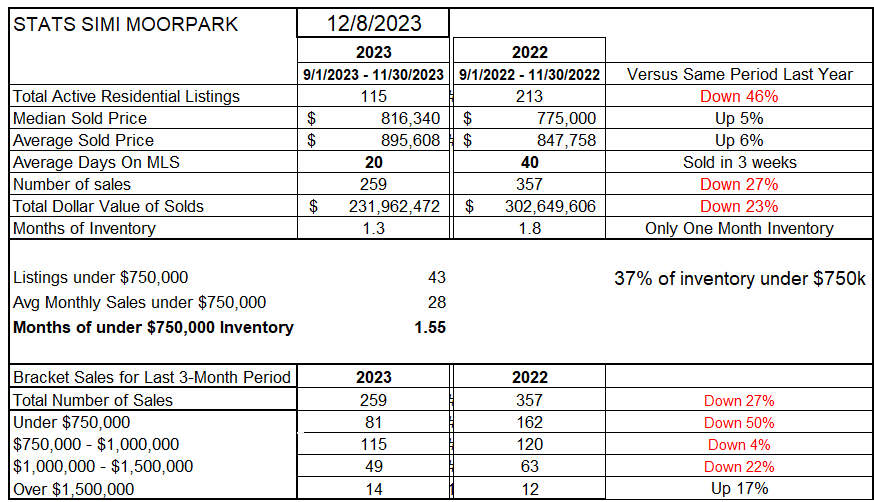
Conejo Valley and Simi Valley/Moorpark are not reacting the same. Two different areas, separated by mountains. Two different markets separated by different median selling prices, $800,000 versus $1,000,000. Inventory declined drastically from 2022, down 46%. In 2021, inventory had only 73 listings at the end of November. Tight inventory has caused both Median and Average prices to increase 5-6% year over year. But due to lack of inventory, sales were down 27% versus last year. The highest traunche of homes experienced a large percentage increase, but was the result of only two home sales.
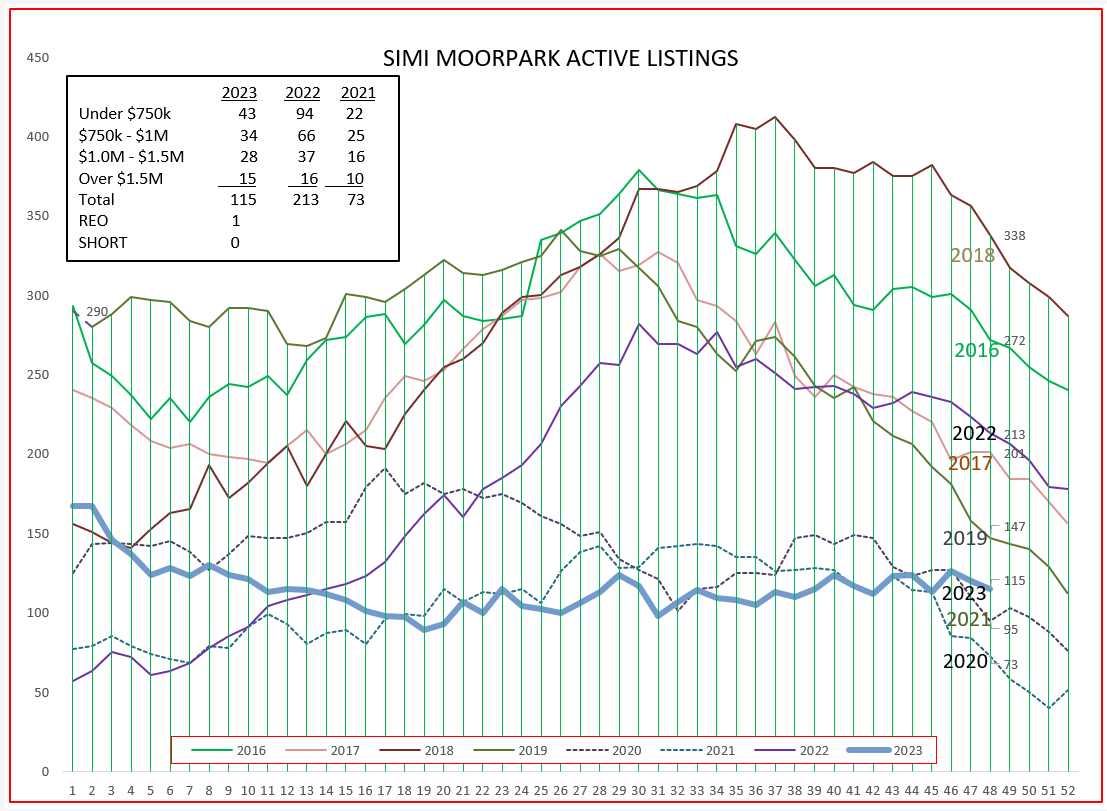
SImi/Moorpark inventory continues to be tight, as it has been for the past 3 years. Like Conejo, available inventory has remained constant as the year progressed.
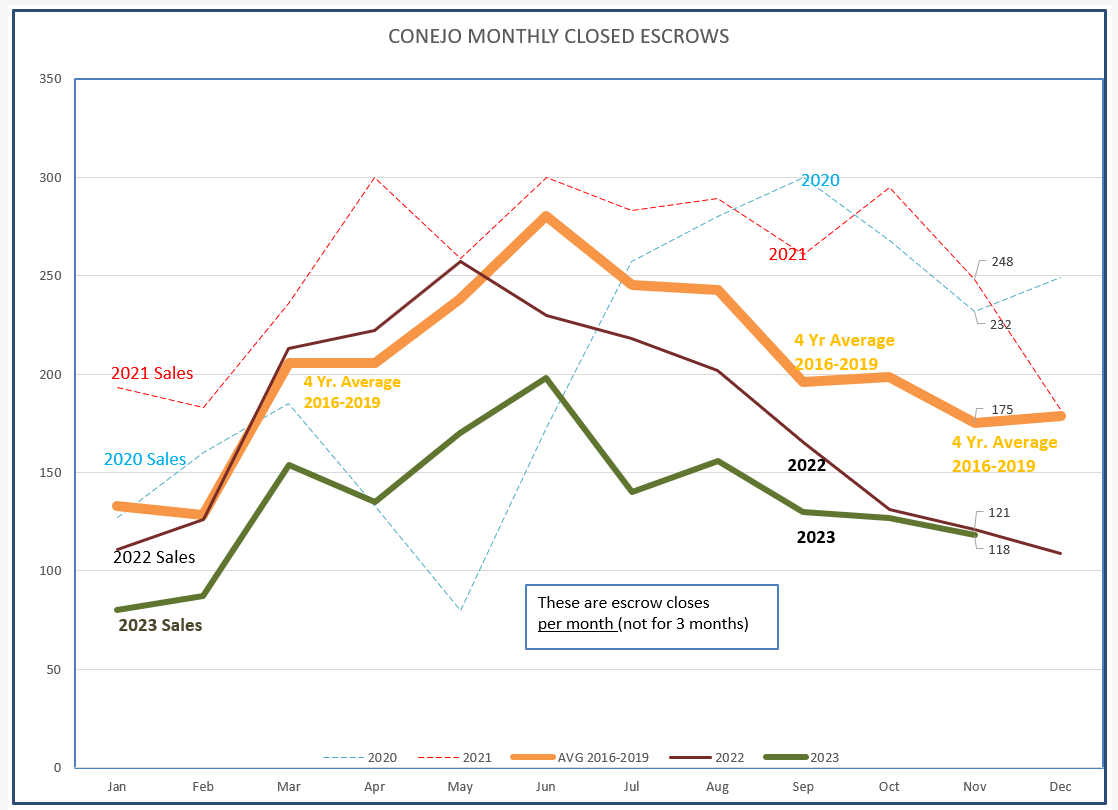
Tight inventoory has influenced sales. It is hard to sell homes when we don’t have much inventory. November saw only 118 escrows close, the lowest number in the chart below. The November average for “normal” November months is 175.
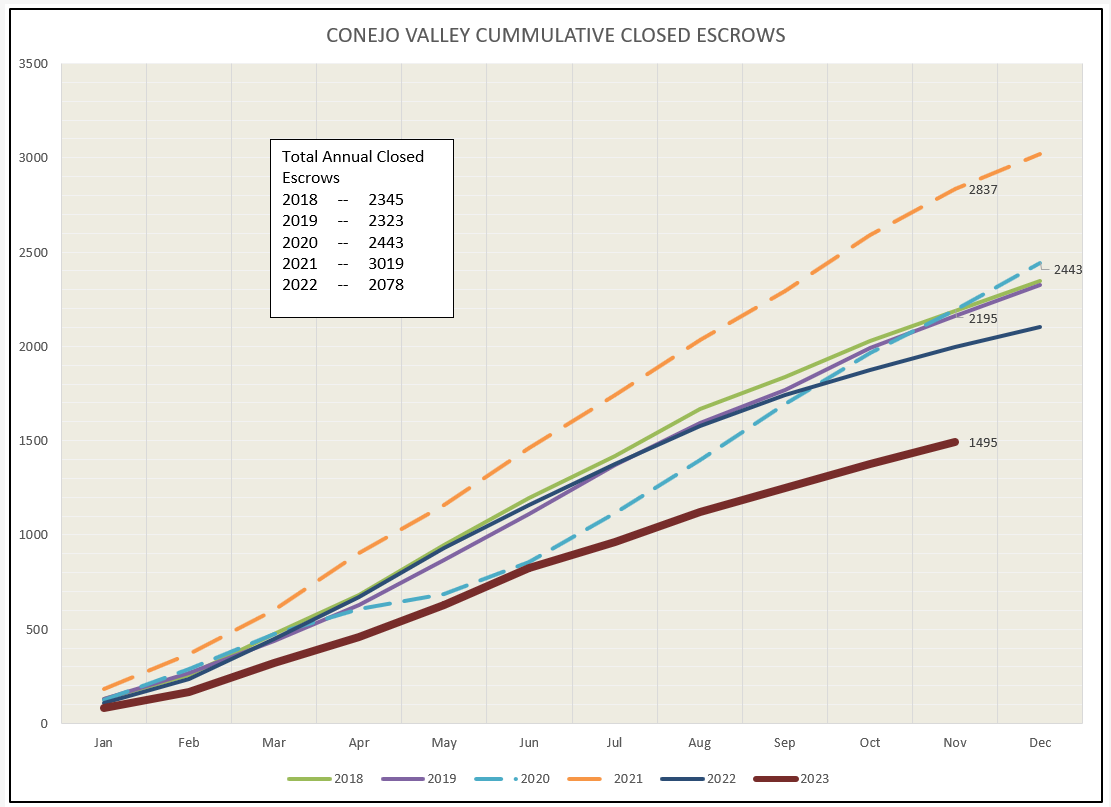
Looking at closed escrows with a running total as the year progresses more accurately displays how this year compares to previous years. Roughly 2200 homes generally are sold by this time of year. For 2023, we are only at 1495, some 32% less than usual.
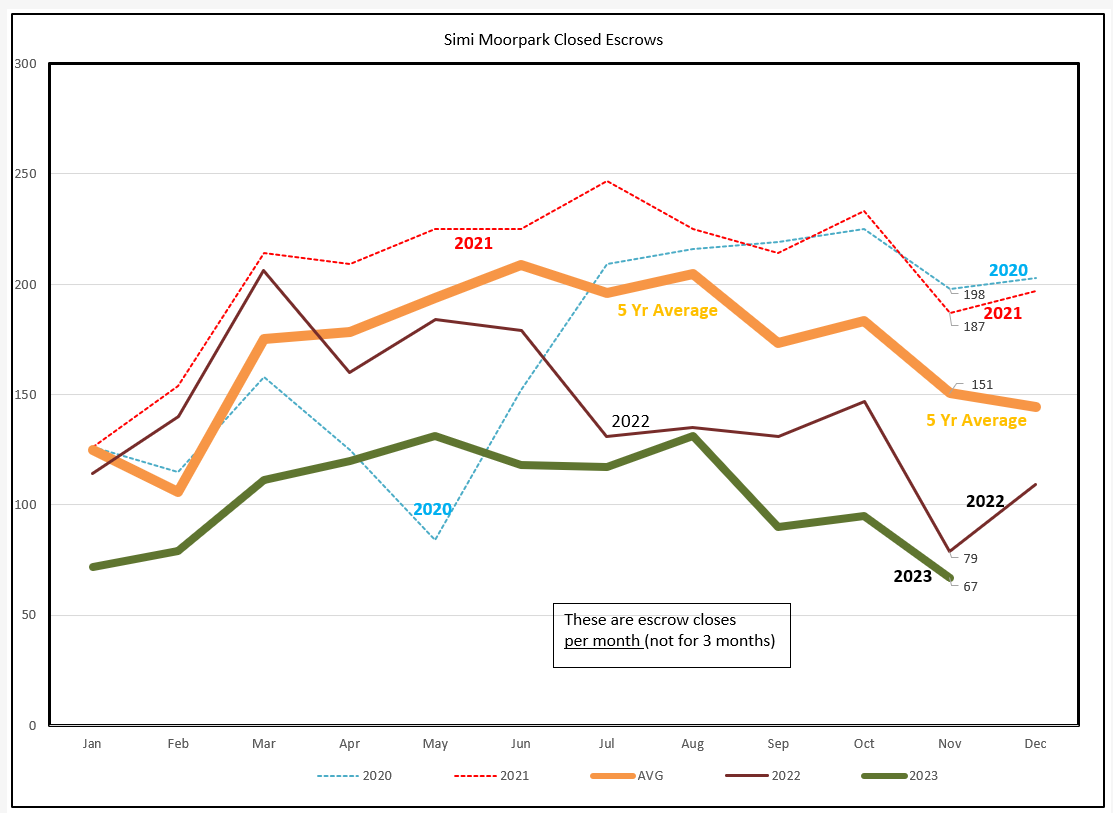
Closed escrows for Simi/Moorpark find a similar chart, but with November reporting a chart-low 67 homes sold.
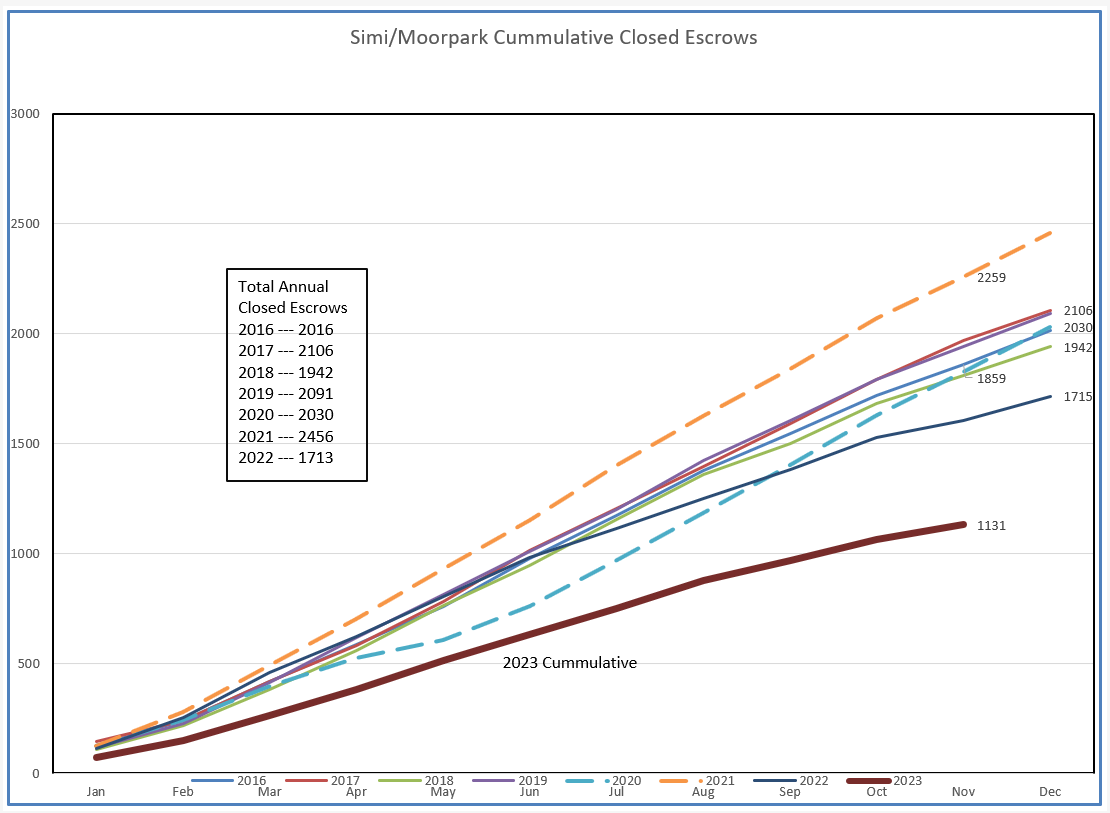
The cummulative chart explains just how low sales have been this year. Normal should be in the neighborhood of 1859, and for 2023 we have only closed 1131, down almost 40%. Again, hard to sell what is not listed.
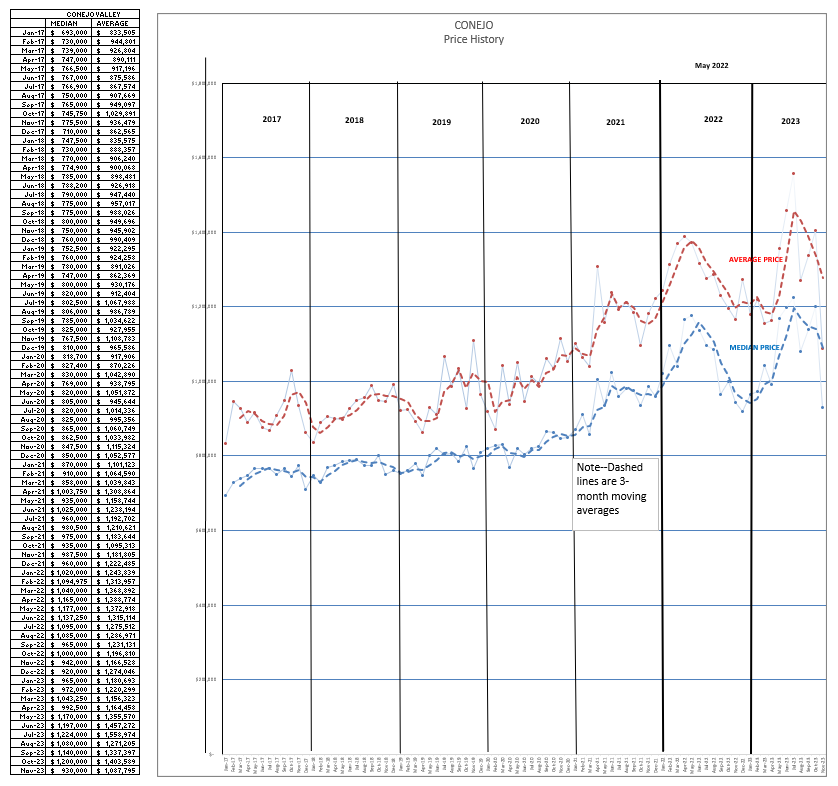
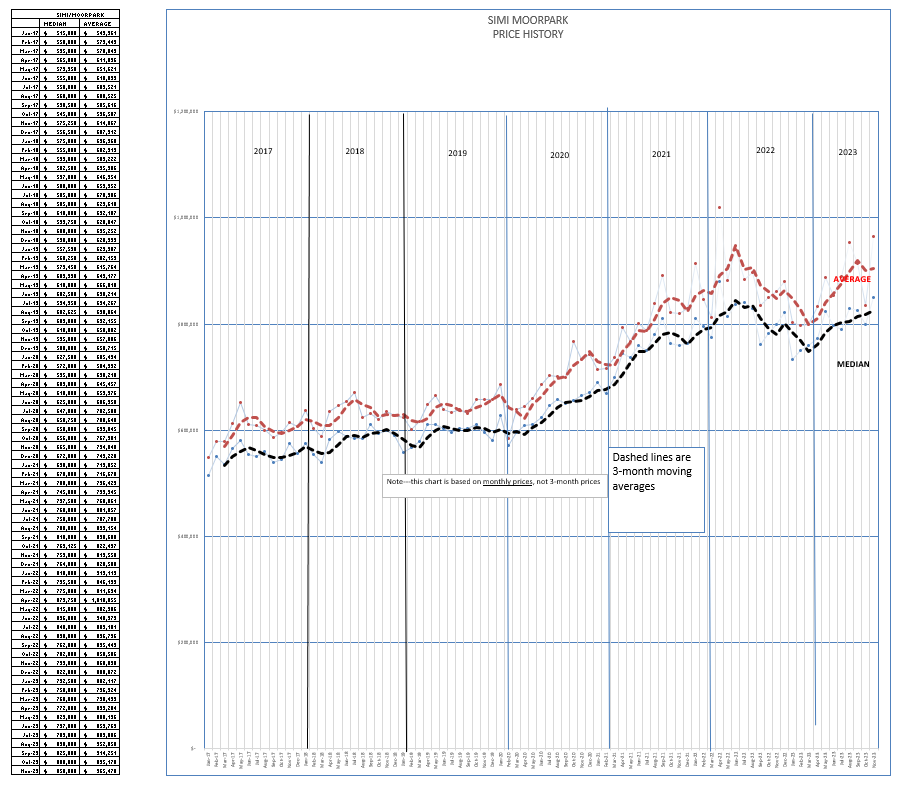
Finally, let’s look at the price chart. This chart show both Median and Average prices for each month, rather than a 3-month average in the statistics table. It better shows how prices are moving. Conejo Median prices took a huge drop, down to only $930,000. SImilarly, Average prices dropped severely to $1,087,000. Both Average and Median prices hit a high for the year as summer began, and now have dropped precipitously. The Statistical Chart shows year to year increases. I think this comparison is a more accurate depiction of what is happening. This chart says we are in a sellers market in Conejo.
Sales of highest price homes, by their absence, affected these totals. Sales of all Conejo homes priced below $1.5 million numbered 100 in September, 109 in October, and 108 in November. Pretty stable. Sales for homes priced over $1.5 million numbered 34 in September, 22 in October, and only 16 in November. A severe drop Median prices dropped because of this factor, Average prices dropped even more.
For Simi/Moorpark, we get a different picture. Prices are stable, still strong. The large price increases in Conejo may have precipitated larger decreases at the end of the year, whereas the lack of inventory and subsequent lack of sales have kept Simi/Moorpark prices strong.
Everyone is hoping, and in some cases planning, for interest rates to come down next year. We need that. First time buyers need lower mortgage rates to allow them to begin their climb to financial wealth. Senior need that to move to their next, downsized home. Homes are not like stocks, it is a bad plan to try to sell at the top of the market or to buy at the bottom. We live in homes, we don’t live in stocks. There are a lot of factors to consider when people buy and sell. This report tells you what has happened. Your clients will tell us what will happen in the future.
Stay safe, and have a safe Holiday Season.
Chuck