Who brings a knife to a gunfight?
So said Sean Connery in “The Untouchables”.
The FED governors must have watched that movie. The bring weapons to slow down the economy that are hard to ignore.
I have two primary measurements of real estate activity. Homeowners measure the value of their home. Realtors measure the number of homes sold—that is our market. Lately, homeowners have been happy, but Realtors not so much.
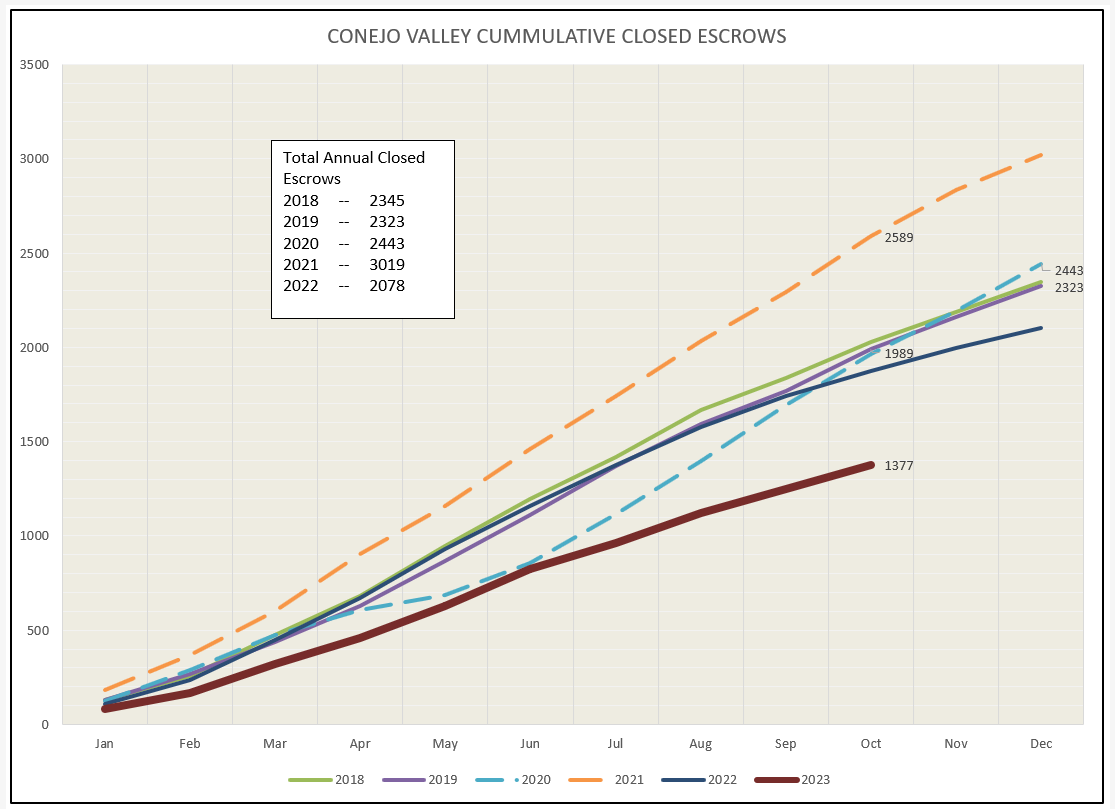
Below is the graph of home sales this year, with the total number increasing week by week. Look at the group of lines in the center of the chart, the average or normal experience of homes sold. We can see that average or normal is in the area of 2,000 homes sold at this point in the year. We are at 1377. From this chart, sales this year are only about 69% of normal. Down 31%.
We can look back longingly at the spectacular year of 2021 (dotted orange line), in which total sales of 2589 were 129% of normal. But what we have today is not like 2021. Next year may be better if the FED decides to reverse their interest rate course (it may help that it is an election year). However, the high interest rates causing the slowdown in the market will more than likely lead to a recession. Even though interest rates come down after putting out the fires of inflation, recessions are not good for the market either. Next year will also be difficult.
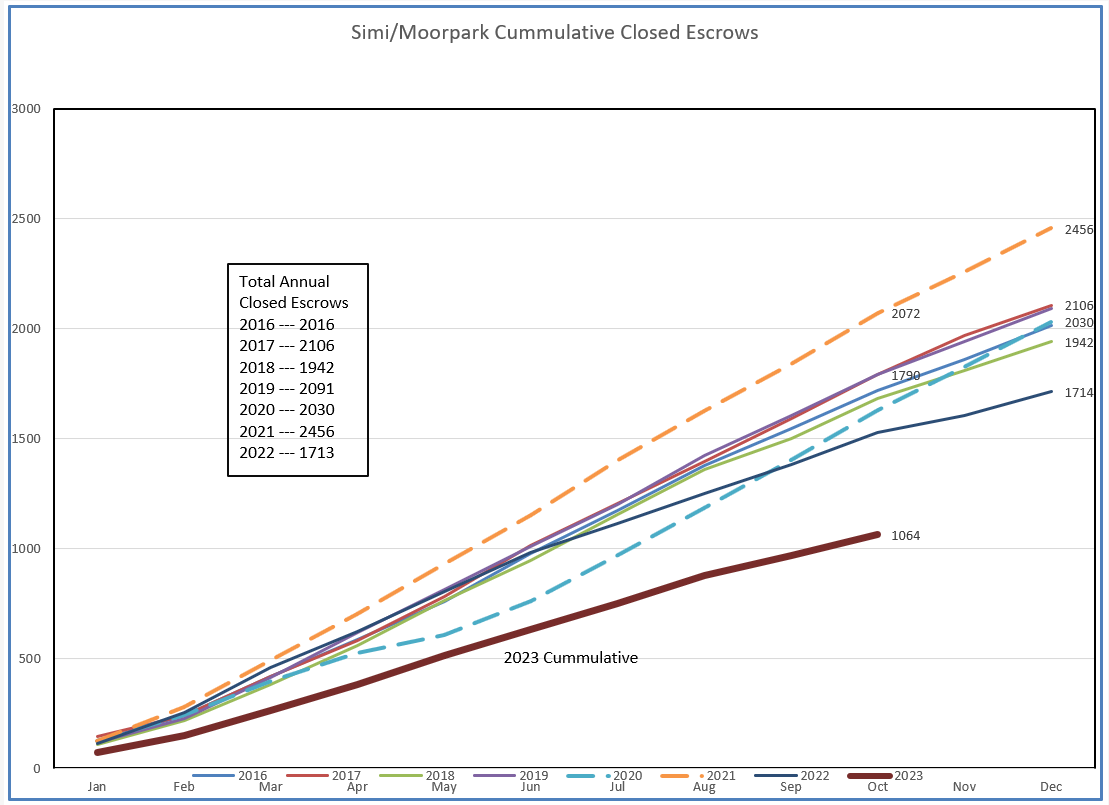
SImi Valley and Moorpark are about the same as Conejo. Average cummulative sales numbers this time of the year are about 1800. The current number of 1064 show us to be about 59% of normal, down 39%. The strong anomaly year of 2021 had 2072 or 115% of normal. If the FED were to measure their success at slowing the economy by measuring home sales, they should feel very good. Unfortunately, they have lots of other measurement tools to concern them, and those results point to them continuing the battle against inflation.
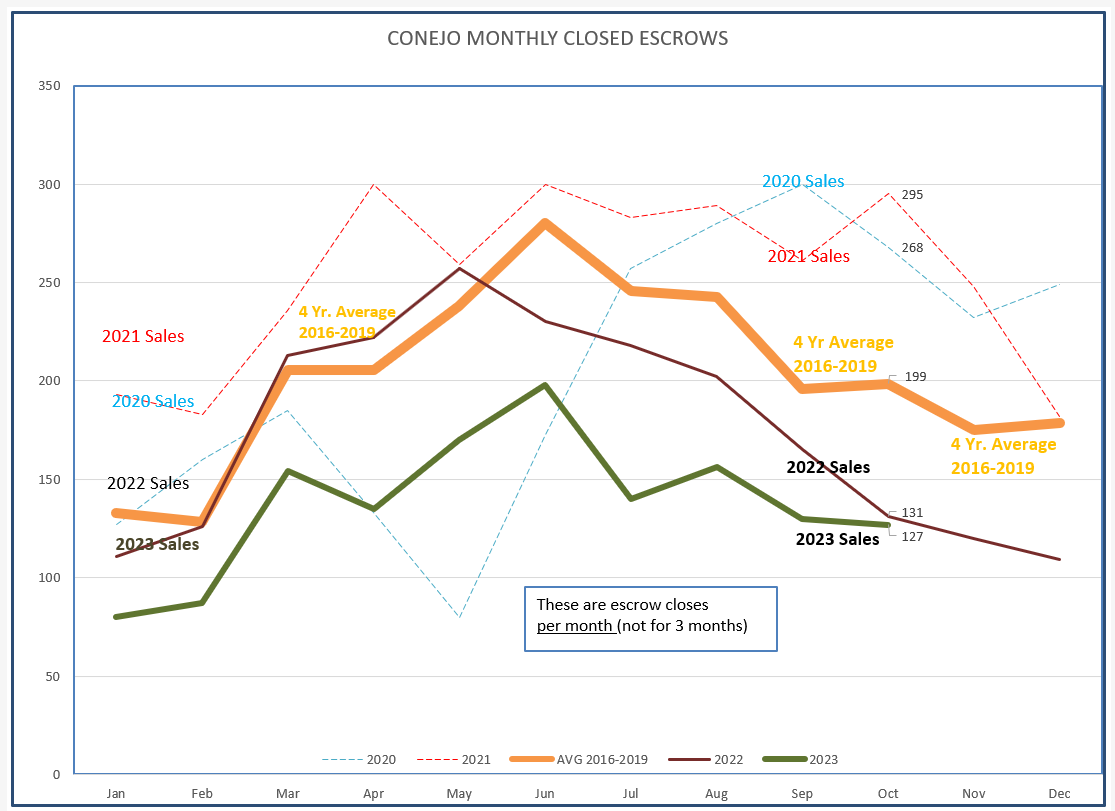
Let’s now look at the same sales numbers in a different way. We know from the cumulative chart that sales are low this year compared to normal. The heavy orange line below represents four years of normal. The heavy green line for 2023 follows much the same path, although at a lower level. But a normal line.
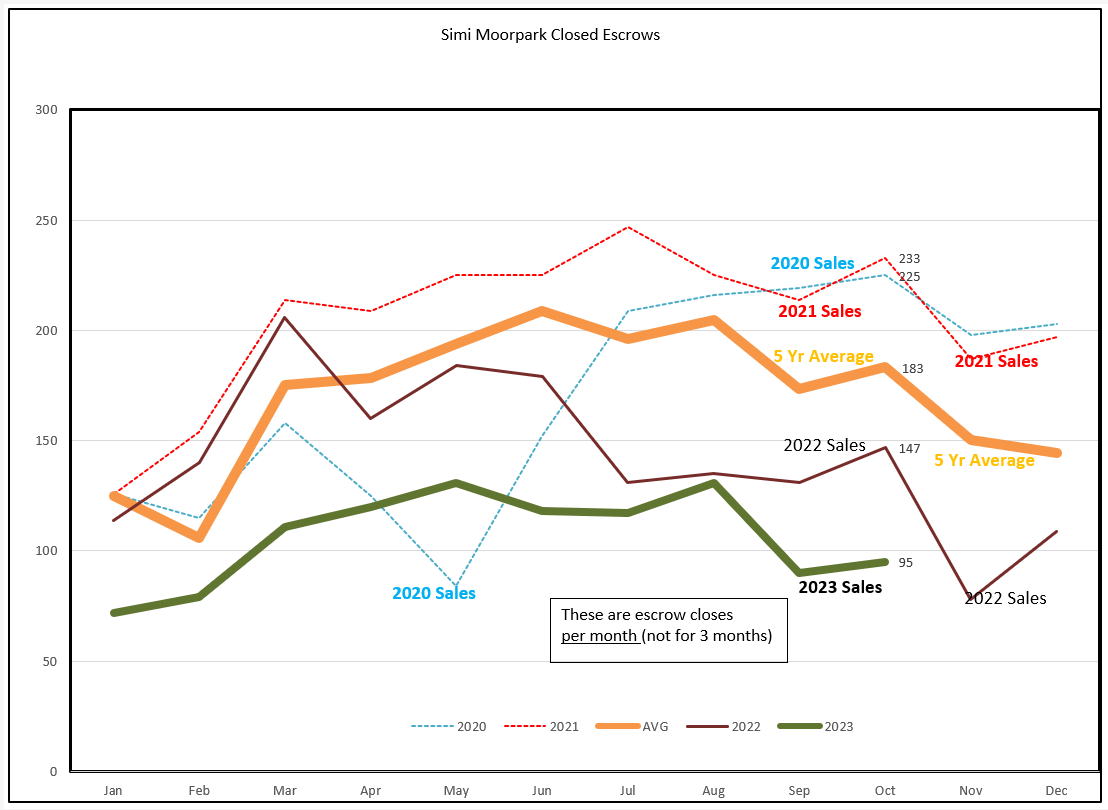
Simi Valley/Moorpark sales track pretty much the same, normal sales (orange line) versus 2023 (green line). A normal line at a lower level.
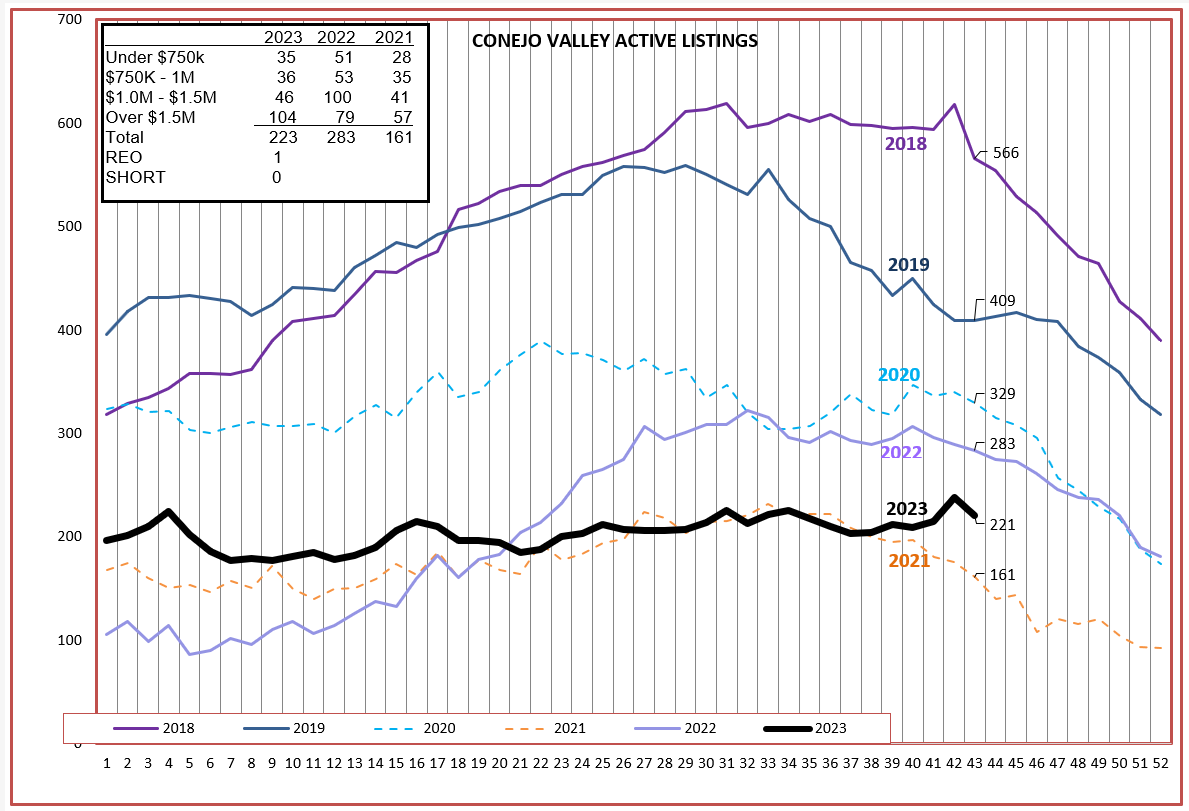
 Sales numbers are down. Has that caused available inventory to increase? No. Inventory has stayed static as the year progressed (heavy black line below). Inventory normally begins to climb at the beginning of the year and then begins to decline as we head into Fall. For many reasons, this has not been a normal year.
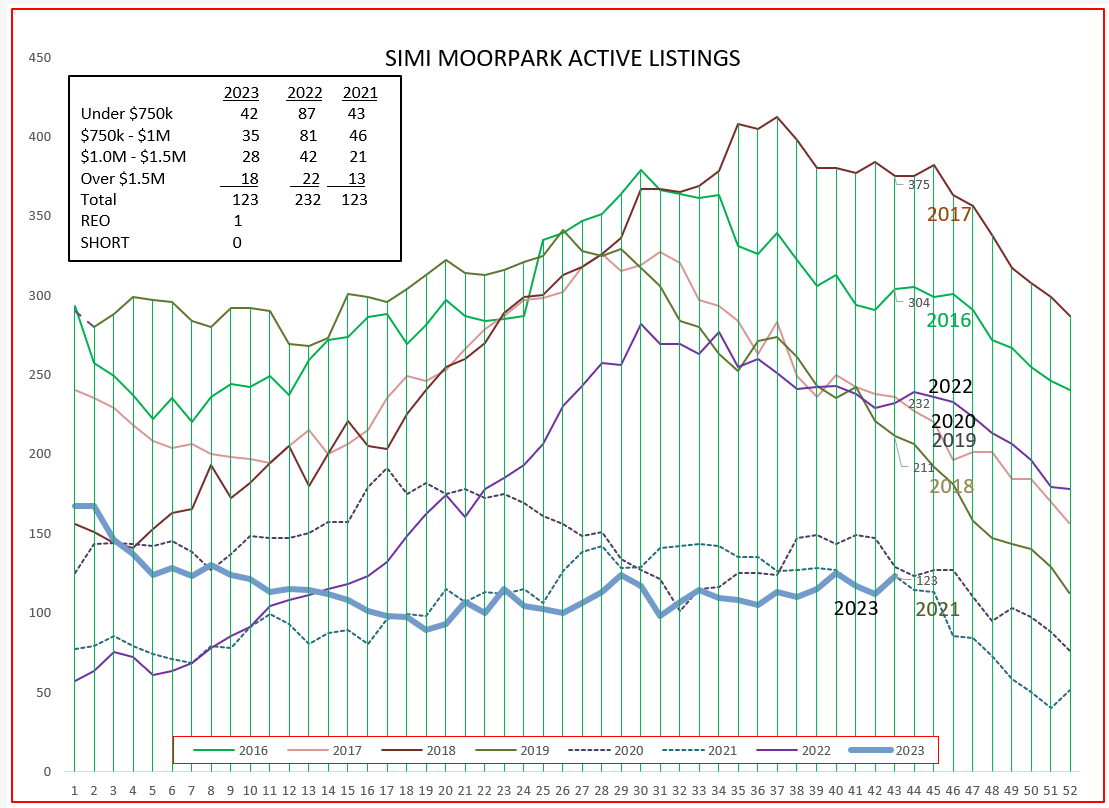
For Simi Valley/Moorpark, the same is true. Inventory in both valleys began the year at a very low level and has stayed there. Yes, housing prices have been very strong due to this lack of inventory. But while inventory has not climbed during the Spring, neither has it begun the expected decline at this time of year.
Sales have been lower than normal, with volume mirroring a normal year although at a lower level. Demand for homes has sucked up any inventory. This should have caused prices to increase. Let’s see if that happened.
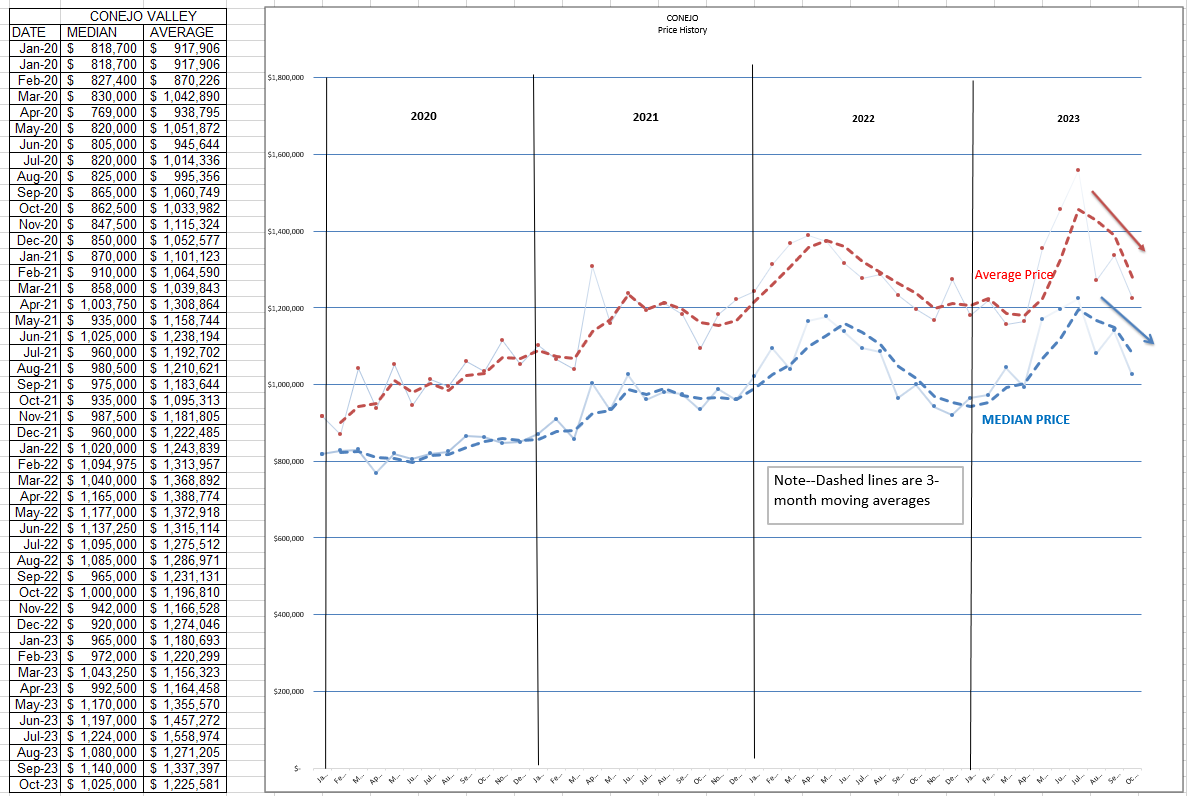
Prices also follow a path similar to inventory and sales volume, rising at the begining of the year, peaking in the Summer, then declining in the Fall. But this year, while sales have followed the expected curve, inventory has flat-lined. Look at what is happening with prices in the Conejo.
Prices were surpisingly strong in the first part of 2023 as mortgage rates were increasing monthly. Then they peaked mid-year and began a rapid decline, projecting to end the year as it began. The small pool of buyers that are unaffected by rising mortgage rates will not support constantly increasing prices. The FED has promised to keep rates higher and longer. Available inventory has not decreased as usual for this time of year. Buyers needing mortgages to puchase homes are faced with rising prices for both homes and mortgages. Something has to give. I believe it will be prices.
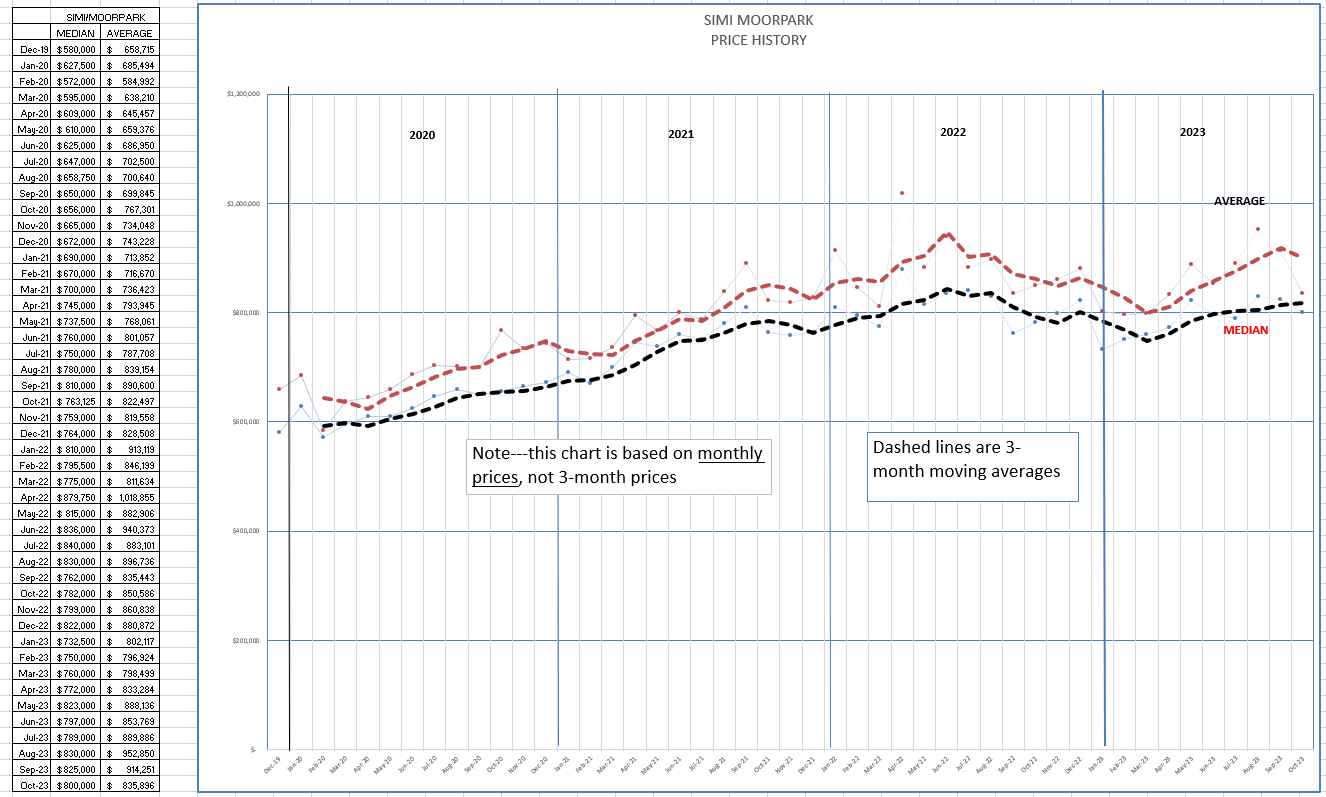
Simi Valley/Moorpark has a different picture. Median pricing remains strong, while Average pricing shows weakness. This is an effect of the mix of homes sold, high price versus low price. It is shown in the chart by the expanding gap between the two lines. Take away the higher priced properties and the median will not be challenged due to the majority of homes are sold near that median price, but the average price will decline. That seems to be what is happening.
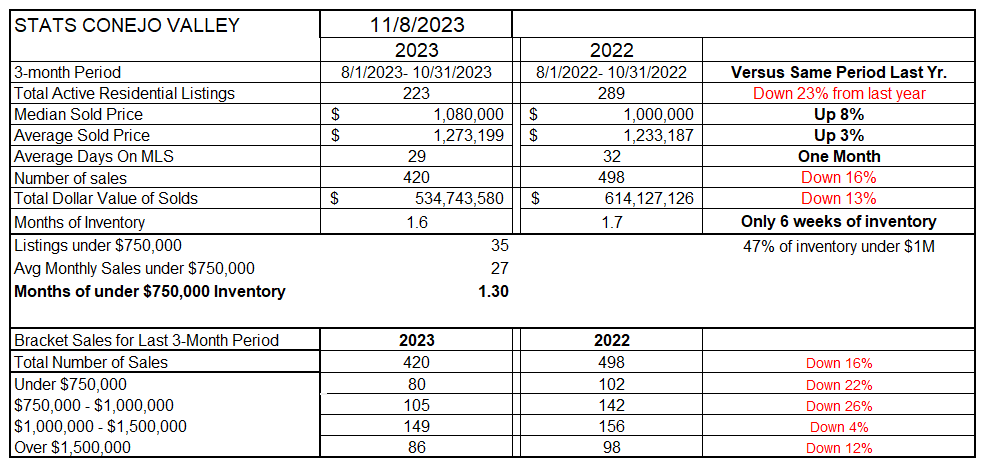
FInally, I will go to the statistical tables, but need to give you a warning that the numbers may be confusing. These numbers utilize three-month averages. While that keeps one month from causing a blip, it also causes us to not percieve changes as quickly. That is particularly true for pricing, which has been volatile. Median prices are up 8% year over year, but they are currently in steep decline month by month. Homes on average remain in the MLS for only one month. This graph shows sales down only 16% due to the three-month averaging. Look back at the sales charts above to see the consistent drop in sales compared to previous years. There is a lot of confusing information out there, and even comparing my informartion chart to chart can get confusing. That’s why just sending you the numbers is not a good idea, I have to include an analysis.
We still have only 6 weeks of inventory, but remember that computation is affected by both the inventory and sales. As sales decline, the Months Of Inventory will increase. As inventory increases, the Months of Inventory will increase. Both are happening.
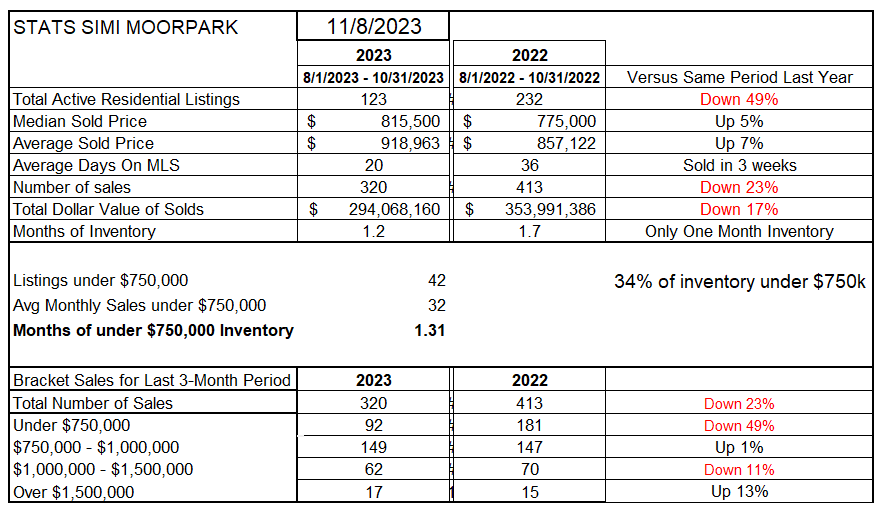
SImi Valley/Moorpark are similar. Inventory is down considerably, only half of last year’s number. In this chart, prices are up 5-7% compared to last year, but prices lately are beginning to decline. This 3-month analysis shows the number of sales down 23% compared to last year, but the cummulative chart above shows sales down 39% compared to normal years. 34% of the available inventory is below $750,000, while the bottom of this table shows sales in that category down 49% compared to the same three months last year. I thought about not including these tables as they are confusing the issue, but I have had them available to you for so long I included them for that reason. Like I said, the information out there can be very confusing.
The housing market is confusing, because different statistics trying to measure the market are confusing us. How much is my hosue worth? I get four different computerized valuations emailed to me every month, and they are wildly different. You now have my read on the market. I am sure you can find others who disagree. How about you?
I would love to hear from you, what is your opinion?
Have a very Happy Thanksgiving. By the time I weigh in next month, I hope not to weigh much more than I do today. 😉
Chuck