Graphs show us what happened in the past. For some, like Case-Shiller, the information is very far behind. The further you go back, the more accurate the information, but the less useful to forecast current market conditions.
As year-end approaches, the annual percentage information gets diluted by the increases or decreases that have taken place during the entire year. It makes more sense to look at recent data, judging the past month versus the previous month. However, when we have a market with normal seasonal ups and downs, it is difficult to take that into account.
I think it makes more sense to judge a shorter period of time, 2-3 months, and compare that against the same time period for the previous year. That is why these numbers may be a little different from Case-Shiller.
Of course, another reason is that our home prices are mostly influenced by our local market. (All real estate is local.) It is nice to know how the country is doing, or the major population markets, but we don’t sell in those markets. Our clients don’t live in those markets. What our clients are concerned with is what their home is worth, what did that home down the block sell for? That requires a good real estate agent, with information specific to that particular local area.
These figures come closer than the major reports, as they deal with our two major valleys, Conejo and Simi-Moorpark. Forecasts are usually made by analyzing the present graphs and statistics to what has happened in the past, and to extrapolate how the current information may forecast the future, particularly for the same time of year.
Let’s see first how the inventory is doing.
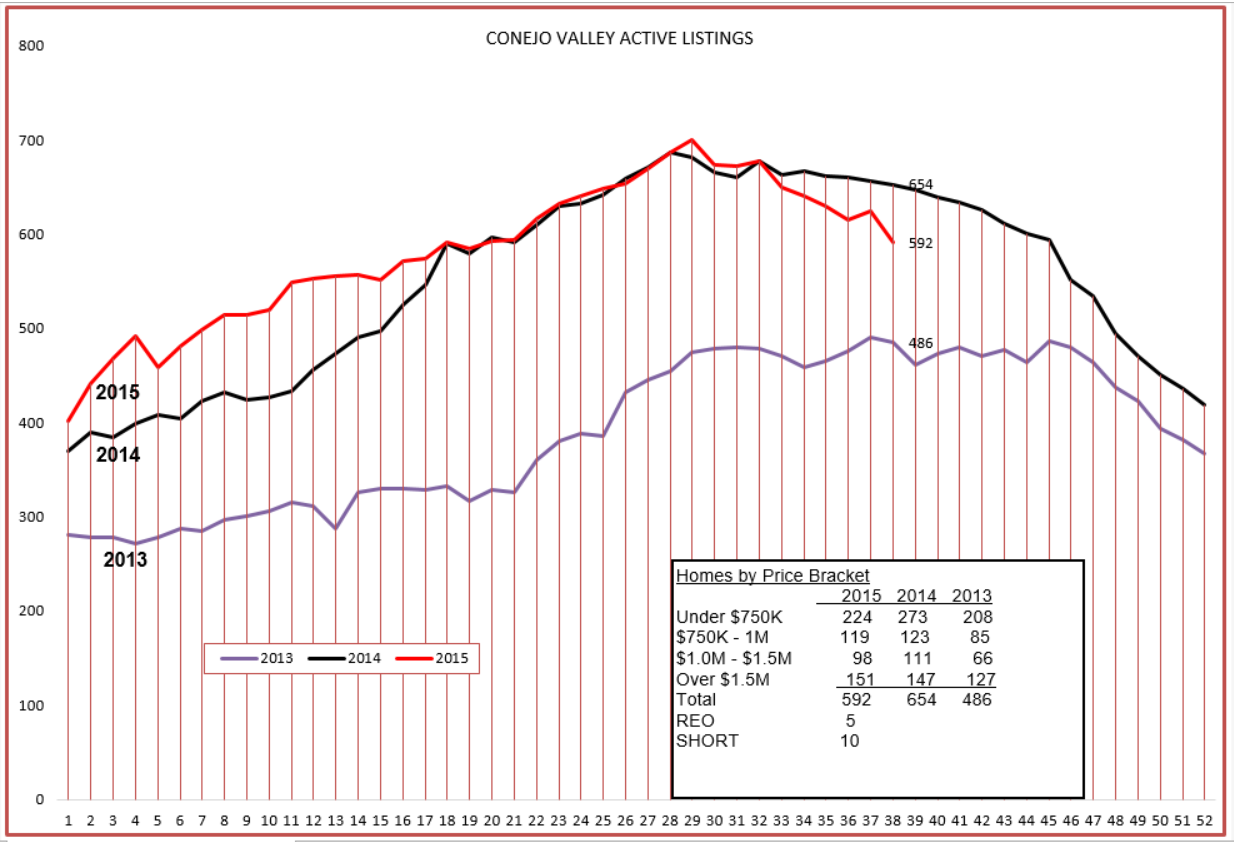
The active inventory is falling, and is falling strongly. More homes are being sold than are coming onto the market. Yes, that is expected this time of year, but considering the graph of active listings has been a mirror image of 2014 for most of the year, the declining trend in inventory shows us finishing this year, and beginning next year, at a much lower level. In the past month, the largest decline has been in the $750,000 to $1 million range, the meat and potatoes of our market.
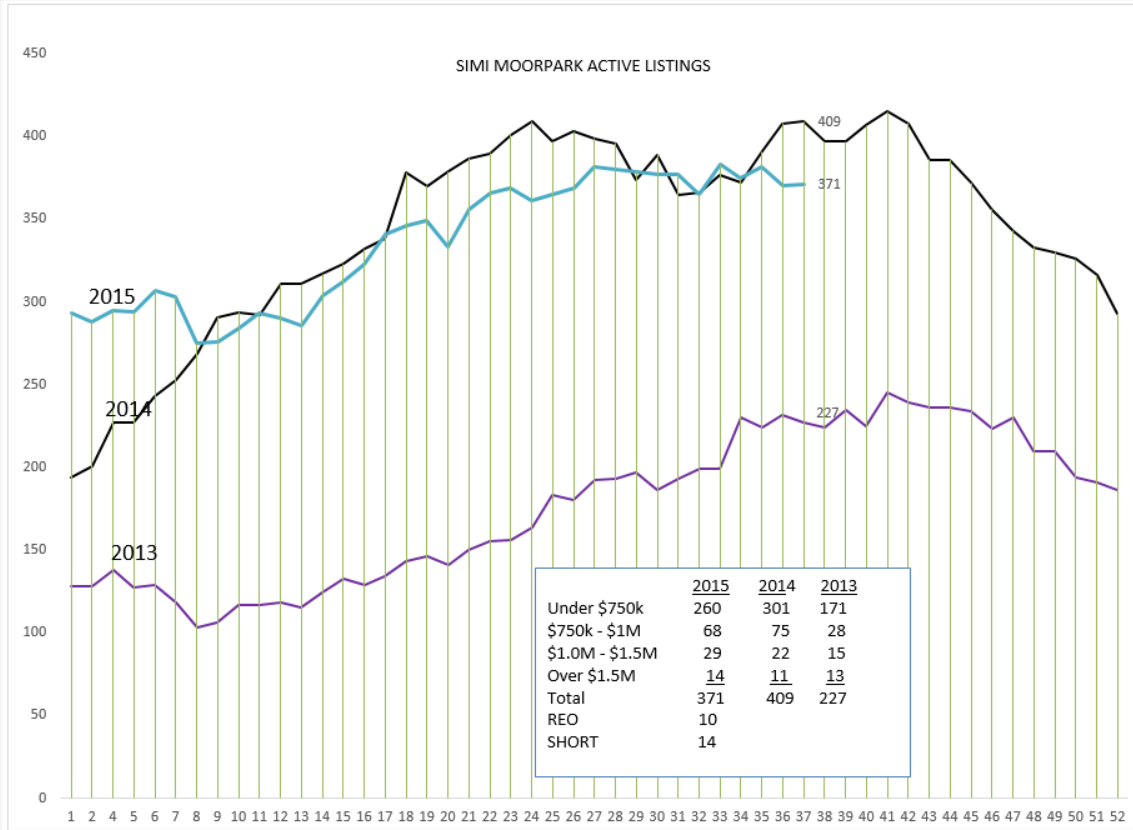
The inventory graph for Simi-Moorpark has had a mind of its own this year. The inventory has been somewhat flat-lined for most of the year, starting at 300 and currently under 400. The inventory is not nearly as low as it was for 2013, but still shows little upward or downward movement. The meat and potatoes prices for Simi Moorpark are mid-$500,000, and all price groups are stable.
Let’s compare the inventory available in the graphs above to the closed escrow graphs to see if we can learn a little more.
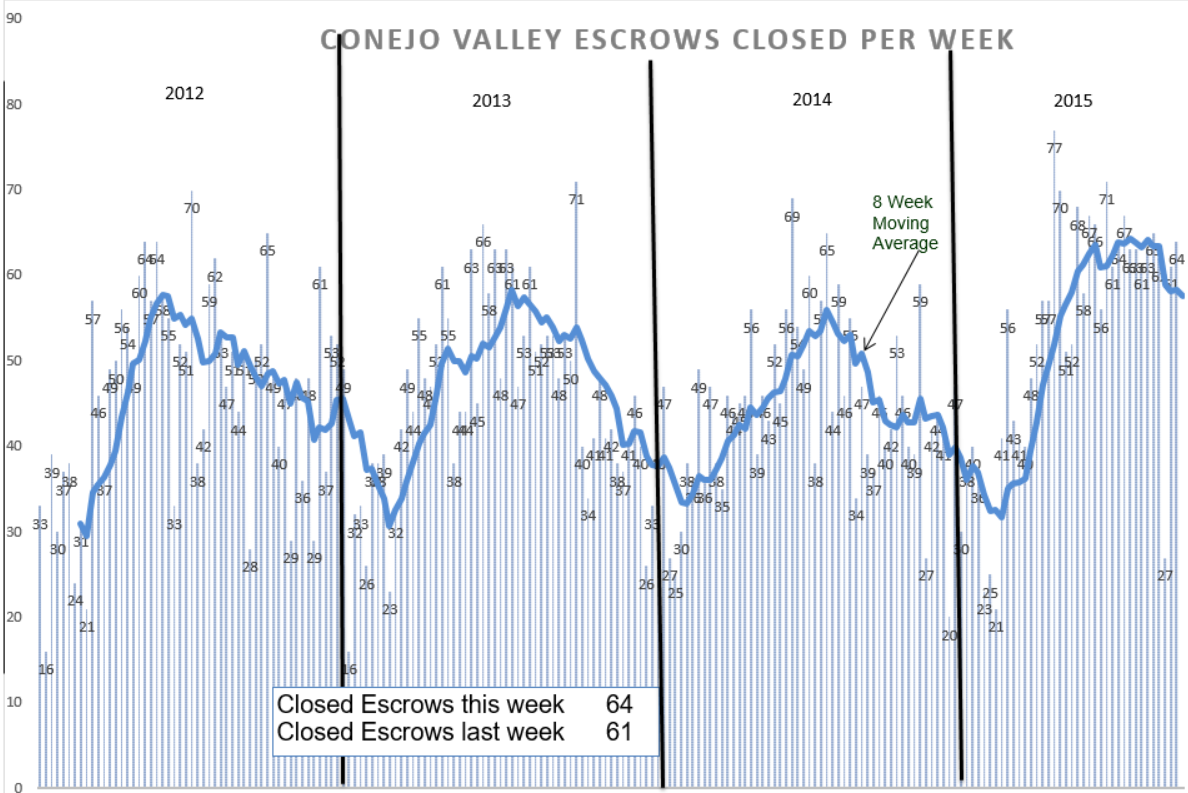
Strong sales, very strong sales for Conejo Valley. Visually, it is apparent that not only did we start off the year with a month of weakness, but that we made that up as the year progressed, and are currently enjoying a plateau of business that shows a strong market as we go into the final quarter.
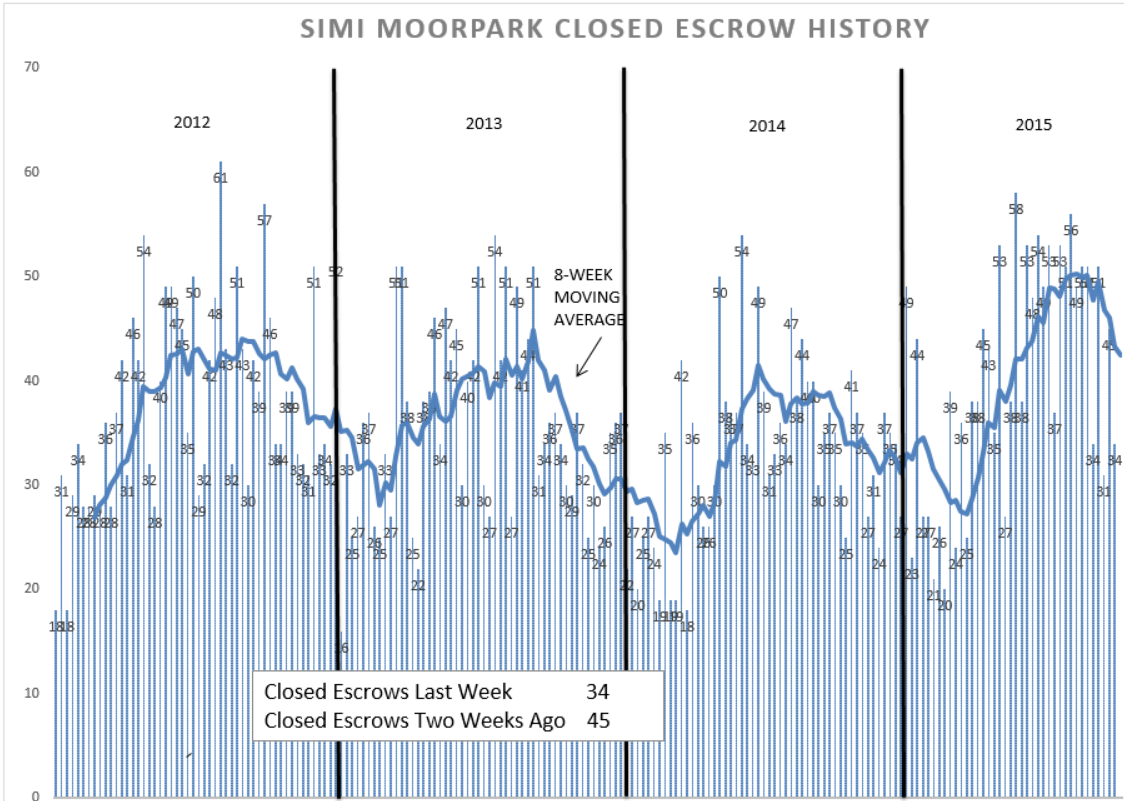
Simi-Moorpark shows a similar strength, and the market is quieting down from the summer peak. As we shall see, Simi-Moopark has experienced a strong price increase from last year, and that caused the market to quiet down a little.
Let’s look how average and median prices have progressed for the past couple of years.

Inventory and demand and price are intertwined. A stable inventory coupled with strong sales pushes prices upward. Conejo Valley average prices have climbed from $422,000 in January 2012 to currently $668,000, an increase of 63%. Median prices climbed from $540,000 to $822,000, an increase of 52%. If you have buyers wondering if buying a home is a good investment, show them these numbers.

Simi-Moorpark average prices have climbed from $345,000 in January 2012 to currently $514,000, an increase of 49%. Median prices climbed from $389,000 to $548,000, an increase of 41%.
Graphs are good, but when you talk to people, you have to use numbers. Here are the current statistics to use.

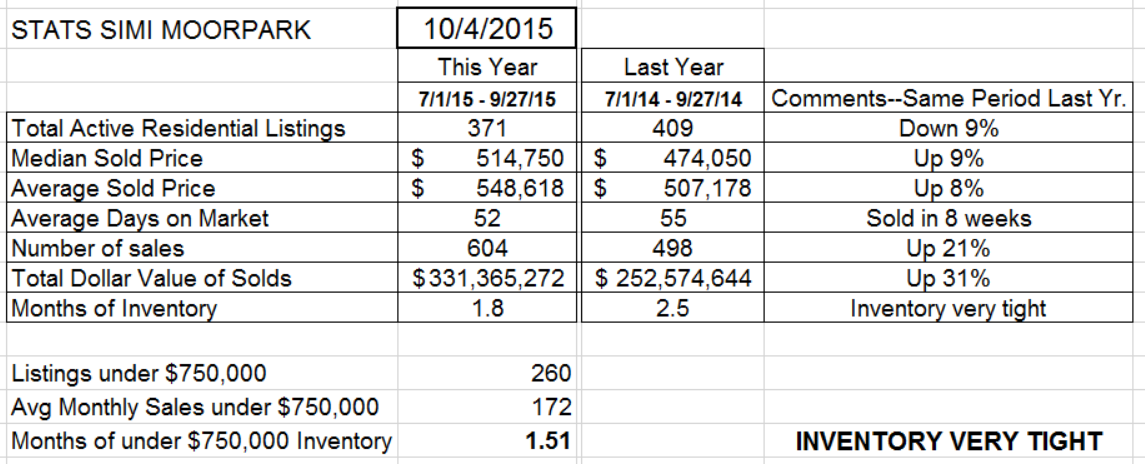
You should have the following statistics at your fingertips to explain our general market:
Inventory—down 9% from last year.
Sales—up 20% from last year.
Prices—up 10% from last year.
The forecast for the future—more of the same. Not a crazy strong market, but a healthy market.
Have a prosperous week.
Chuck