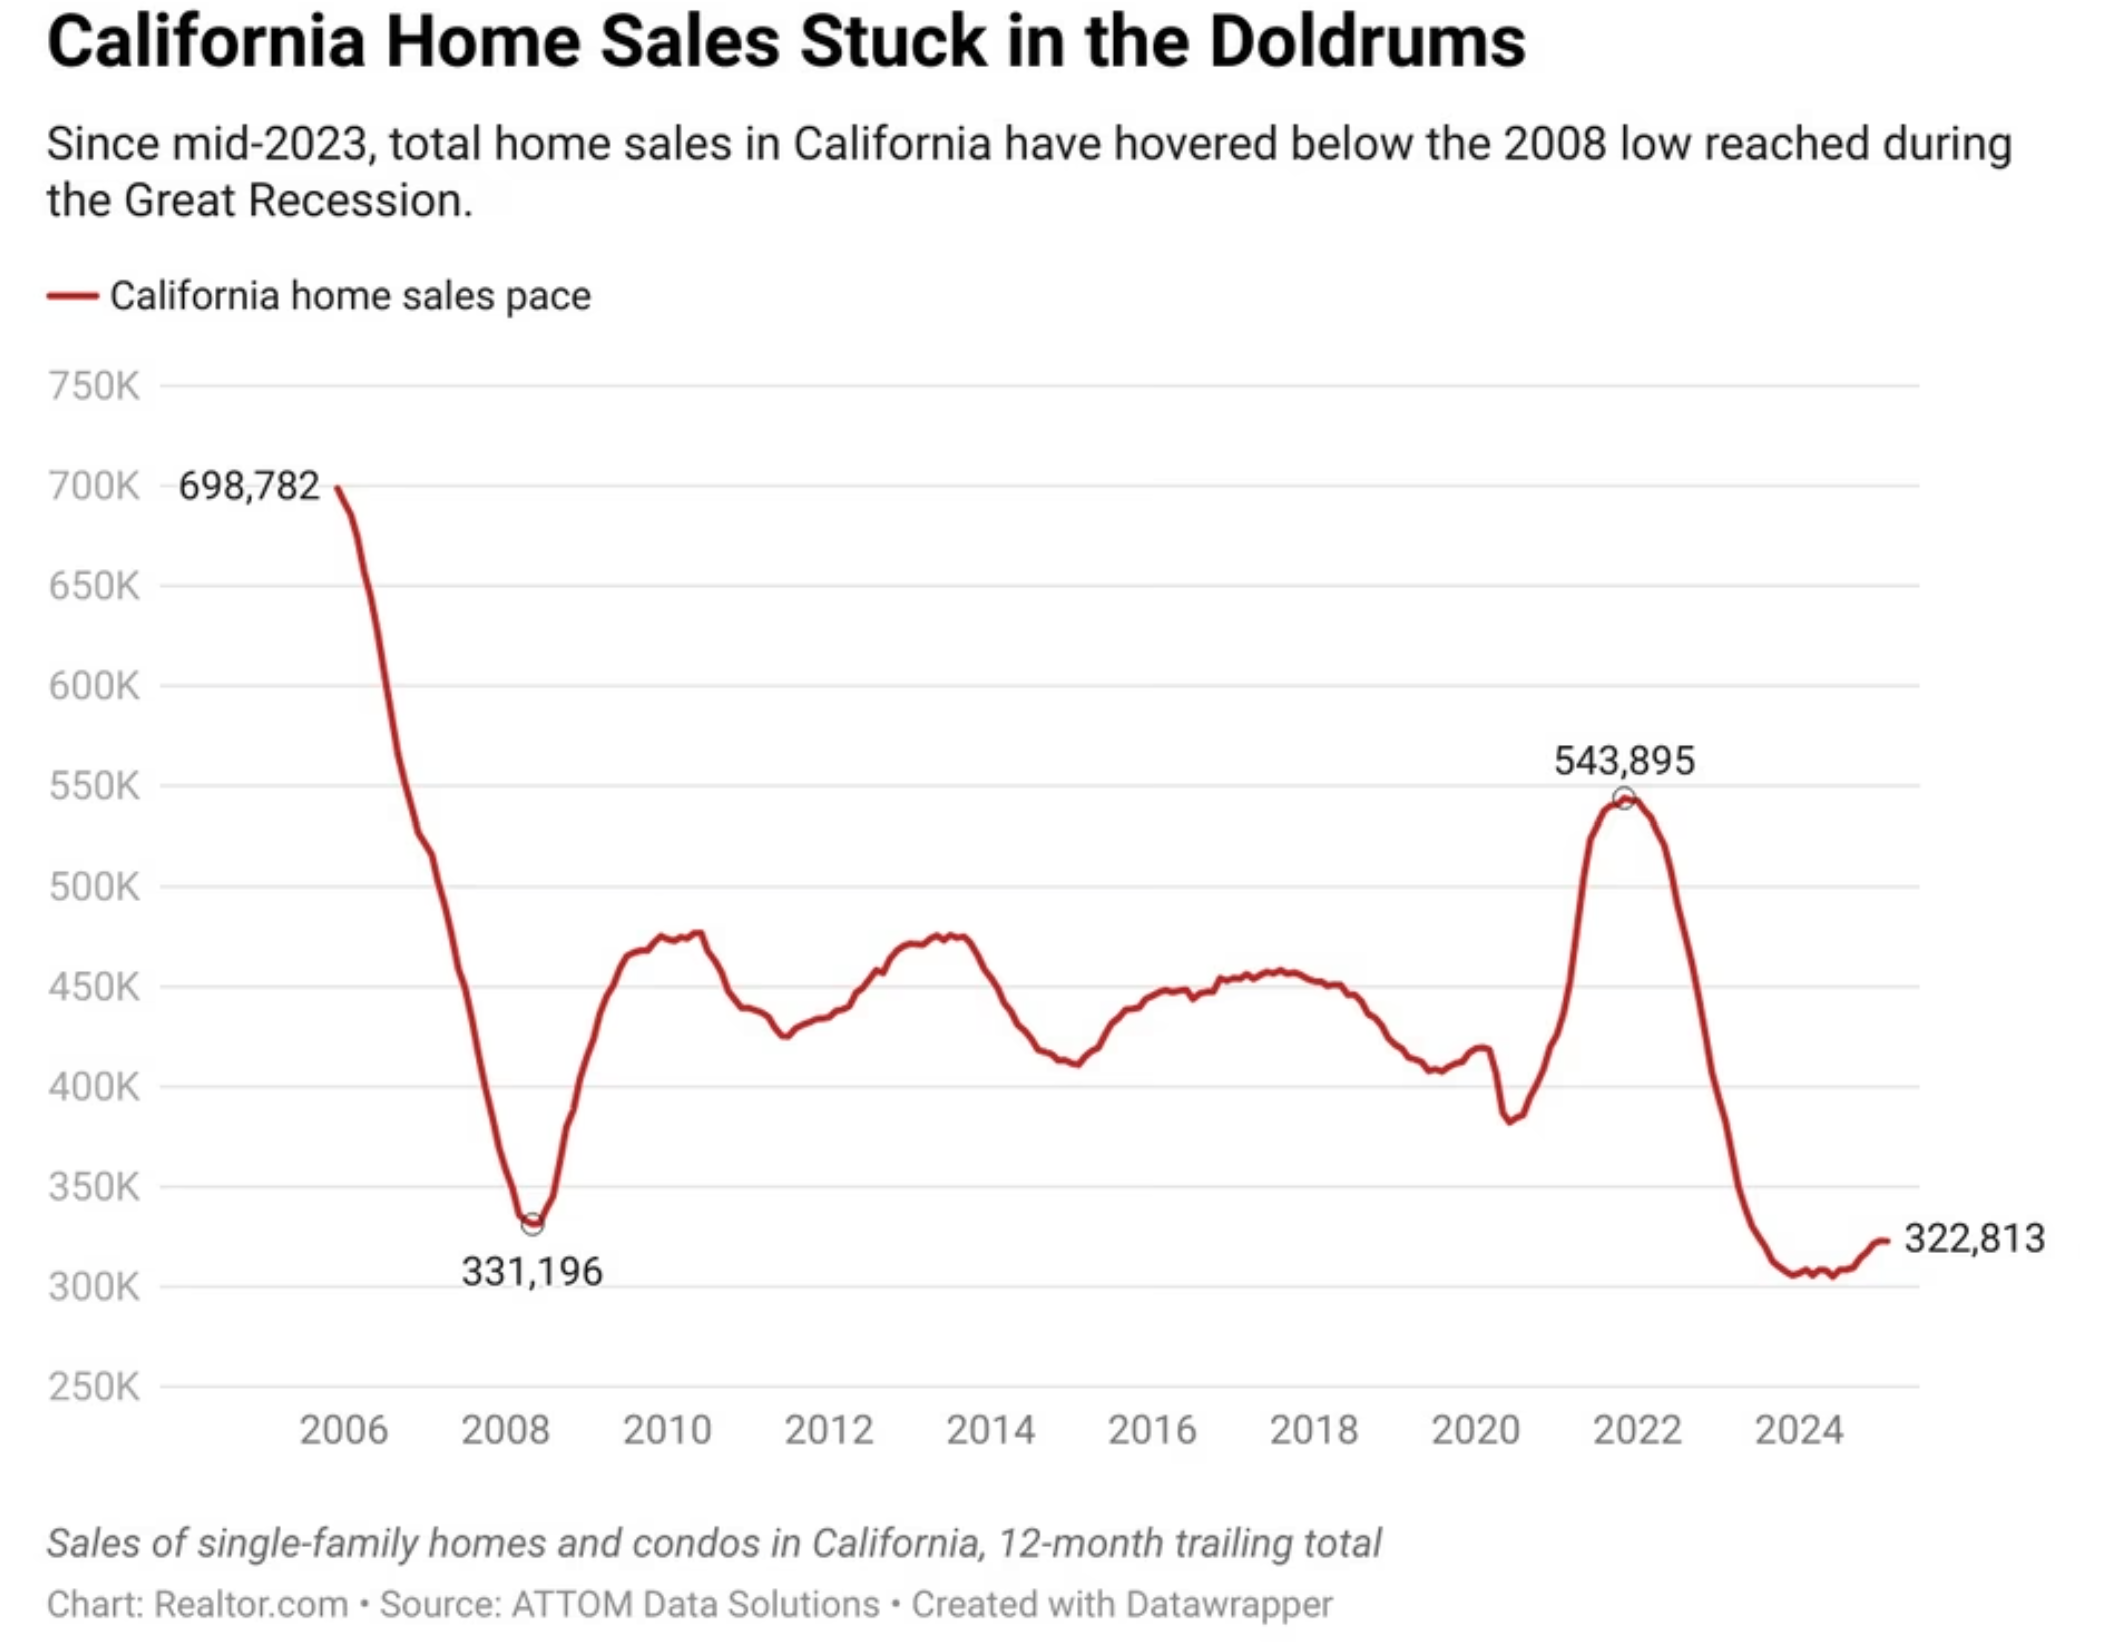
Let’s begin with a chart from someone else—Realtor.com—same picture—same analysis. This graph talks about the number of sales in California from 2006 to 2024.
Compare that to another chart for how sales are going in Ventura County from 2015 to 2024. 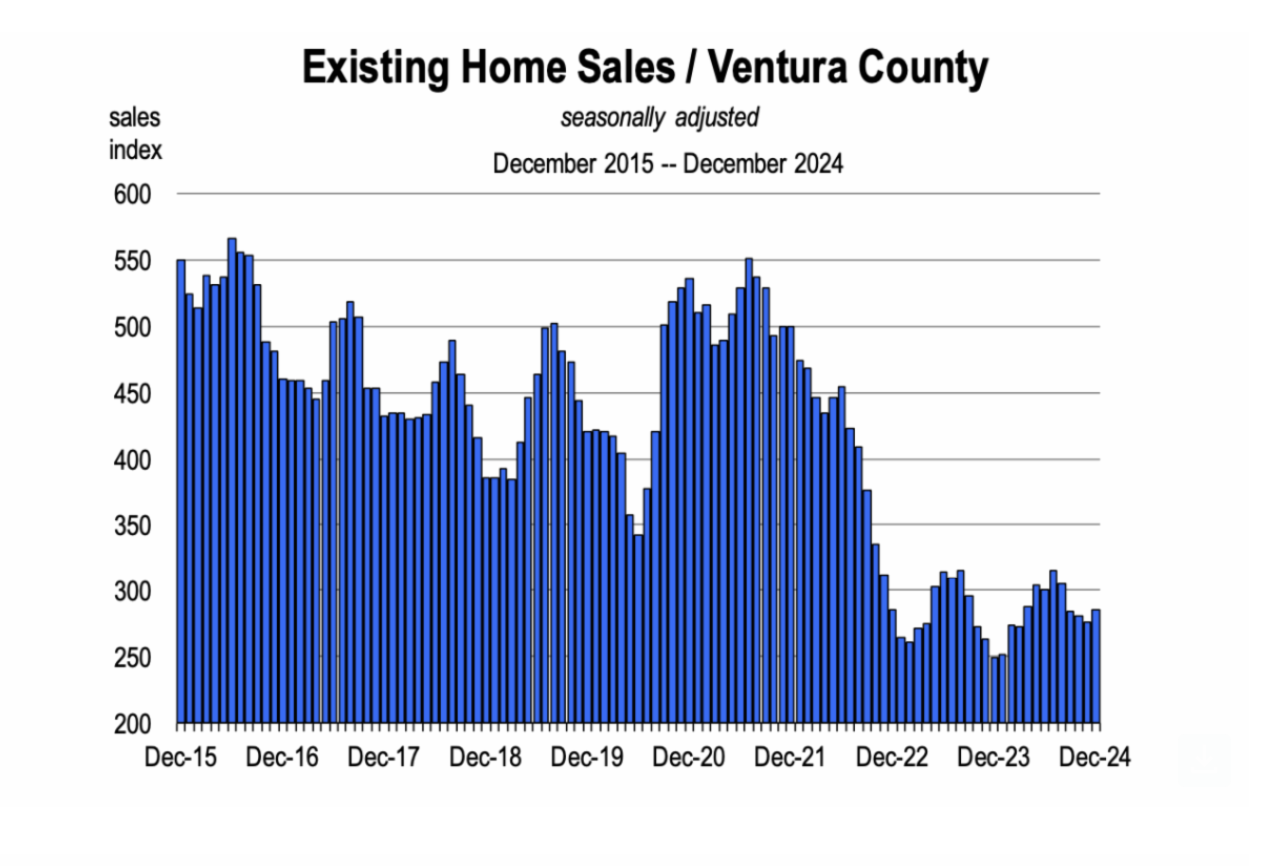
Both charts send the message that the last two years have been recent historic lows.
These chart are pictures of the past. Sales this year will probably look a lot like the last two years.
But some things are changing. A lot.
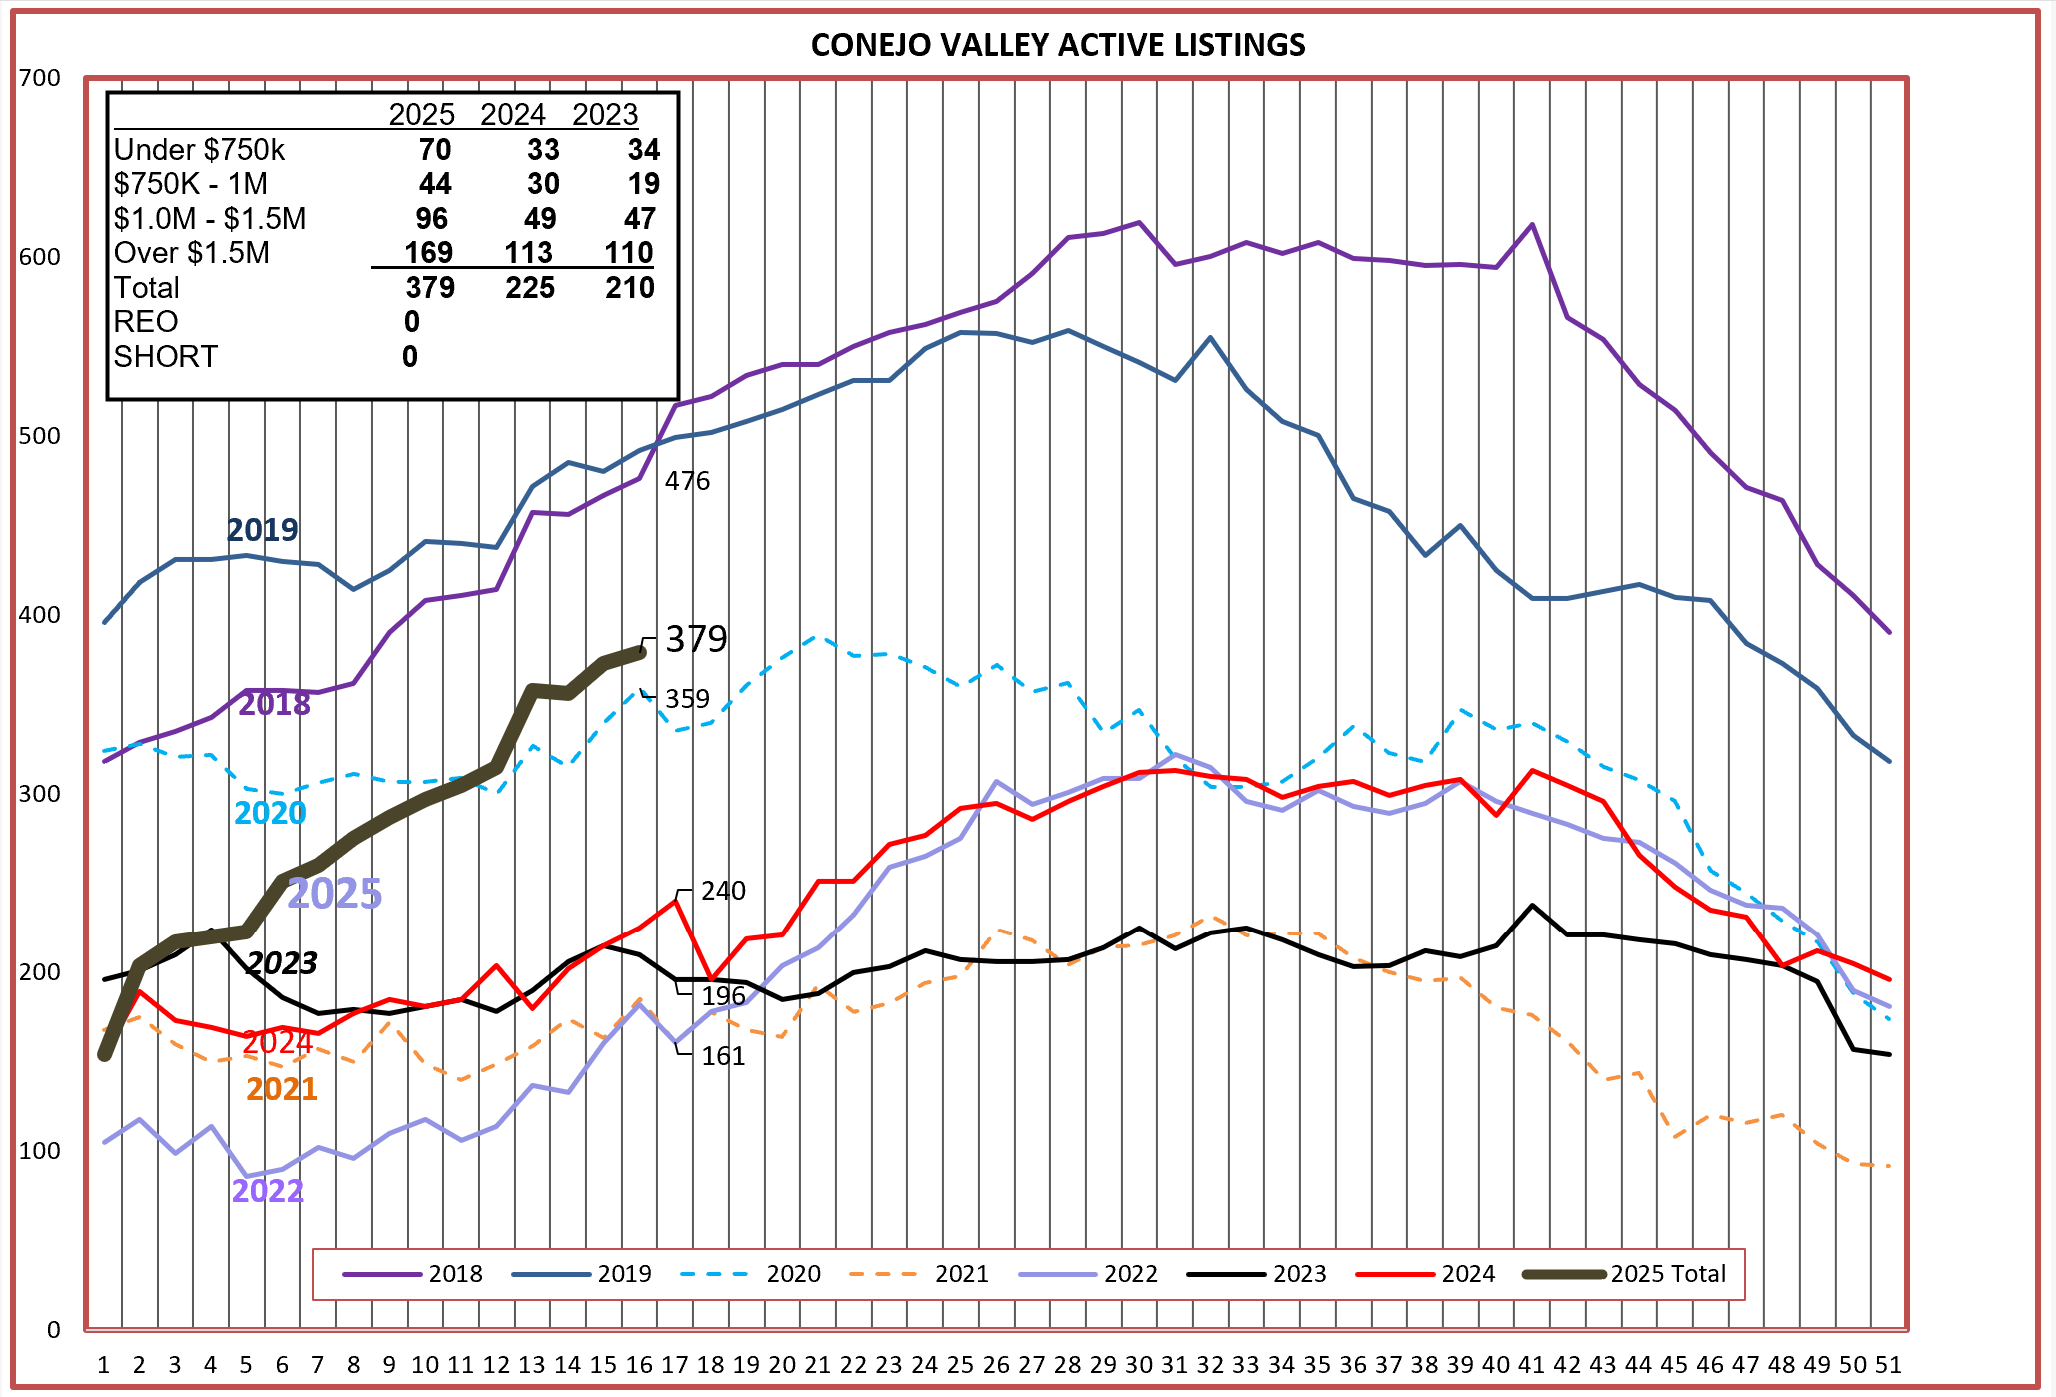
Ever since COVID we have been short on inventory. That problem is being resolved, with Conejo inventory up 68% versus a year ago. Sales numbers were also up versus a year ago, up 14%. Looking at the bottom of this table, we see that the major contributor to increased sales is the highest tranche of home sales, those over $1.5 million. In addition, almost half of our current inventory is made up of homes in that same over-$1.5 million category. Compared to last year, prices continued to rise, up 7-9%. That increase has been boosted by how many very high priced homes are being sold. It is not a measure of how the price of an individual home has risen, it is only an average, or a mean.
The months of inventory number, inventory divided by monthly sales, has gained a month over last year, and is approaching the 3.0 number that many consider to be a balanced market, with buyer and seller having equal negotiating power.

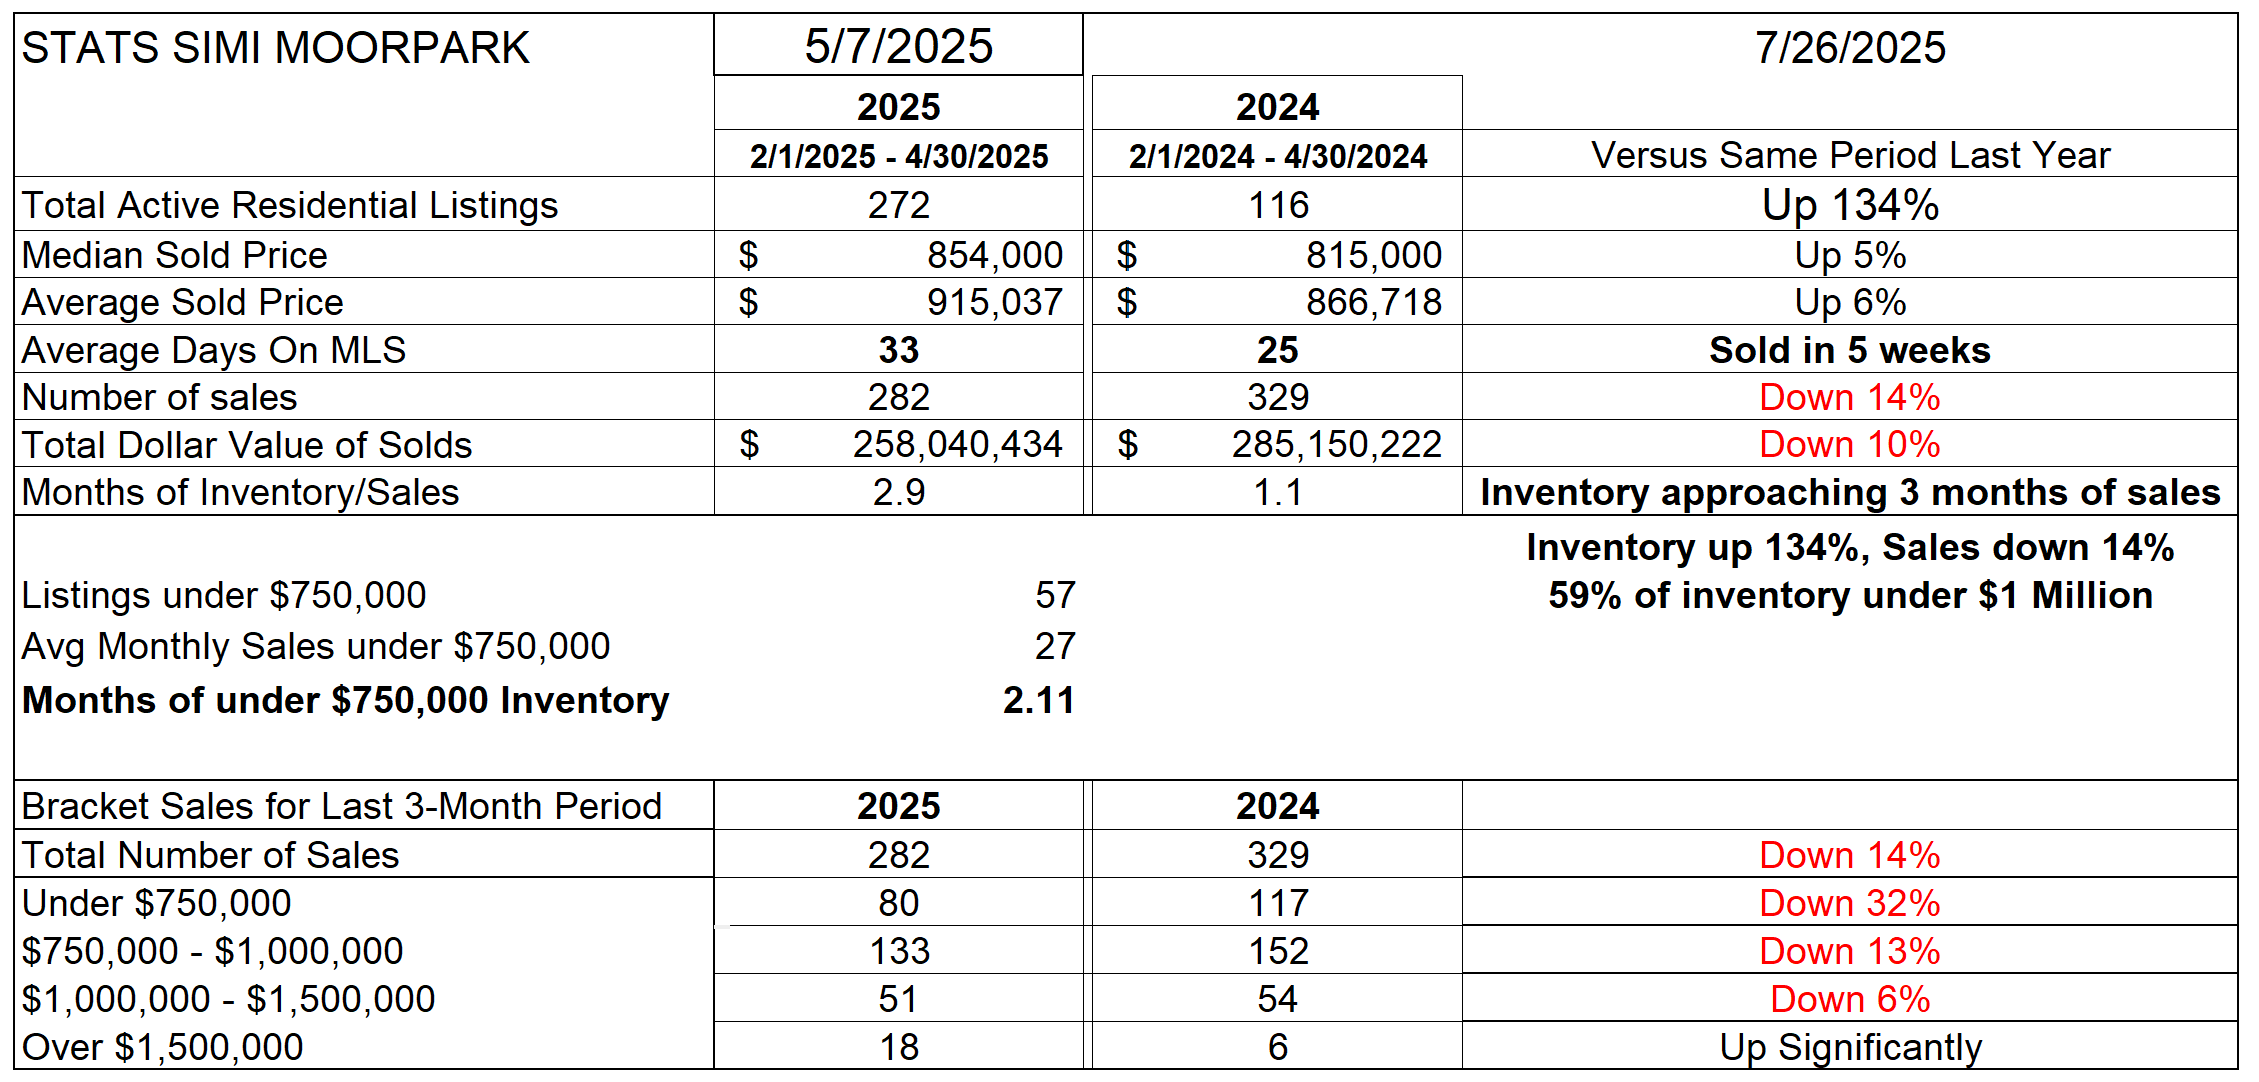
In SImi Moorpark, the inventory shortage experienced over the past couple of years was more pronounced. Inventory is now climbing at an even stronger clip than Conejo, up 134% more than a year ago. Months of inventory divided by monthly sales is also close to 3.0 months . This is a major increase, as a year ago this number was only 1.1. months. Sales are down compared to last year by 14%. Prices increased 5-6% from a year ago, sort of in line with inflation. Except for the highest price tranche, the number of sales in every price category was lower. The majority of inventory in Simi/Moorpark is below $1 million.
Since inventory had the most pronounced change, let’s look into inventory a little closer. In the Conejo, we are near double the inventory available for the last two years, and listings are climbing strongly in line with the pre-covid years of 2018 and 2019.
Simi/Moorpark active inventory is almost three times the 2023 number, Inventory should no longer be considered a limiting factor to sales.

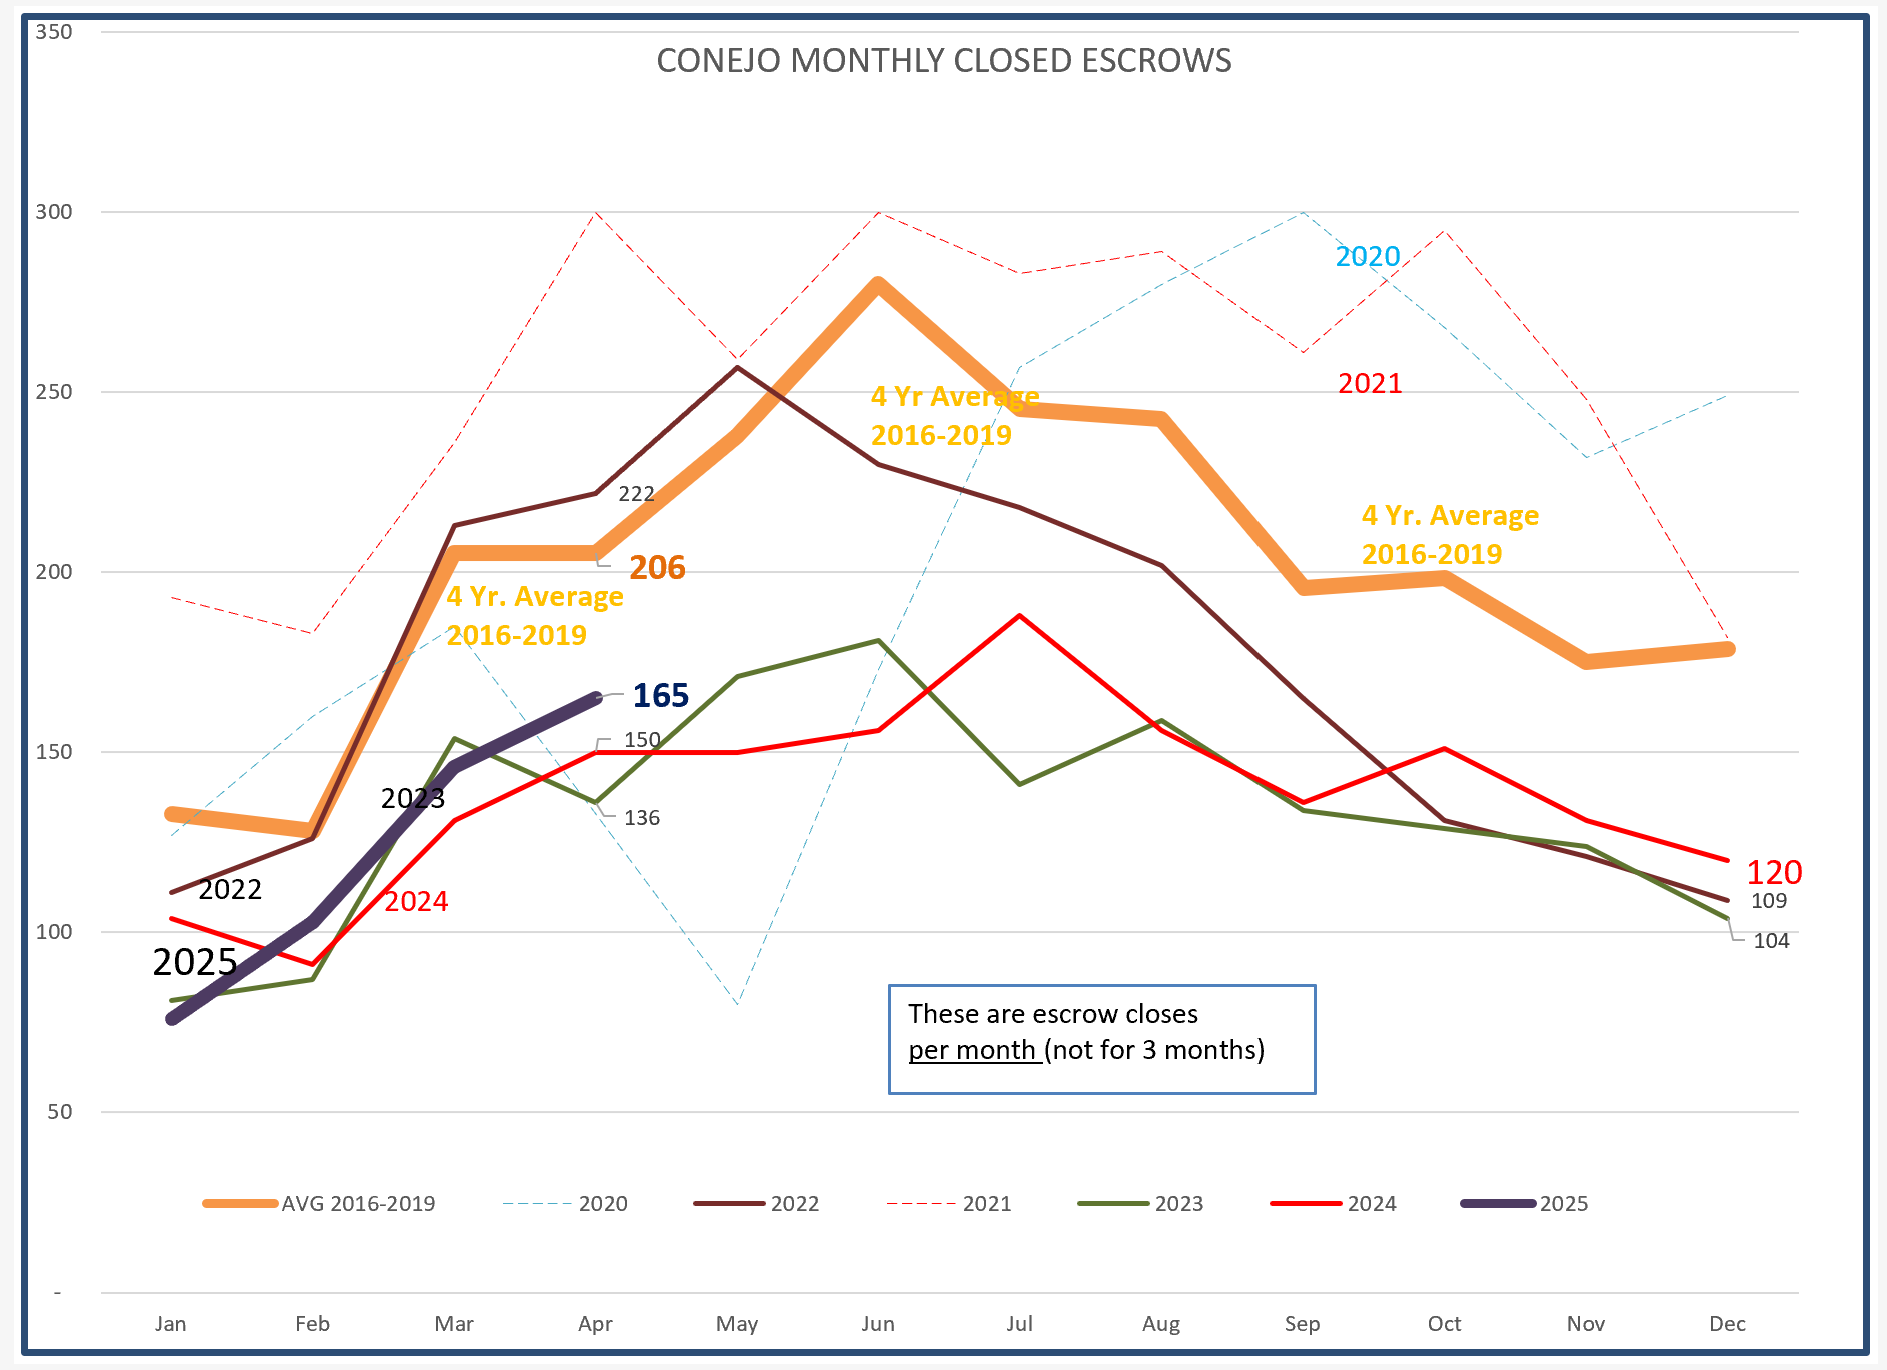
So how are sales doing? It is following the annual pattern as we progress through the year into the summer months, but 25% below what the pre-covid numbers averaged.
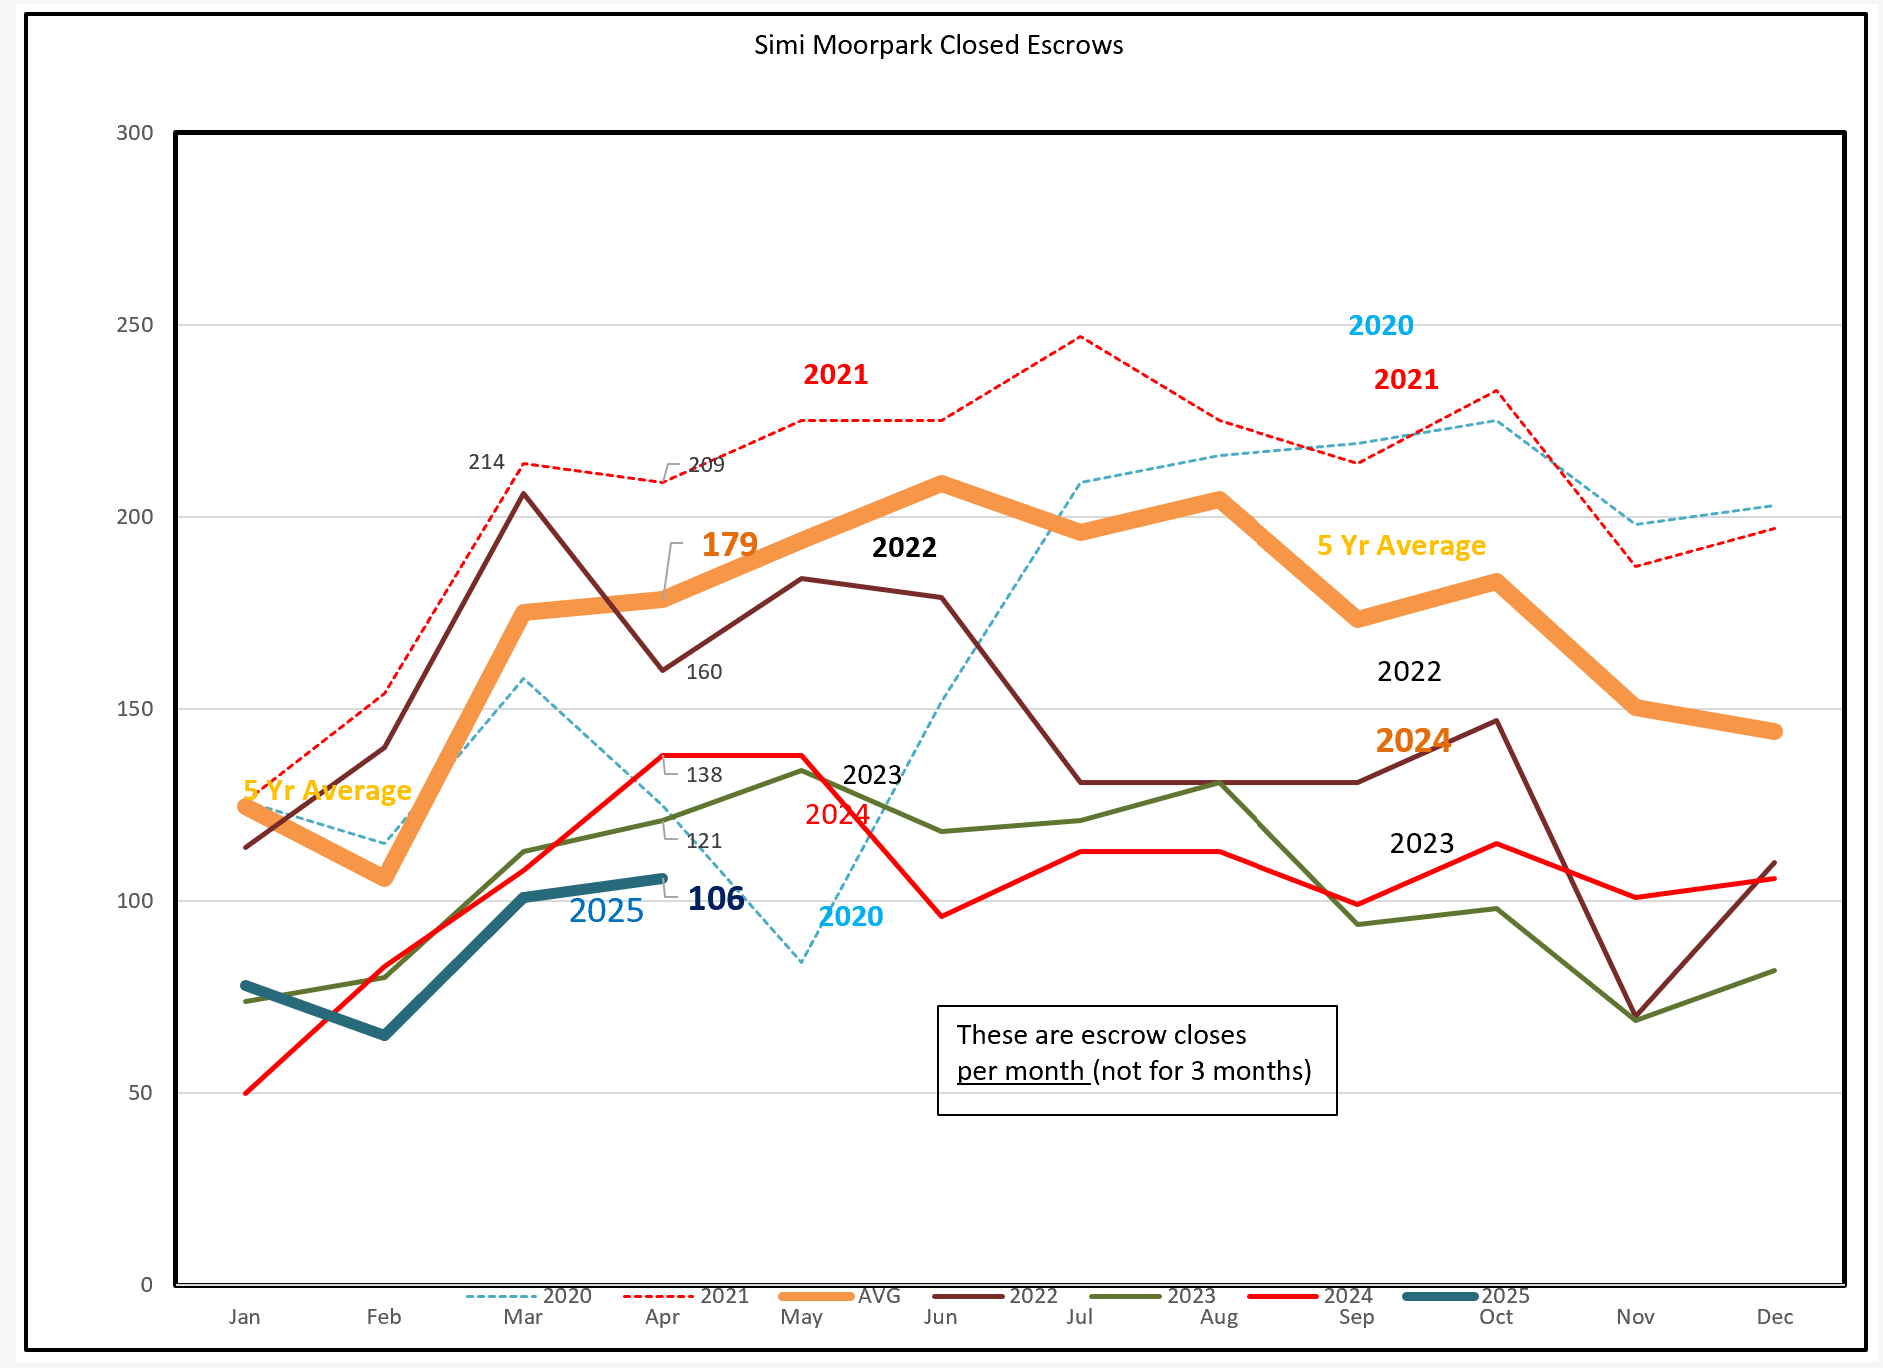
SImi/Moorpark on the other hand is about half of the pre-covid averages.
What’s the difference between the two areas? The amount of very expensive houses being sold. Very expensive homes are often bought for all cash, or with shorter-term mortgage loans. The current high rate of interest on 30-year mortgages is limiting the ability of first-time buyers to purchase homes in the average price range. Add that to the limited tax deductions on mortgage interest payments due to SALT caps of $10,000 per year make it more difficult to afford homes, with affordability now down to only 15% in California.
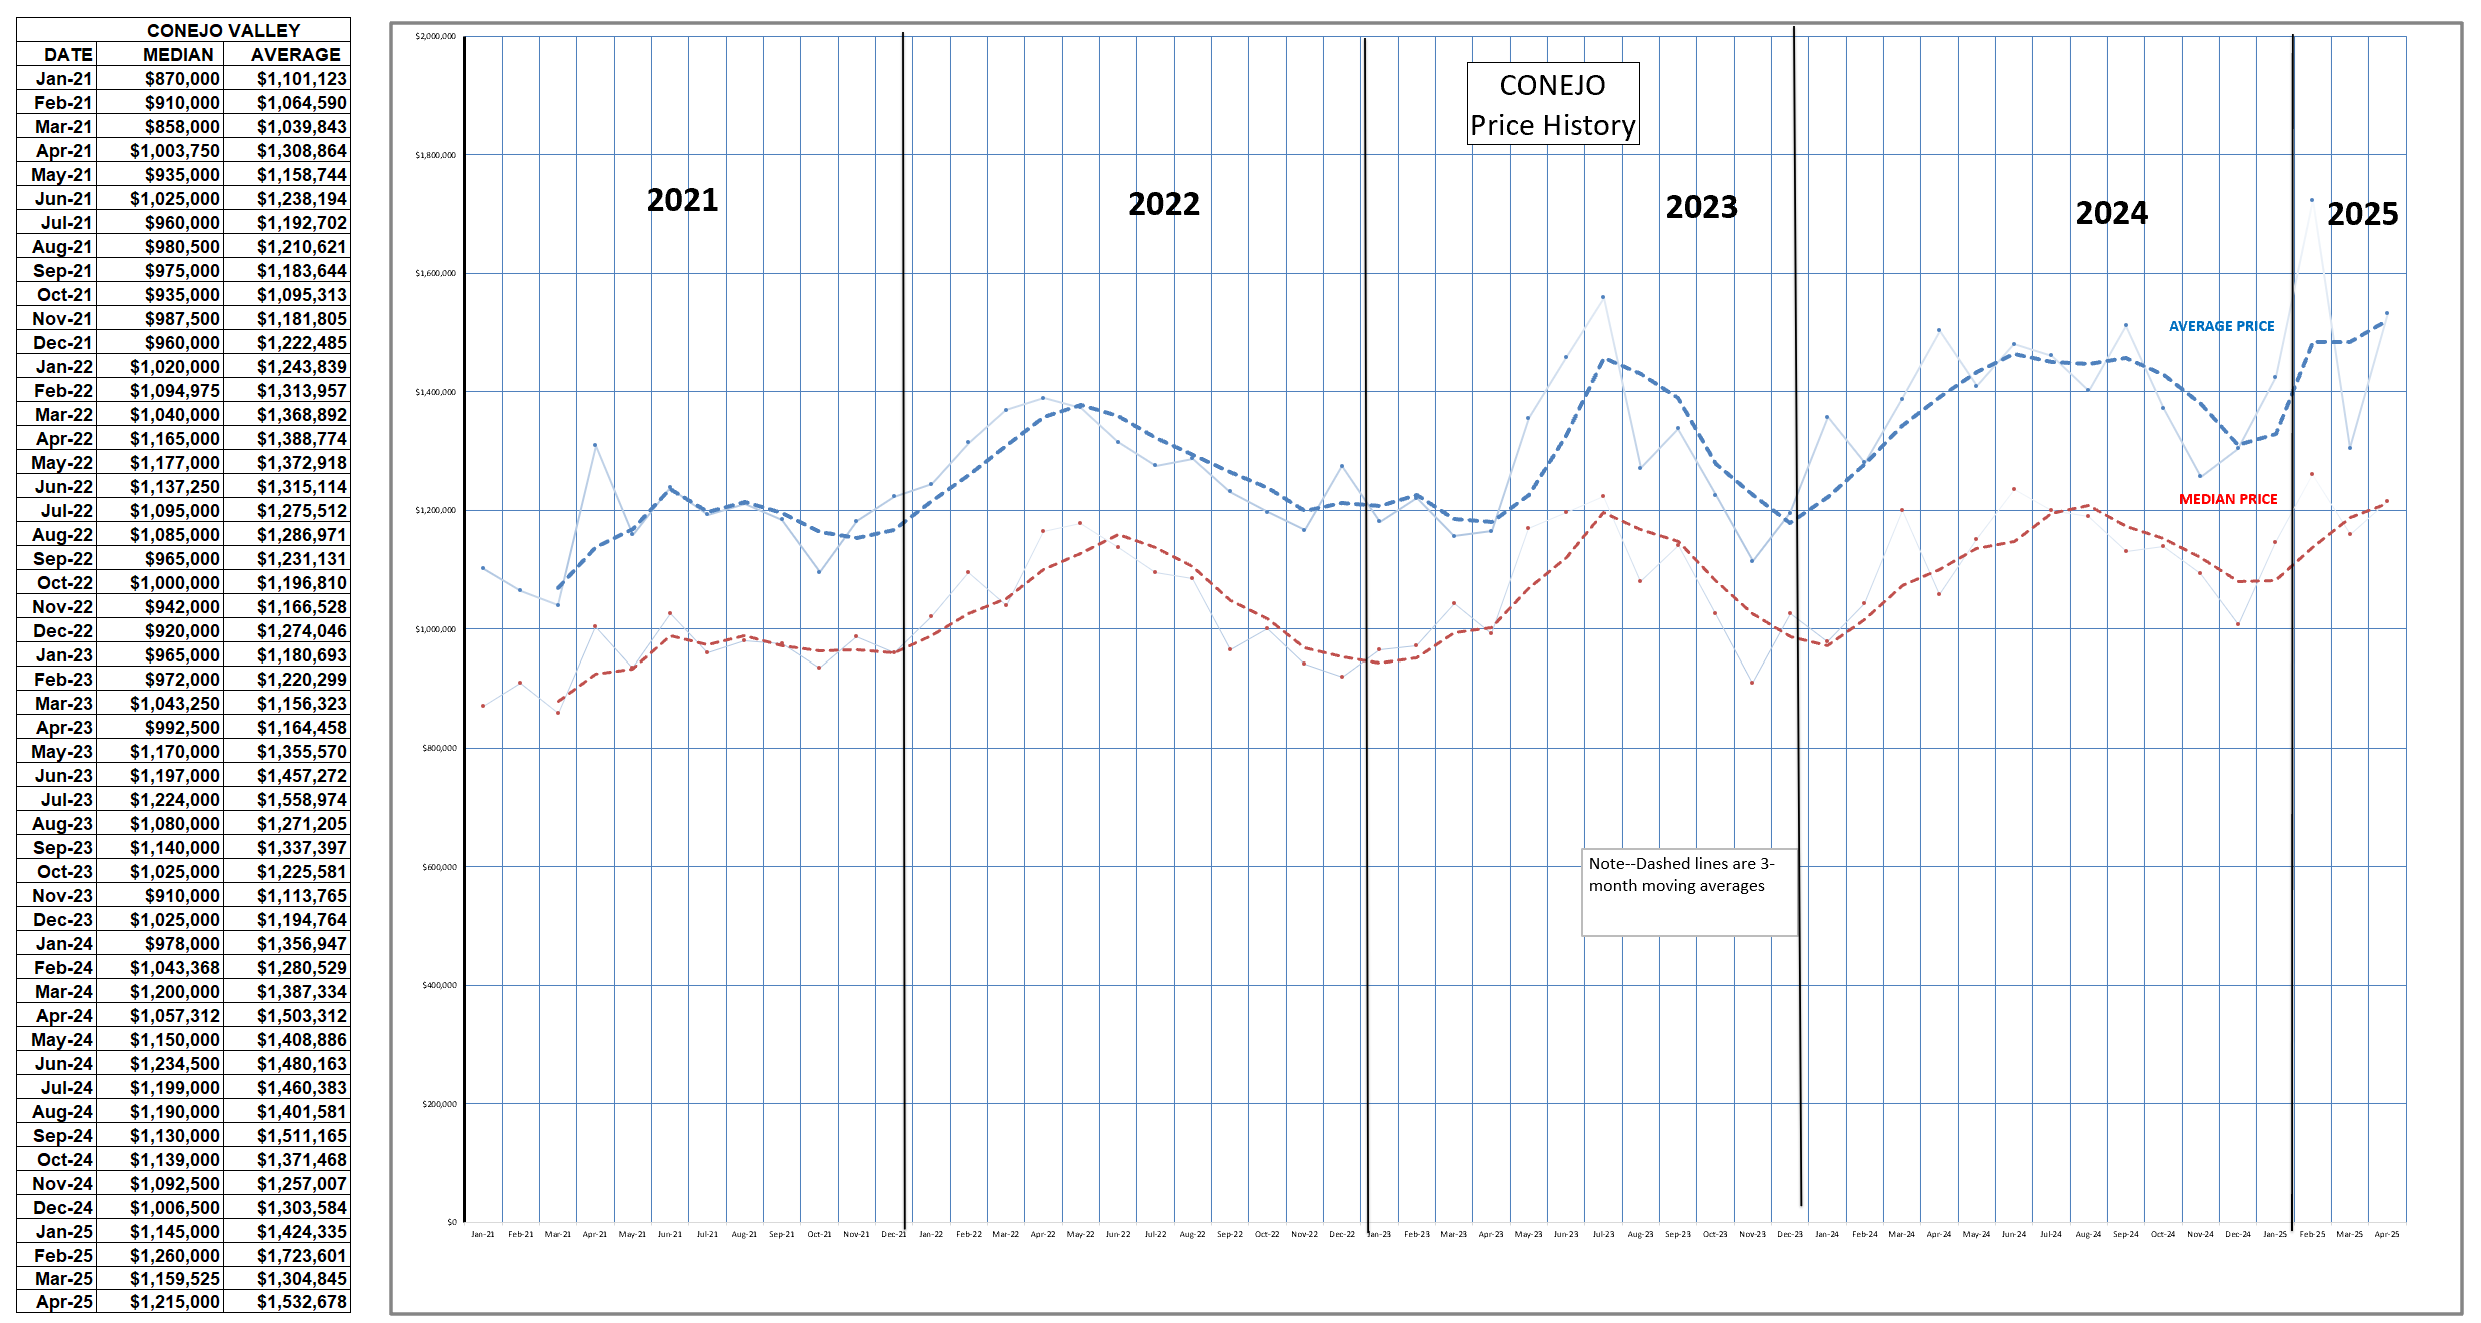
Looking at prices, we see the spread between Median and Average prices increasing, again because of the relatively strong sales of highest price homes. Prices continue to increase. For now.
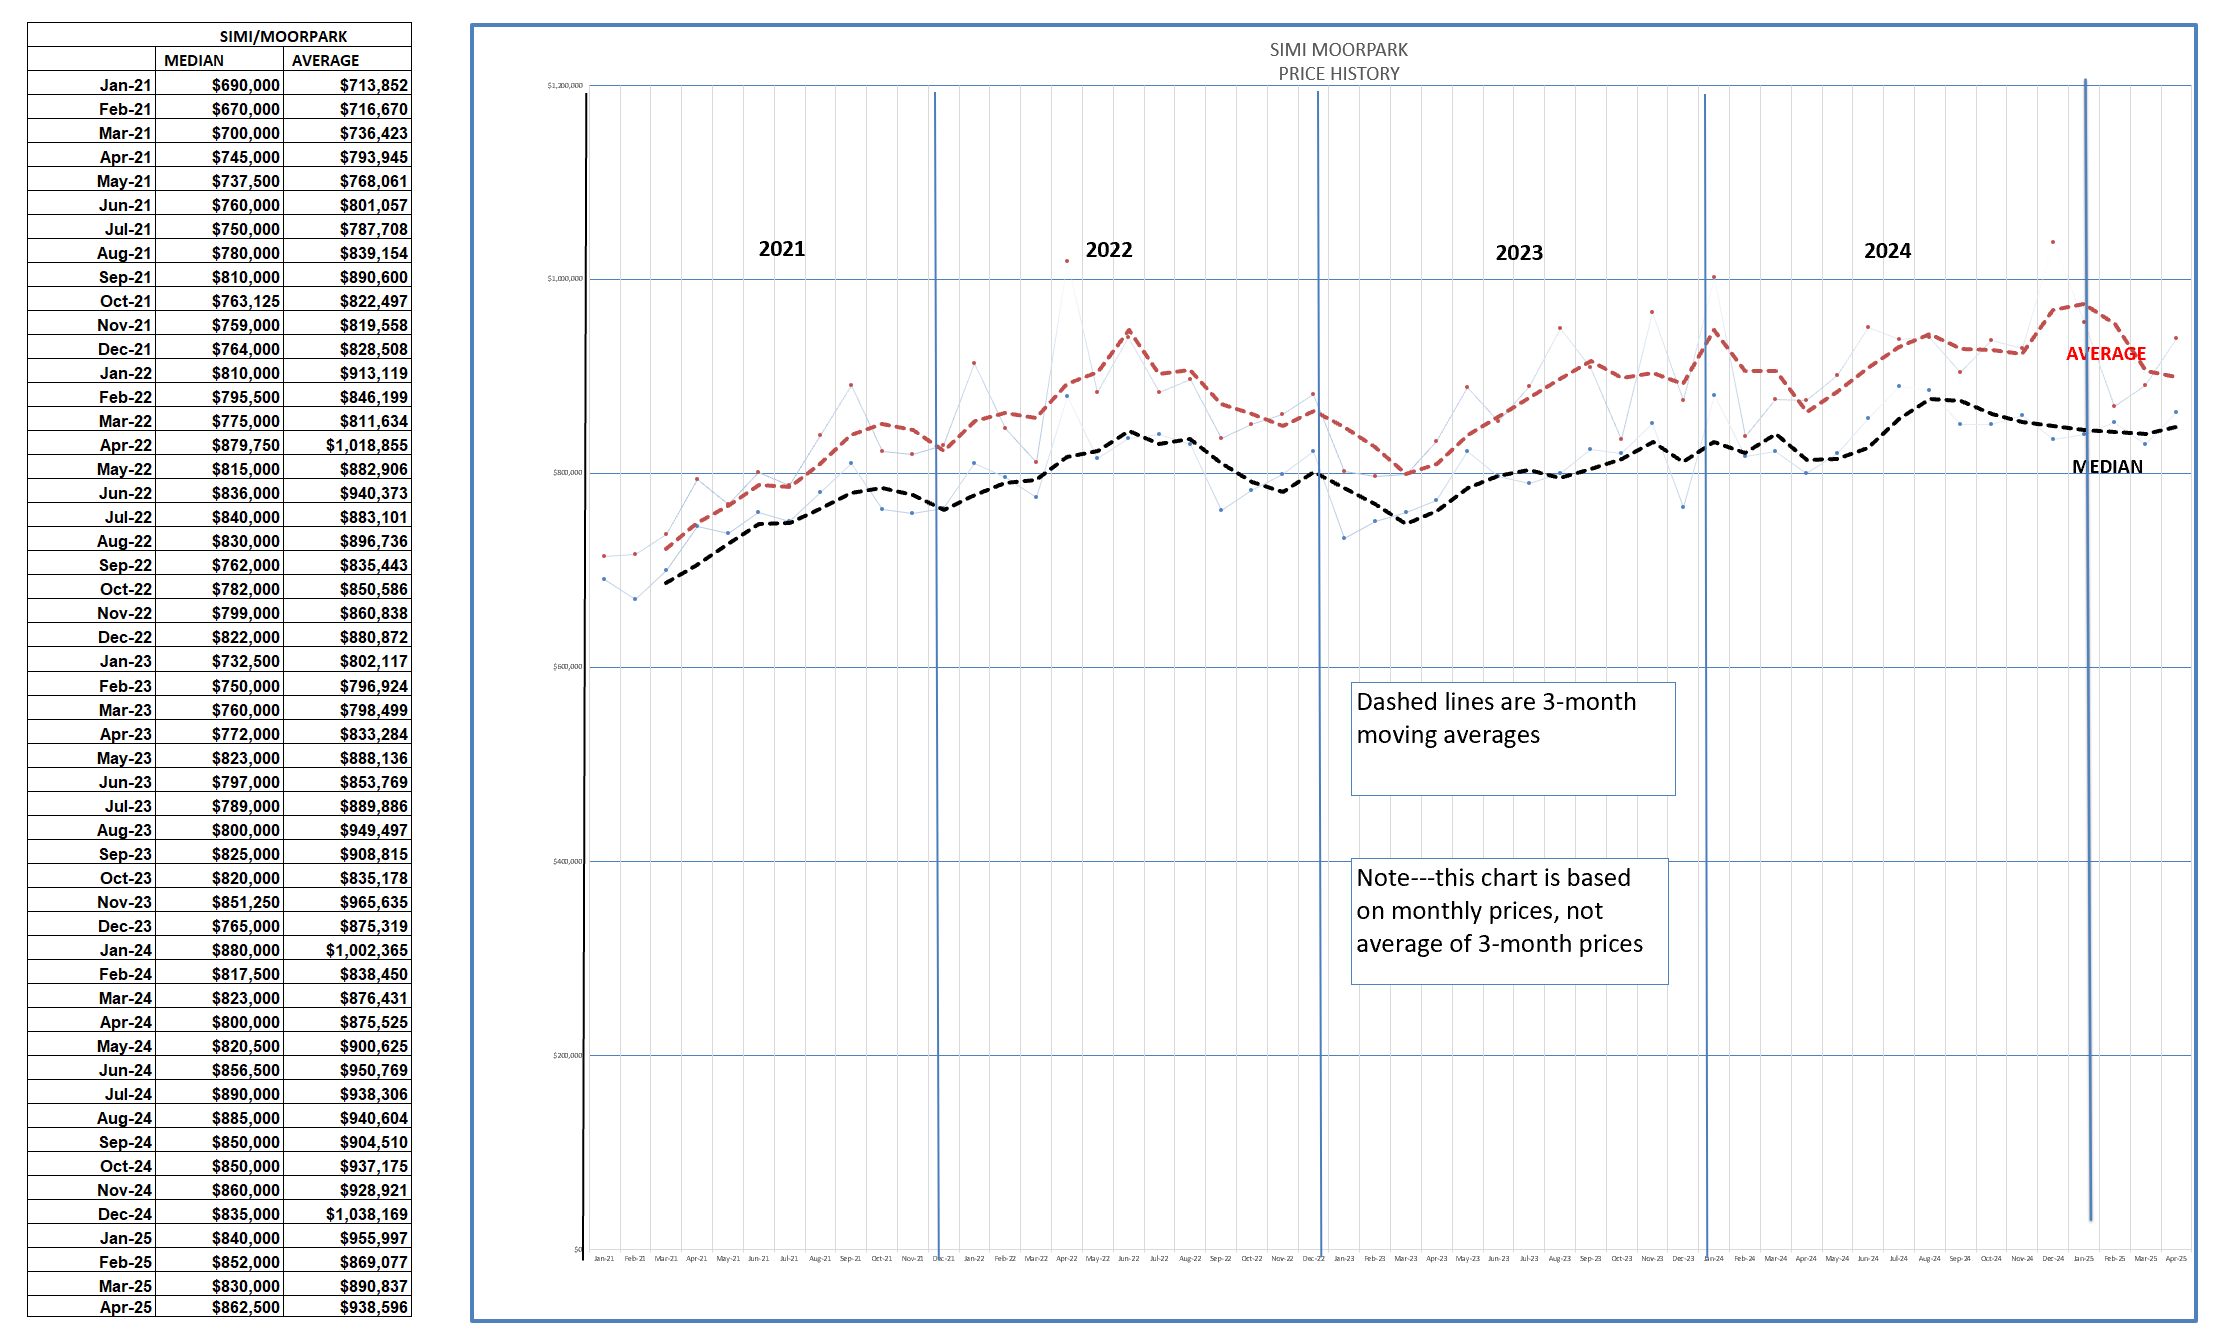
In Simi/Moorpark, prices are leveling out, again due to the pressure on first-time home buyers.
That catches us up on the housing statistics at the end of April.
As for the future, I don’t see things dramatically improving, and there are a lot of reasons why we should continue to see this year as the third year in a row of similar sales. Transactions will continue. There are always reasons why sellers list, and lots of good reasons why buyers want to own their home and build their net worth. Prices may slip, and we can consider that a sign of a normal market. Prices always vary up and down when supply and demand are in balance.
The price at which to list a home is always a very educated guess/calculation, based upon past history of similar homes modified by an understanding of current trends. A balanced market is described by sellers hoping to sell for more and buyers hoping to buy for less. No skyrockets or avalanches are expected. But negotiations will become much more common. Sellers and Buyers still will look to professionals to help them through this process. However, the volume of sales has been lower than recent history. Our business is now attracting fewer new agents, and existing agents are either retiring or moving to other professions. Lower sales numbers are being shared by fewer active agents.
What will change it, and when will it change? Interest rates need to come down at least a percentage point, hopefully more. For the near future, there is little to suggest that will happen anytime soon. However, the volatile climate in Washington could change all that.
Share your information, promote your expertise. When sellers decide to sell, and buyers decide to buy, they will look for experts to guide them through the process.
Stay well and healthy. And please, let me know your thoughts.
Chuck