This is election time, and every vote counts. No matter what the talking heads on TV say, no matter what the polls show, it really does not matter until the votes are in, compiled by decisions made by each individual voter.
Our market works the same way. We can look into our crystal ball and forecast how the market will do in the future.
Our information is based on individual decisions, just like those at the ballot box. What is good for this particular person, will they decide to rent, to buy, to sell, or to continue exactly as they are living, paying their mortgage and their rent.
I used to travel a great deal. When I looked out the plane window at night I would see a group of lights, a city, below the plane. They did not know I was there, but life was going on. Someone was having a baby, someone was graduating, someone was having health problems, one family was going through terrible sorrow. There were happy occasions and arguments, the thrill of a new job and the sadness of a layoff. All these things add together to affect what we call our market. It is each individual family, each individual, each life and each decision that adds up to our market.
Lawrence Yun of NAR looks at things from a satellite view, what is going on in the entire U.S. Leslie Appleton-Young has a closer view, maybe from that plane. I tend to drive around at street level, both on our local communities and our local MLS, to come up with what is happening. The closer it gets to home, the more real it becomes. All real estate is local.
We have percieved differences in our two local markets, Conejo Valley and Simi Valley/Moorpark. Close neighbors, but different communities. Made up of individuals voting in different ways, whether to buy or sell or hold, different price points. All real estate is local.
The inventory in both areas, and in California, and in the U.S., is lower than last year. But the makeup of that inventory is what has also been changing.
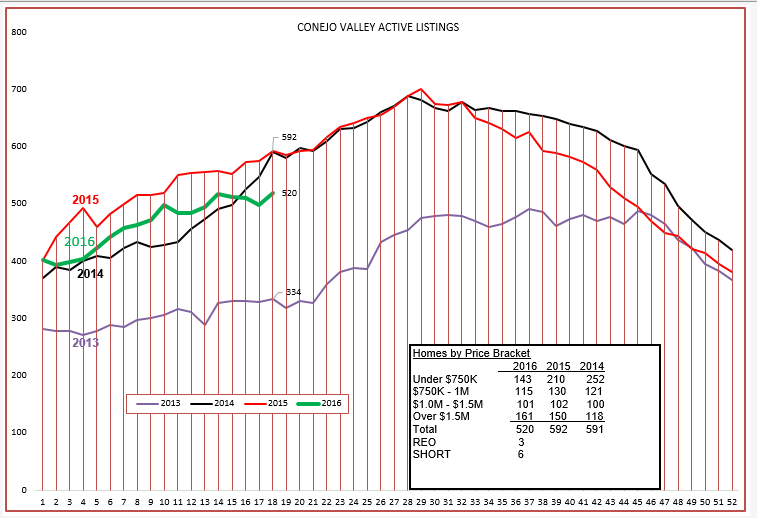
In the Conejo, although the inventory in total is trending along a seasonal line that we expect, look at the numbers in the box. The inventory of under $750,000 homes is down by 43% compared to two years ago. The next two tranches (just saw the movie The Big Short again, really well done) are the same, year to year. The inventory of really expensive homes, priced over $1.5 million, is up 36% since 2014. Remember this change, because later we will see how it affects median versus average pricing.
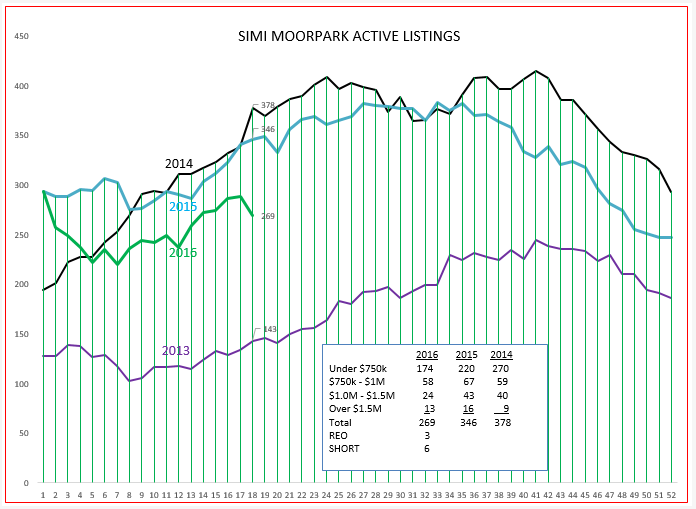
The Simi/Moorpark inventory line is not behaving as we would expect. It began with a huge drop and then looked like it may recover to become “normal”, but the outcome is still in doubt. Year over year, the figures are similar to Conejo. The under $750,000 inventory, the vast majority of homes in this area, declined 55% from the number listed in 2014. The next tranche is about the same, but the third tranche has also declined significantly, by 40% compared to 2014. The highest tranche increased 44%, but with relatively few listings the percentage may not be significant.
Both valleys show exactly the same number of troubled properties, 3 REOs and 6 Short Sales, an insignificant percentage of the big picture.
Let’s compare the actual numbers and see how the two valleys compare, based on the same three months, year to year.
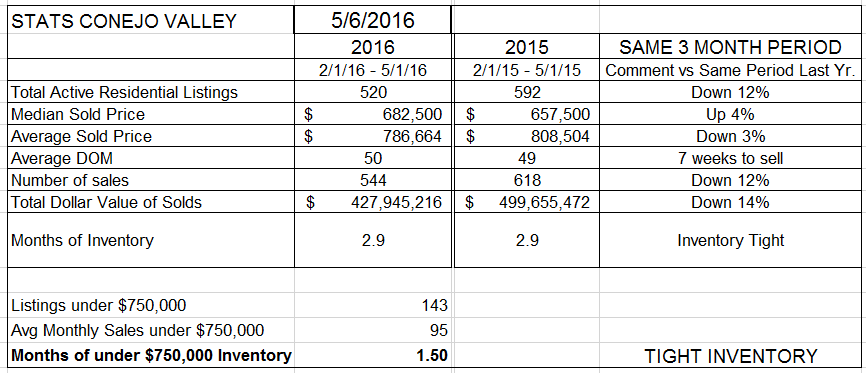
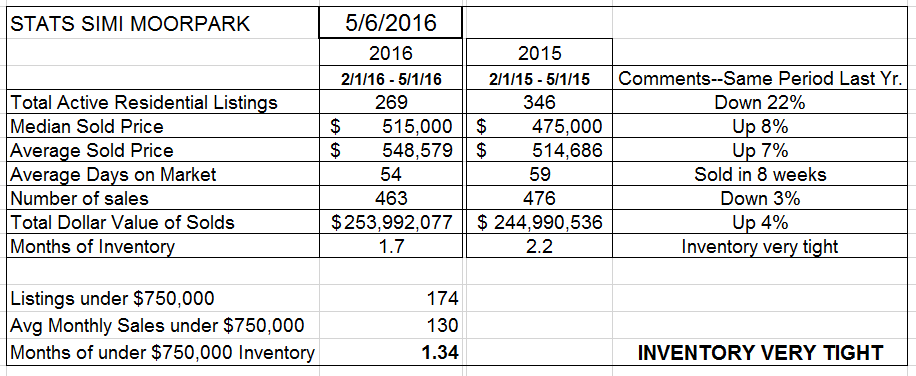
Conejo Simi/Moorpark
Listings Down 12% Down 22%
Median Price Up 4% Up 8%
Average Price Down 3% Up 7%
Number of Sales Down 12% Down 3%
Months of Inventory 2.9 Months 1.7 Months
Months under $750,000 1.5 Months 1.3 months
The active listing inventory is down in the U.S., down in California, and Simi/Moorpark is down twice as much as Conejo. In both valleys, there is a shortage of homes priced below $750,000.
The median price is up, up twice as much in Simi/Moorpark than in the Conejo.
The Average price is down 3% in the Conejo, and up 7% in Simi/Moorpark.
This is where the inventory tranches come into play. The increase in high end inventory and lower sales in high end homes has brought the average prices in the Conejo down compared to the average price increases in Simi Valley/Moorpark. Because Simi/Moorpark has the vast majority of homes priced below $750,000, it affects the comparisons between the two valleys.
Overall, business is good, prices are up, better in the lower priced end than in the higher priced end. Supply and Demand tells us that with the very low inventory of under $750,000 homes, those prices will be increasing, while the growth in Conejo inventory of highest price homes is keeping those prices stable, and the lower number of sales is bringing down the average price. The high end prices don’t have to decline, just the mix of homes sold, the percentage of high priced homes versus low priced homes.
Let’s look at prices and how they have changed over the past four years. These graphs show the median and average prices for each individual month.
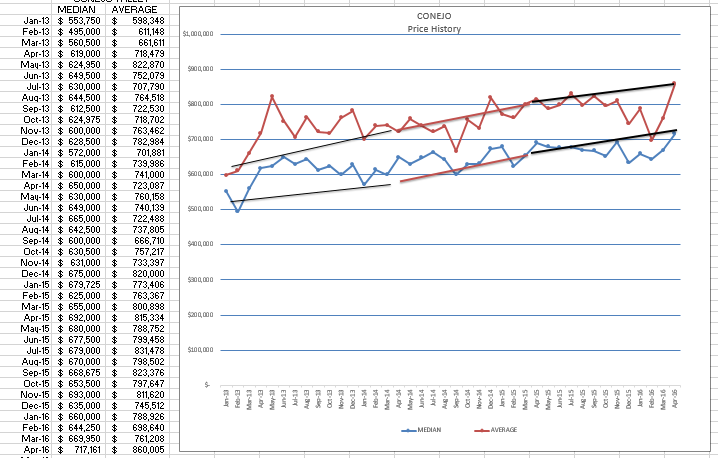
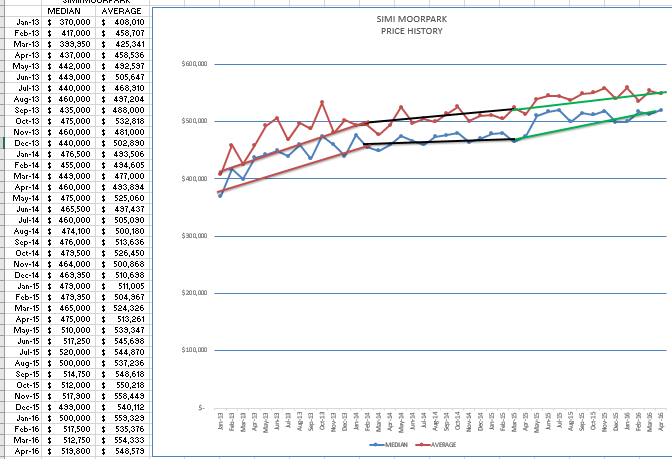
Conejo Simi/Moorpark
Median Price Jan 2013 $553,750 $370,000
Median Price Apr 2016 $717,161 $519,800
Median Price Increase 29% 40%
Average Price Jan 2013 $598,348 $408,010
Average Price Apr 2016 $860,005 $548,579
Average Price Increase 44% 34%
What do those numbers mean? I would feel comfortable explaining to people (your elevator speech) that prices have gone up 35% since 2013, on average 12% a year. Or you could say 11.67%, which give you an aura of exactness and credibility because you added the decimal points. However, you can see that the numbers are not exact, there are many differences.
Why?
Because all real estate is local. If you want an exact number, you have to take exactly one house as your sample. More information means averaging, statistical analysis, and fuzziness. Prices change by neighborhood, prices change by the quality of the home, prices change because of the pressures on the buyer and the seller.
Finally, let’s take a look at the closed escrow charts, probably the best indicator of how the market is doing, because it displays a picture of actual closed sales.
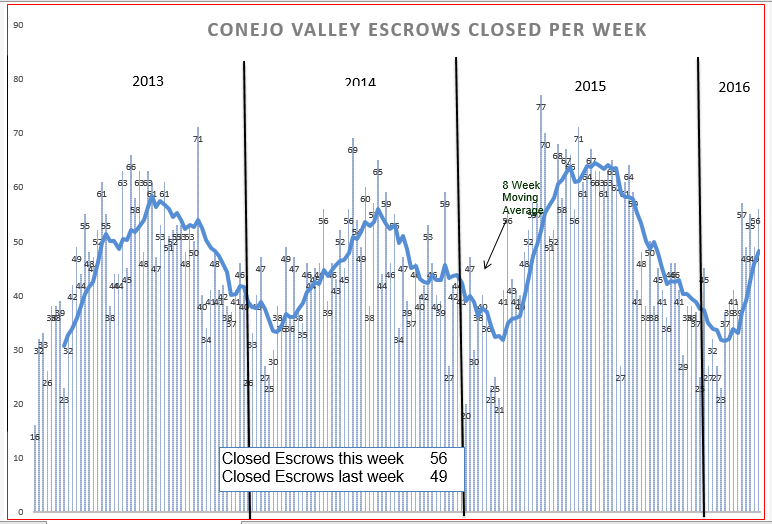
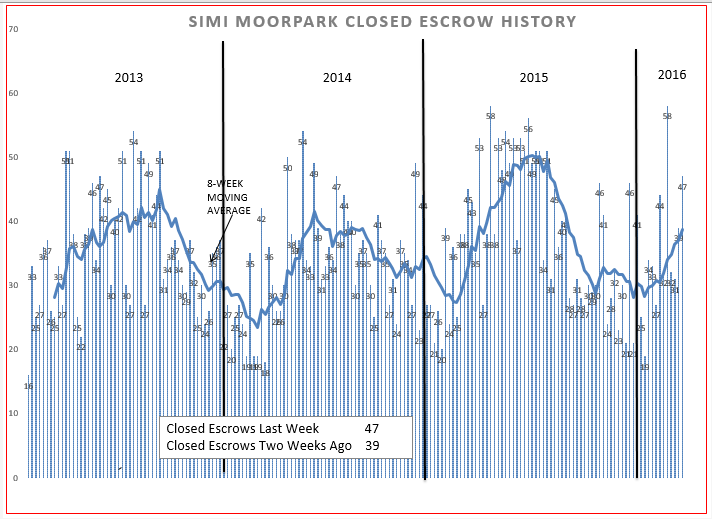
According to these charts, 2016 looks like it is going to be another 2015, and that would be very good. Going back to the percentages, the number of sales is statistically down compared to last year, but business has been increasing after a slow start, and we should have another prosperous year in real estate. if your year is not as prosperous as you would like, call me, maybe I can help.
Chuck