Our biggest obstacle today to a truly robust real estate market is a lack of inventory.
Multiple offers are commonplace, prices are rising, and buyers are becoming discouraged by bidding to buy homes and losing the competition, usually to offers with higher cash components.
The shortage of inventory is reinforced by the shortage of inventory. No, that is not a typo. Homeowners who might place their homes on the market are not doing so because they are concerned that they may not be able to buy.
Just how low is the inventory? Inventory by itself is just a number. We need to consider two numbers. One is the number of homes for sale, and the other is how many homes are being sold. The figures in the chart below converts those two numbers to a “Months of Inventory” figure, with the number of sales averaged over the recent three months and compared to the same three months last year.
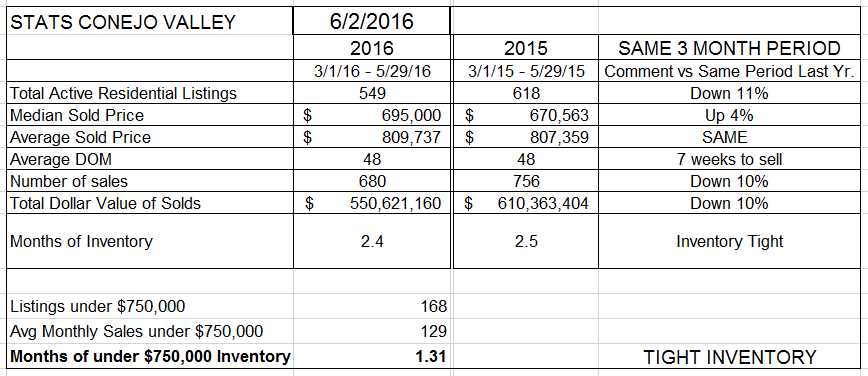
The number of active listings is down 11% when compared to this same time period last year. The number of sales is also down versus last year, by a similar amount (10%). Usually, a balanced inventory for us is 3-4 months. Having only 2.4 months of inventory provides a measurement for how tight the inventory is. Inventory was also tight last year. When you look at the number of months of inventory for homes priced below $750,000, it is a very low 1.3 months, only about 5 weeks of inventory. Compare this with Simi Valley/Moorpark:

The number of active listings is down 22% when compared to this same time period last year. However, the number of sales is the same as last year, causing the Months of Inventory to drop to an anemic 1.6 months, and only 1.3 months (5 weeks) of inventory for homes priced below $750,000. It was tight last year, but this year is even worse.
This shortage should affect prices, causing them to go up. Prices have gone up, but not substantially. For both areas, the median price is up 4-5%, a good number, but not an outlandish number. These comparisons are based on the current three months versus the same three months of last year. The pricing graphs below are done differently. The graph below shows the median and average prices recorded for each month, with any comparisons made only by looking at the chart itself.
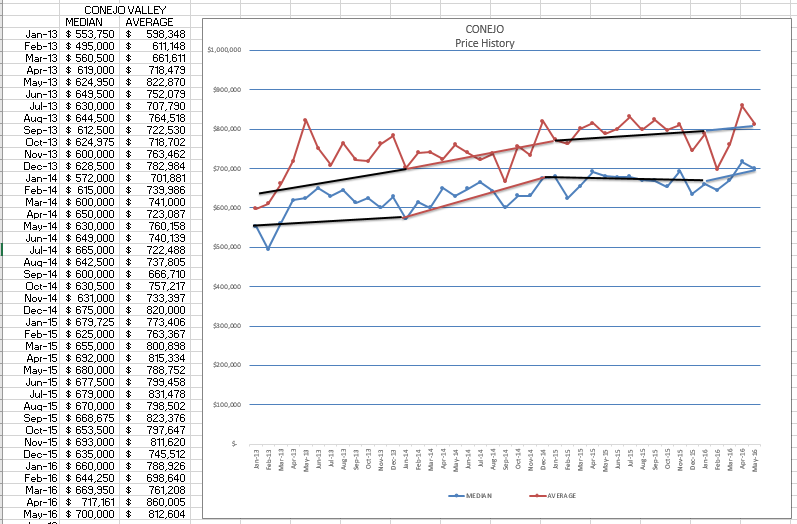
The first few months of 2013 showed a dramatic increase, huge. Since then, the increase in price has been good, but not dramatic. No bubbles are being created by runaway prices. Next, on to Simi Valley/Moorpark. The mean and average lines are closer together, because SImi/Moorpark does not have as many high priced homes as does Conejo.
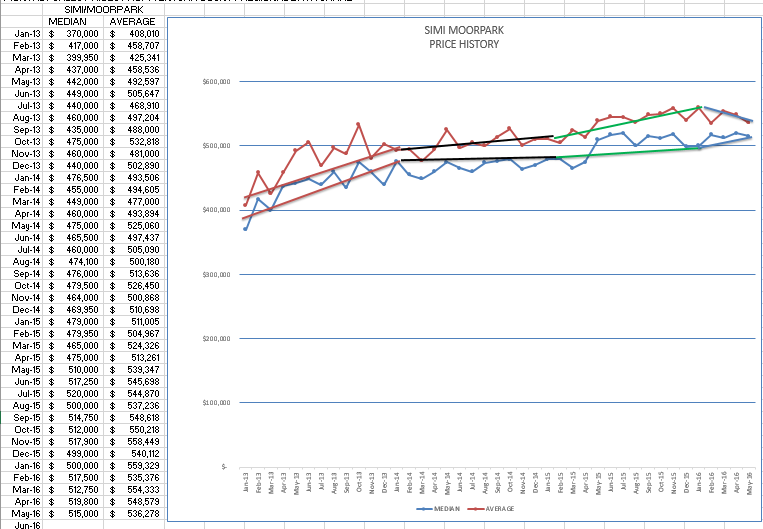
We see the same dramatic increase for the first few months of 2013, 2014 was relatively flat, then 2015 prices increased strongly, and 2016 is pretty flat so far. Considering how low the inventory is in Simi/Moorpark, we would expect prices to rise more dramatically. You can think of this as a pressure cooker. Steam is building, eventually it will push prices up. Let’s look next at the Escrows Closed chart.
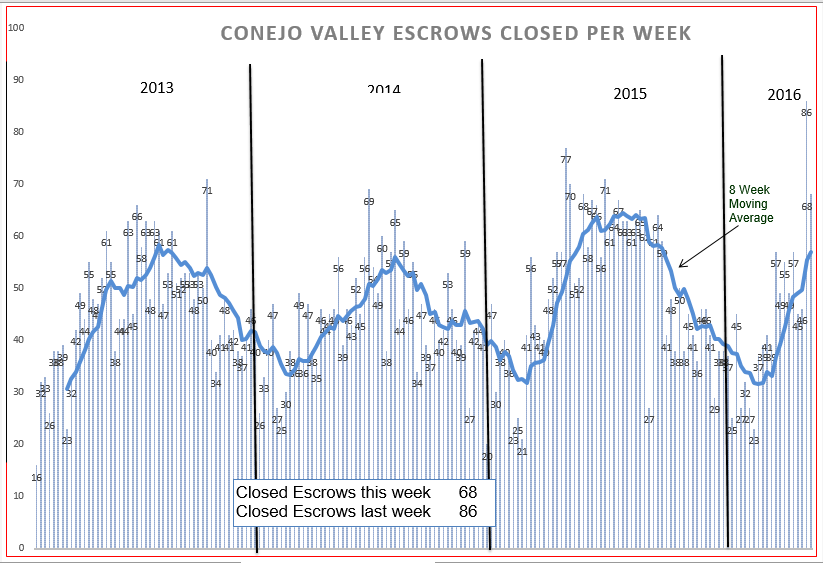
The most significant thing to note is the last couple of weeks, a 4-year record of 86 in one week, followed by 68 last week. I usually feel good about anything over 50 closings in one week. This last couple of weeks shows a lot of strength, and remember this all happened with contracts that were written a month and a half ago. Compare now to Simi/Moorpark
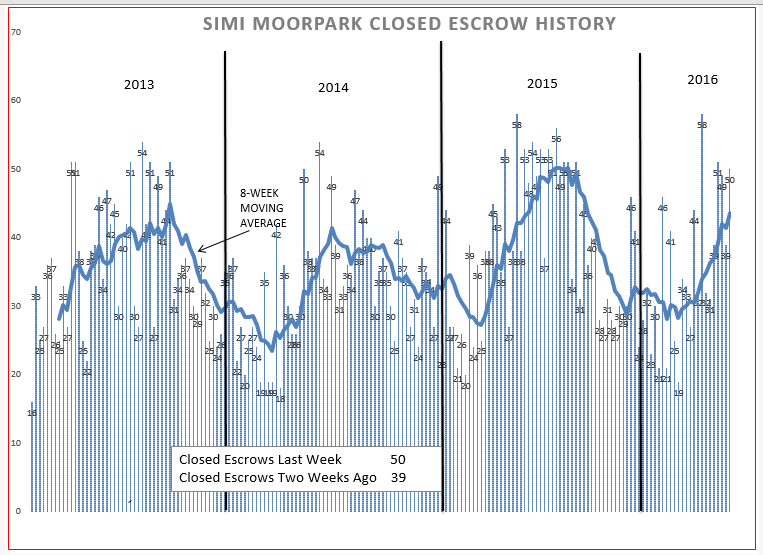
Same thing, a tie for the four-year high of 58 closings. But in comparing the two charts, you can see how, for each year, Conejo is pretty much a duplicate of the previous year, whereas in Simi/Moorpark the shapes are very different.
We began by talking about inventory, so lastly lets look at the inventory history. Inventory is down 11% in Conejo.
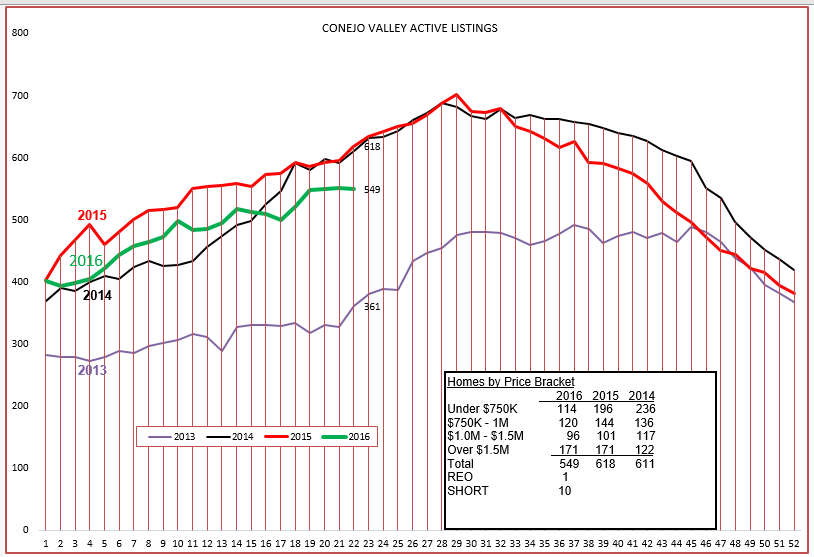
The inventory curve is proceeding as expected, but shows the lower inventory compared to the last two years as 10% lower. Let’s now look at the Simi/Moorpark chart, where inventory is down 22%.
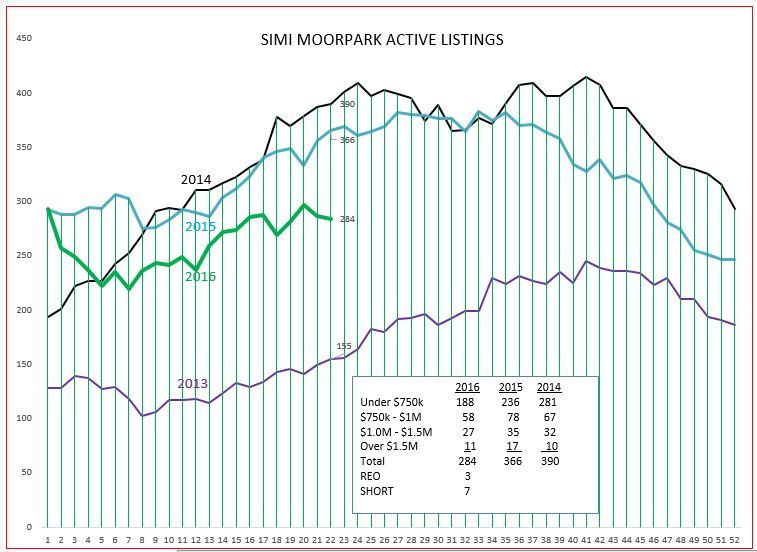
In this graph, 2016 seems to have a mind of its own. Based on recent history, we cannot be sure where inventory is going. It is now lower than it was when the year began.
This week I was privileged to be a judge at the “WE THE PEOPLE” competition held at CLU. 5th grade classes made presentations about how our government works, what it was like in 1776 for the patriots writing documents to form our government, and how this constitution still guides us today. After their prepared remarks, they then answered our questions to judge their understanding of what they were studying. It was a pleasure to see the breadth of understanding our children are being taught about government, and their knowledge of issues today that affect them in school.
Schools are very important to real estate, as are our cities. Parents move here to give their children the opportunity to go to the best schools, and it was gratifying see to the results in action. Our quality of life is what will continue to attract families to our cities. Our weather, our lack of pollution, our open spaces, our schools, all contribute to why people want to live here and buy our homes.
Our jobs are to help them find those homes. And when you are asked this week, “how is the market”, a question I was asked by one of the other judges, what can you say? What’s your elevator speech?
The inventory of homes is lower than we would like (pick where your elevator is located, 11% or 22% lower). Homes prepared for sale are going into escrow quickly, and are selling at or over listing prices. We are currently in a sellers market, often generating multiple offers. Prices are up about 5% versus last year. This is a great place to live, and there is more demand than supply. Mortgage rates are still excellent at this time. I would be happy to send you information on your particular neighborhood.
Have a prosperous week.
Chuck