There is an old joke about a guy looking for an accountant. He asks the same question: “What is 2 and 2”?
The first candidate says “4”.
The second one says, well it could be “4”, or it could be “22”.
The third looks around the room, leans closer, and says “What do you want it to be?”
That’s where we are today on prices. All real estate is local, and measuring price increases depend on what ruler you are using, and what are the time periods you are measuring.
Today let’s begin by looking at the price chart for the Conejo Valley.
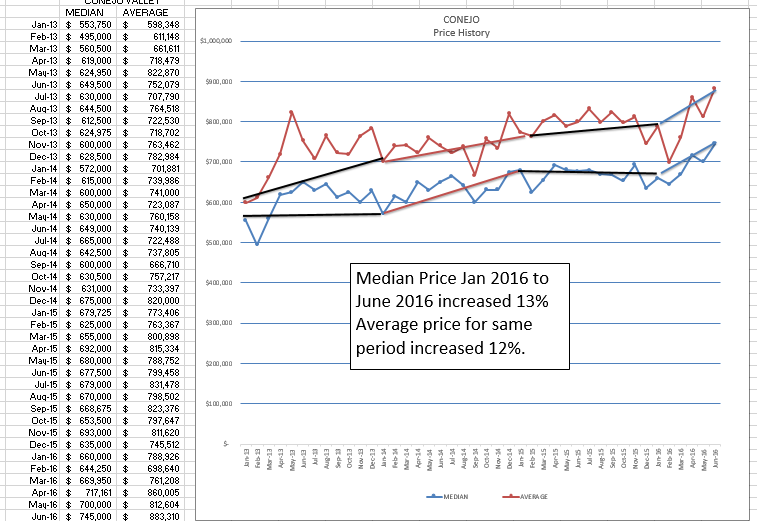
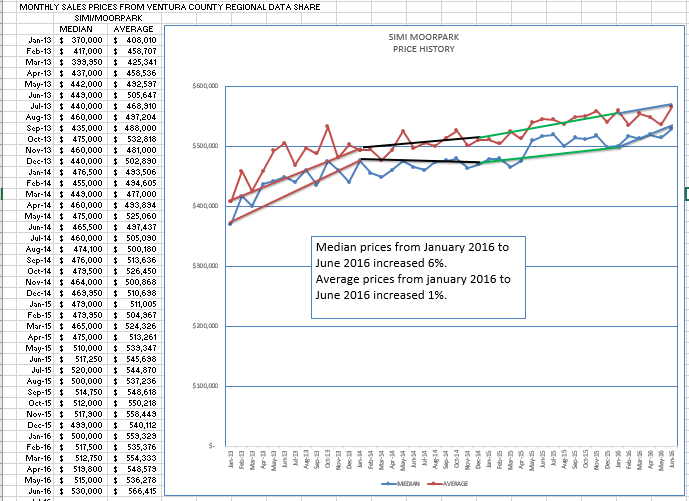
This chart contains data of the median and average selling prices for each month. Look at the increases since January: 13% and 12%. Wow. Huge increases. Next, let’s see how Simi/Moorpark is doing. Their inventory has been nonexistent, and sales high. Supply and demand dictates they should be rising also.
Confused? It’s all in picking the time frame. Some months are higher or lower not because prices changed that much, but because of the mix of homes that were sold. That’s the benefit of taking a larger sample of homes, over a couple of months, because it evens out the numbers. but sometimes taking too big a sample causes us to lose sight of what is happening now.
Another factor can be seen by Conejo having not as strong pricing statistics in 2015 as did Simi/Moorpark. Conejo is playing catch-up. If I chose a wider period of time, I could make the Conejo chart look similar to the Simi/Moorpark chart.
Confusing? There is a lesson here. Your clients want to know what THEIR home is worth. We usually take a small sample for their particular tract, nearby homes, maybe even the same model, and use sales in the past 3 months. That can be very accurate. But as soon as the geographic area gets larger, and the time frame gets longer, you need to do more interpretation. That’s how you can be valuable to your clients. You can give them real-time, current information, unlike the historical information from announcements from Case-Shiller, and computer generated programs like Zillow. That is what you can provide to them that shows your value. You can help them value THEIR HOUSE.
How do the historic numbers look that you have been used to seeing from me?
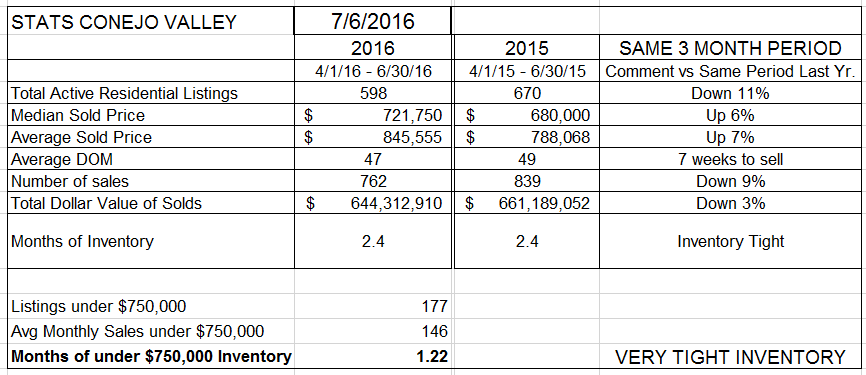
In the Conejo Valley, prices are up 6-7% from the same time period last year. The months of inventory are also the same, tight inventories for both years. 2015 had more homes active, but we also sold more homes than in 2015. Active listings are down 11%, total number of sales is down 9%. Last year we had more to sell, and we sold more.
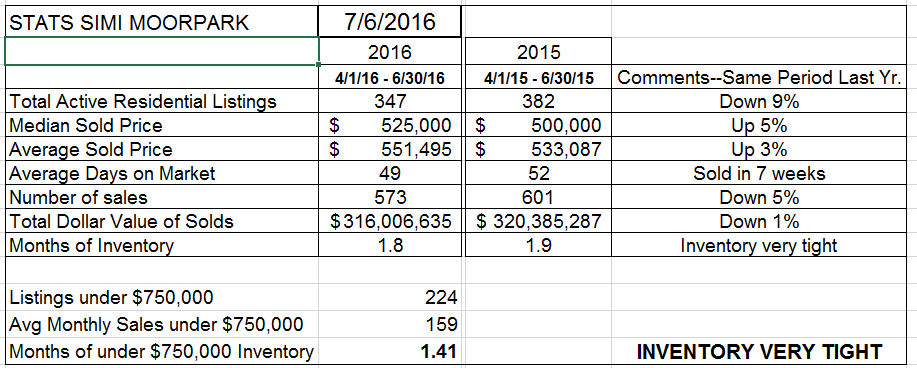
Simi/Moorpark is similar. Inventory is down 9%, sales down 5%. Prices are up 3-5%. Inventory is very low, but about the same as measured by months of inventory as we had last year. Again, last year we had more inventory, and we sold more homes.
Let’s look at the inventory for both areas. First, Conejo.
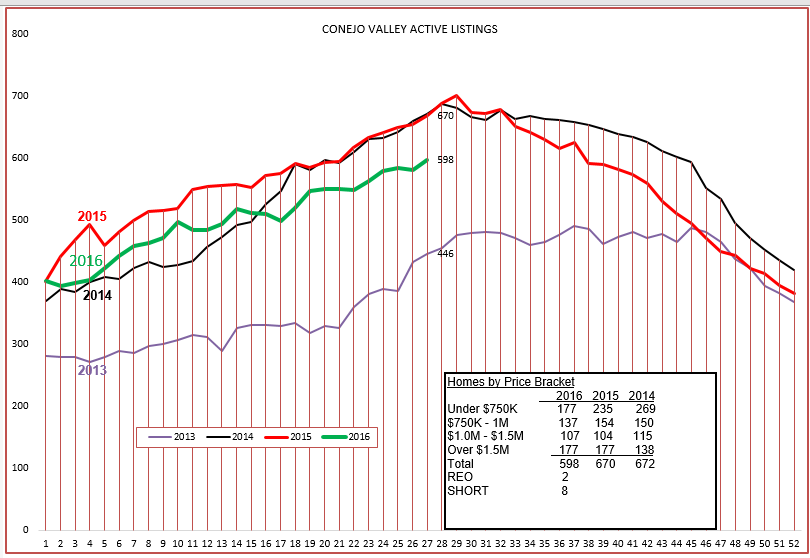
We can see the from the chart that the inventory buildup is following the same pattern, only lower (11% lower than last year). One thing to note is from the box in the chart above. Comparing this year to last year, all the decrease in inventory has been in the under $1 million range. The inventory numbers are exactly the same over $1 million.
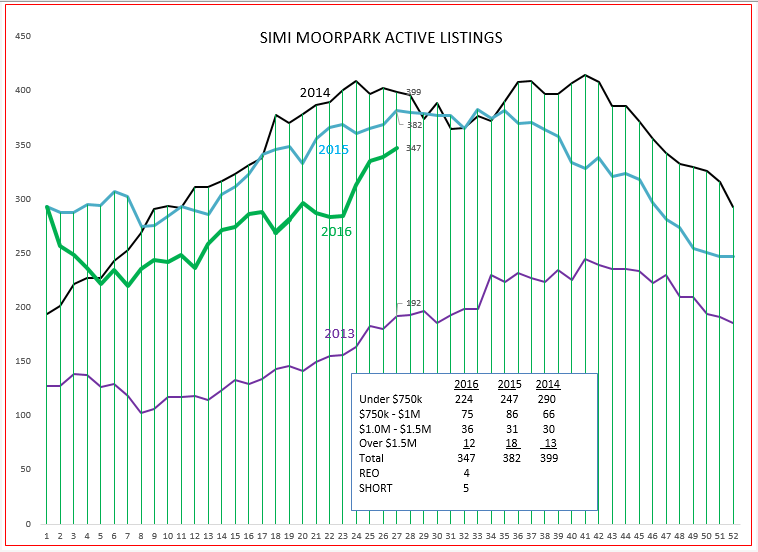
The inventory in Simi/Moorpark is also down, 9%. It began the year with a big drop, but now seems to be following the expected path.
Finally, here are the charts on closed escrows per week.
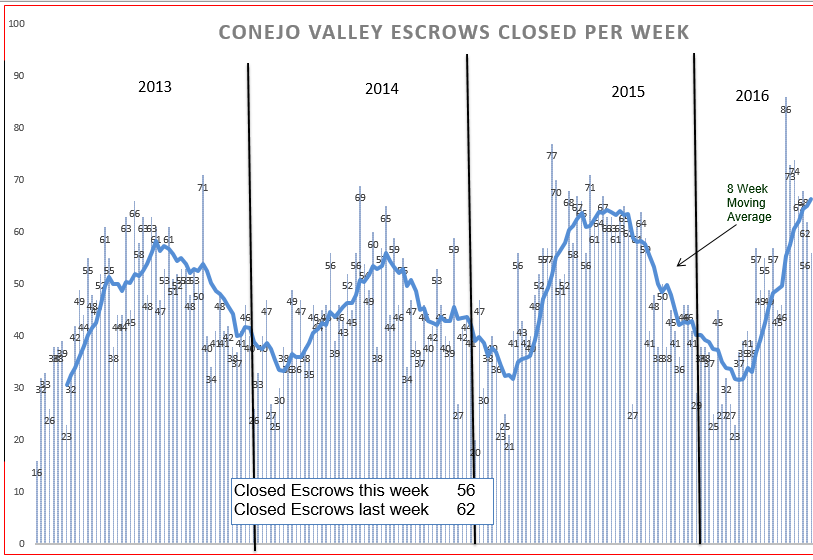
Conejo remains similar to last year, strong sales, yet according to the actual numbers still down 9%.
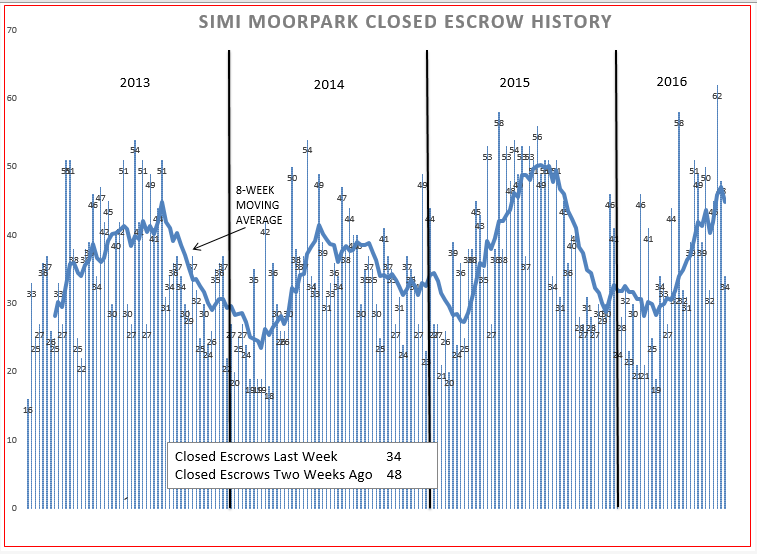
Simi Moorpark began the year with strong sales, stronger than last year. However, the lack of inventory took its effect, and the number of sales is now down 5%.
That’s it for our local statistics. I could fill lots more space by talking about Brexit, about the Fed, about the Election, but so many are writing about that, I think I will stick to what I know, our valleys.
if you agree with this analysis, disagree, have different ideas, please let me know. I would love to hear from you.
But for right now, here is what to say when you get the question “So, how is the market going?”
The housing market is very strong. Inventory is down about 10% from last year. We could sell more homes if we had more to sell. Prices are up about 5-6% compared to last year. Of course that depends on the area and the house, some have risen more in value, some a little less. Can I give you an idea of what your home is worth today?
Have a prosperous week.
Chuck