Summer is three months long. I consistently compare the last three months this year with the same three months last year. That means that these statistics compare this summer with last summer. The selling season. Let’s see how they compare.
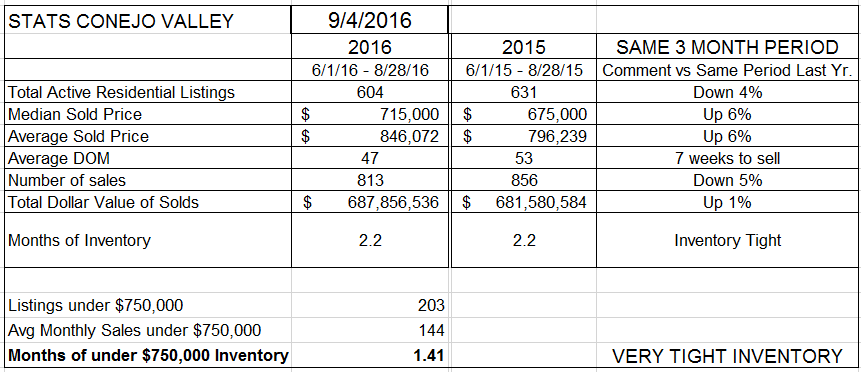
For Conejo valley, we finished this summer with 4% fewer homes on the market than last year. Both the median and average prices are up 6% versus last year. The number of sales was 5% less than what was sold last year. Hmm, similar percentage lower as the inventory.
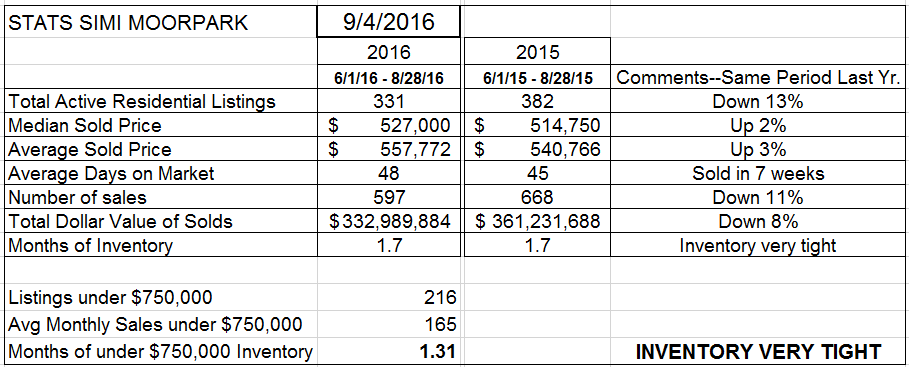
For Simi Valley and Moorpark, we finished this summer with 13% fewer homes on the market than last year. Both the median and average prices are up 2-3% versus last year. The number of sales was 11% less than what was sold last year. Hmm, there appears to be a link between lower inventory and lower sales, particularly with Simi Moorpark inventory less than 2 months worth of sales.
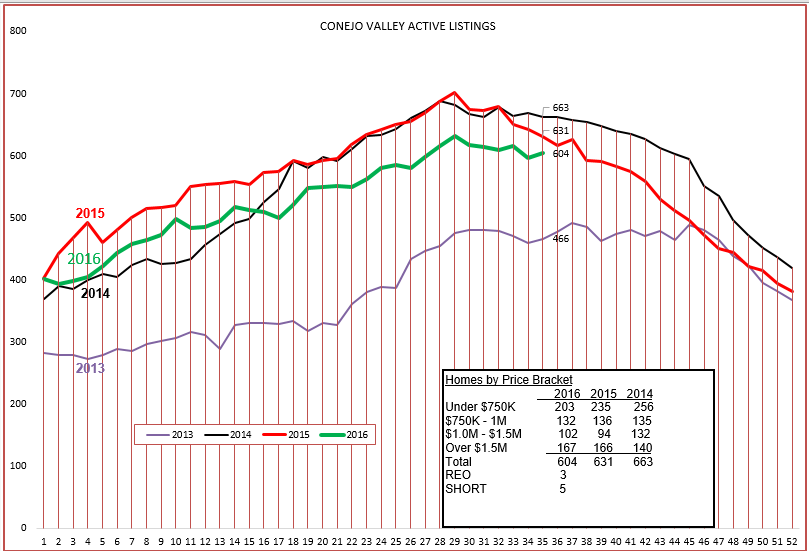
The total number of sales was probably restricted by the amount of inventory. You can see the pattern of available inventory tracking with last year, but at a lower level. It was not as low as 2013, a year in which the extremely low inventory created a significant rise in prices.
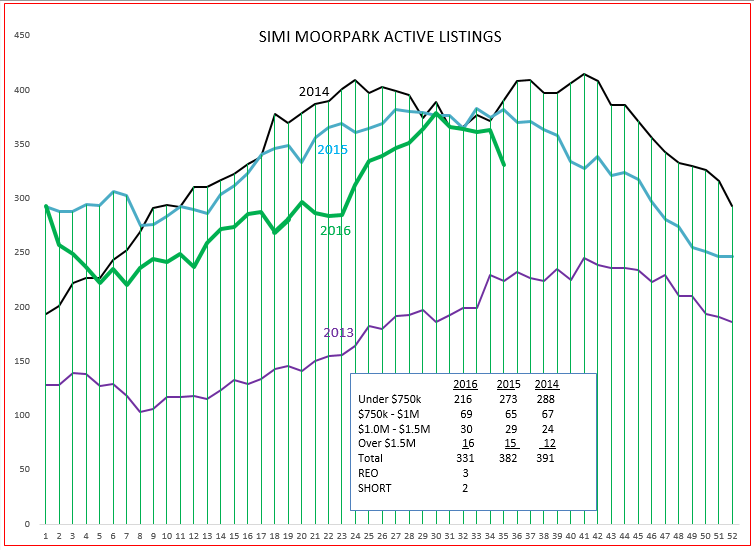
For Simi Valley and Moorpark, the inventory has behaved somewhat erratically, particularly at the beginning of the year. Then it caught up with 2014 and 2015 levels, but recently took a drastic downward dip. Remember, a dip is due to a combination of two factors, the number of homes coming onto the market for sale, and the number of homes on that market that went into escrow. As you can see by the numbers in the boxes, REOs and Short Sales remain an insignificant portion of total inventory available.
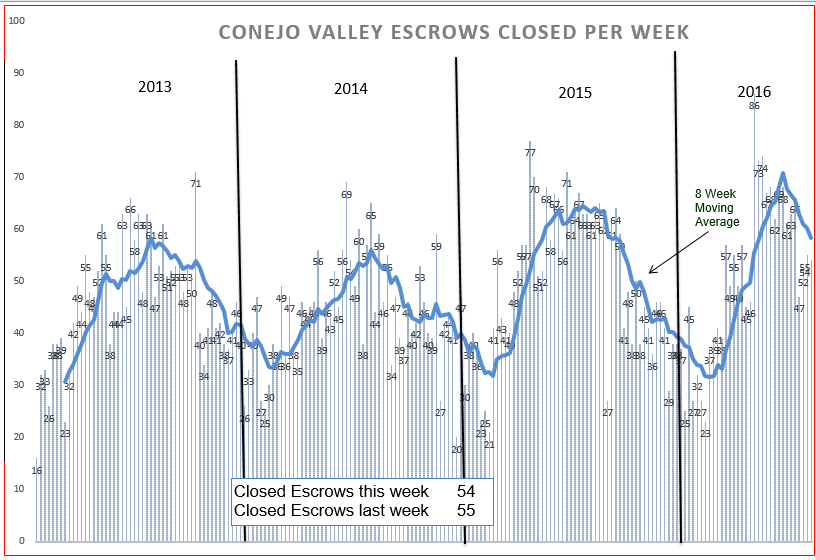
For Conejo, closed escrows had a strong peak, as did 2013 and 2014. 2015 enjoyed a prolonged high sales level during the summer, but never reached the peak level achieved in 2016. This longer high rate of sales in 2015 versus 2016 contributed to a 5% higher total amount of homes sold than we were able to achieve in 2016. This year started off slow in the Conejo, then sales increased strongly.
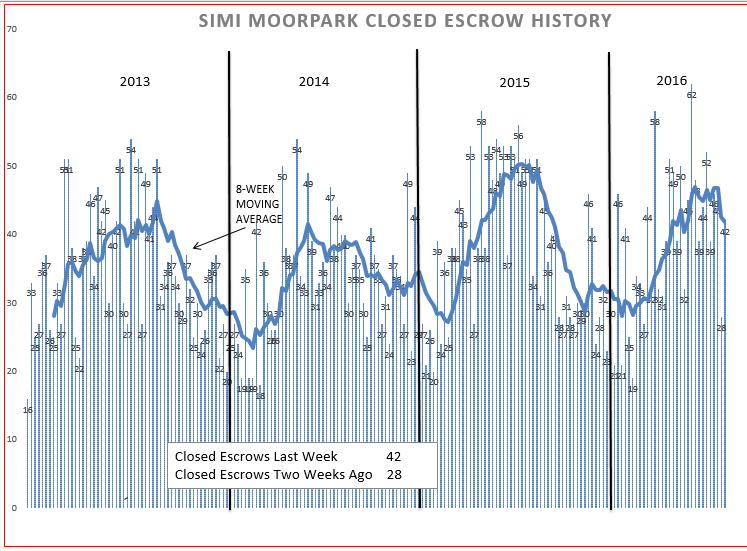
Simi Moorpark experienced relatively stronger sales in the beginning of the year, then leveled off, sustaining a reasonable sales level during the summer. But sales were restricted all year by very low inventory, at or under two months of supply. My guess is that sales would have been stronger with more inventory available.
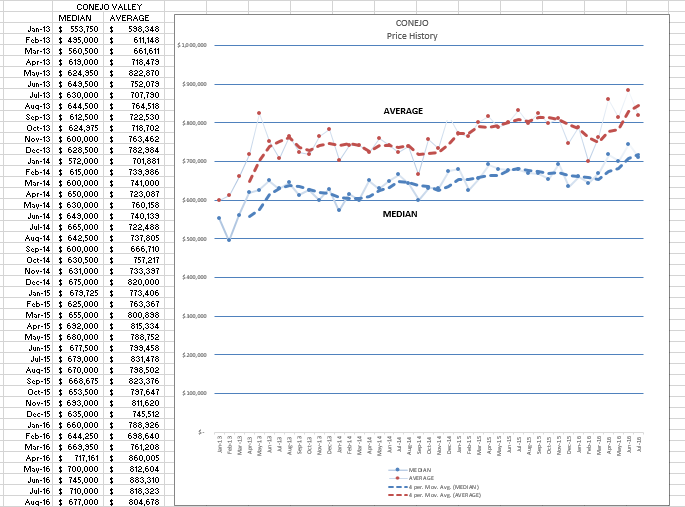
Conejo is currently experiencing strong upward price pressure, 6% higher than last summer’s prices. Prices dip at the end of the year, as there is less activity. Since January 2013, average prices have increased 34%, an average of 10% per year.
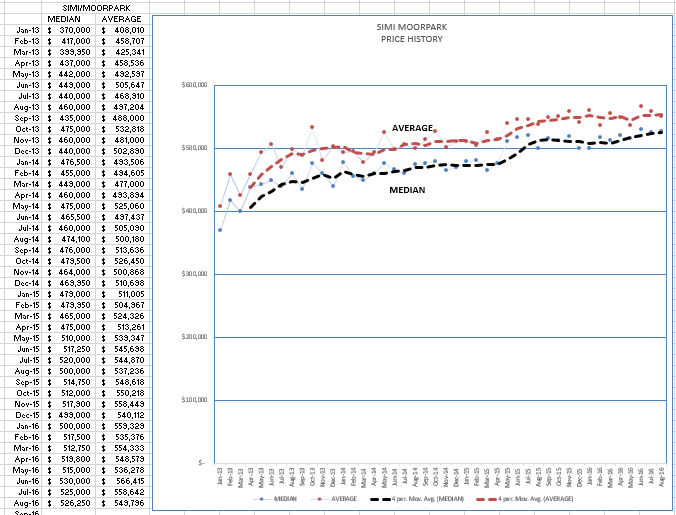
For Simi and Moorpark, when the inventory finally arrived over the last few months, it was not enough to make up for the restricted sales level in the beginning few months of 2016. However, the combination of low inventory and high number of sales did not match the experience of 2013, where the combination resulted in very strong price increases. Price increases year to year were very moderate, 2-3%. However, Simi Moorpark did not experience the price dip that Conejo did at the end of last year, maintaining a strong price throughout the year. Conejo pricing made up for the dip, whereas Simi Moorpark kept a strong price level. Since January 2013, average prices have increased the same 34%, an increase averaging 10% per year.
 Economists are talking about the stock market peaking, mortgage interest rates are still at historical lows, and saving accounts continue to pay less than 1% a year. That 34% increase over 3-1/2 years is a good number to keep in mind when explaining to first time buyers that owning real estate is also a good investment. Looking at year-to-year prices, we still see a price increase of 6% for Conejo and 2-3% for Simi Moorpark. The market remains good, but not overheated. The number of sales remains good, but not as good as last year, 5%-11% lower. Inventory remains low, 4% – 13% lower, than last year. Much of the reason is due to not having enough good inventory to satisfy buyers. Real estate continues to be a healthy market.