The market is moderating. No, not a bubble burst. But a return to normal.
Below is what is happening in our markets.
We regularly begin the year, with a low level of sales, due to the hiatus caused by people enjoying the end-of-year holidays: Christmas, Hanukkah, and New Years. Holiday parties, decorating, shopping, and visiting friends and relatives take up the month of December. Because escrows normally take 30-45 days after contracts are written, closed escrow activity is regularly low in January and begins to pick up in February. People with children in school do not want to force the kids to change schools during the school year, therefore the strongest period of escrow closes is during the summer, tapering off as the year ends.
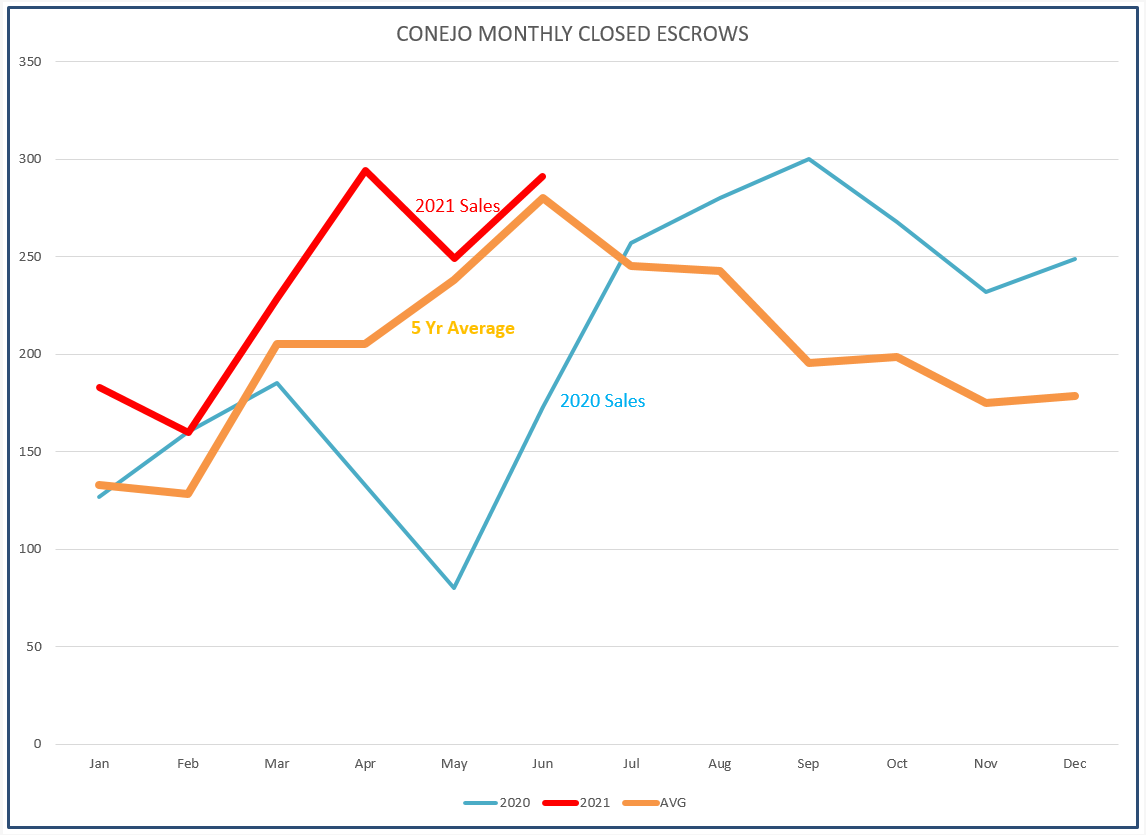
The orange line below is the 5-year average of monthly closed escrows in the Conejo Valley. Rather than fill up the chart with yearly lines that closely mirror this average line, let’s just consider the 5-year orange average line as what we expect in the average year, and compare 2020 and 2021 to that average. 2020 begin normally, but by March COVID 19 changed our world. Sales dropped precipitously in March 2020. People were locked in their homes. 30-45 days later, in the chart below, the month of May recorded that drop in sales. And then an amazing thing happened. Homes and offices were combined under one roof. Buyers were stuck in too-small apartments and desired the space that homes afforded. Homeowners living close to their offices found they could do business remotely, from anywhere, from home. They could live in the suburbs without having to endure the lengthy drives to/from the office. June sales took off, and July escrow closes began to exceed the expected average for that time of year. And it kept growing. In the latter half of 2020 sales reached a frenzied level. Double digit price increases began their climb, multiple offer bidding wars became commonplace. January saw the promise of vaccines and a return to normalcy, and although sales continued to be very strong, they slowly began to follow the normal yearly pattern. Due to the dramatic rise in prices which causes buyers second thoughts, sales are finally leveling out. Leveling out, to the expected annual average.
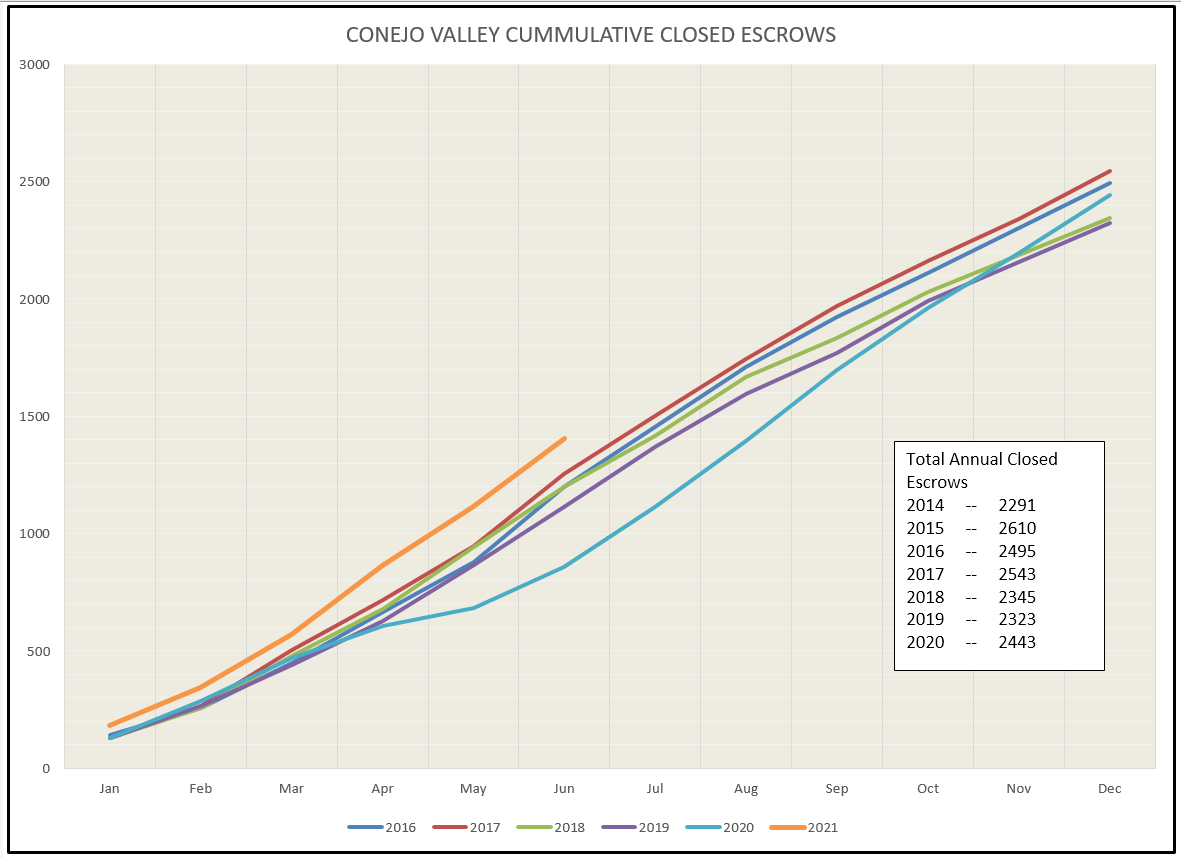
Looking at the same information in a different way, the chart below displays the running total of closed escrows as the year progresses. The light blue line representing 2020 shows the April -May severe drop, and then a leveling out and finally a recovery by finishing the year strongly. The orange 2021 line shows a strong beginning in sales activity, leveling out in March, and now paralleling the rate of sales of prior years. Because of the strong beginning, the line is higher than other years, but it is not pulling away, it is moving in parallel, matching normal sales activity.
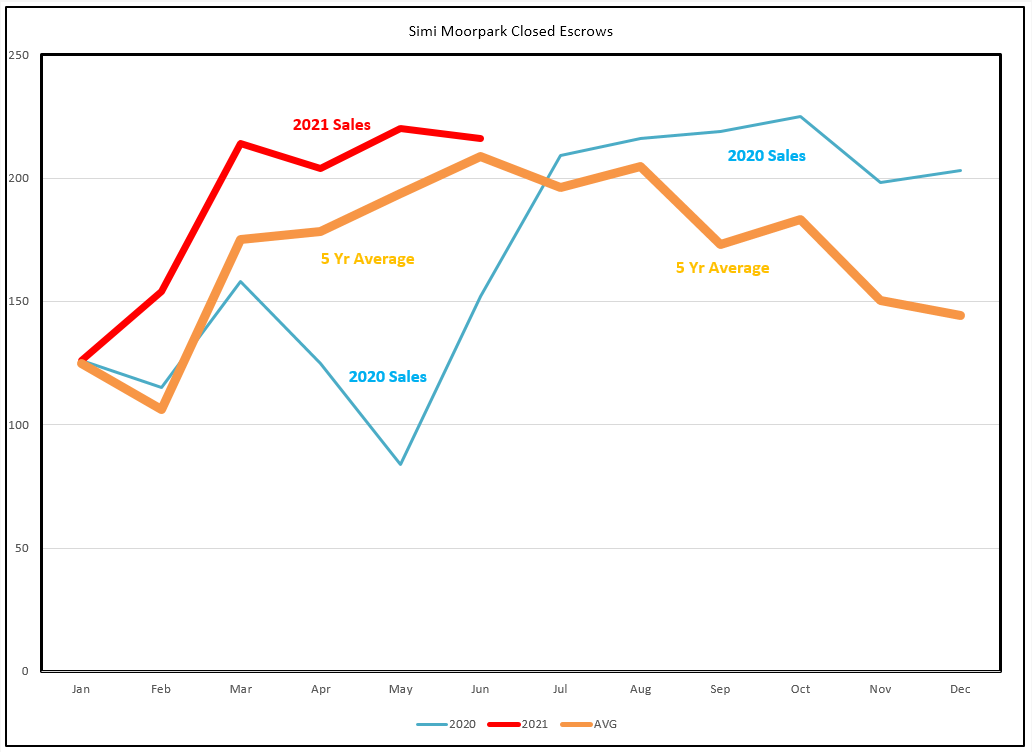
The same thing is happening in Simi Valley and Moopark. The second half of 2020 saw sales climb off the charts, But 2021 is now beginning to follow the average. The orange line below is the 5-year average of monthly closed escrows in Simi/Moorpark. Rather than fill up the chart with yearly lines that closely mirror this average line, let’s just consider the 5-year orange average line as the normal closed escrow line, and compare 2020 and 2021 to that average. 2020 began normally, but by March COVID 19 changed our world. Sales dropped precipitously in March 2020. People were locked in their homes. 30-45 days later, in the chart below, May escrows reflected that drop in sales. And then an amazing thing happened. Homes and offices were combined under one roof. Buyers were stuck in too-small apartments and desired the space that homes afforded. Homeowners living close to their offices found they could do business remotely, from anywhere, from home. They could live in the suburbs without having to endure the lengthy drives to/from the office. June sales took off, and July escrow closes began to exceed the expected average for that time of year. And it kept growing. In the latter half of 2020 sales reached a frenzied level. Double digit price increases began their climb, multiple offer bidding wars became commonplace. January saw the promise of vaccines and a return to normalcy, and although sales continued to be very strong, they slowly began to follow the normal yearly pattern. Due to the dramatic rise in prices which causes buyers second thoughts, sales are finally leveling out. Leveling out, to the expected annual average.
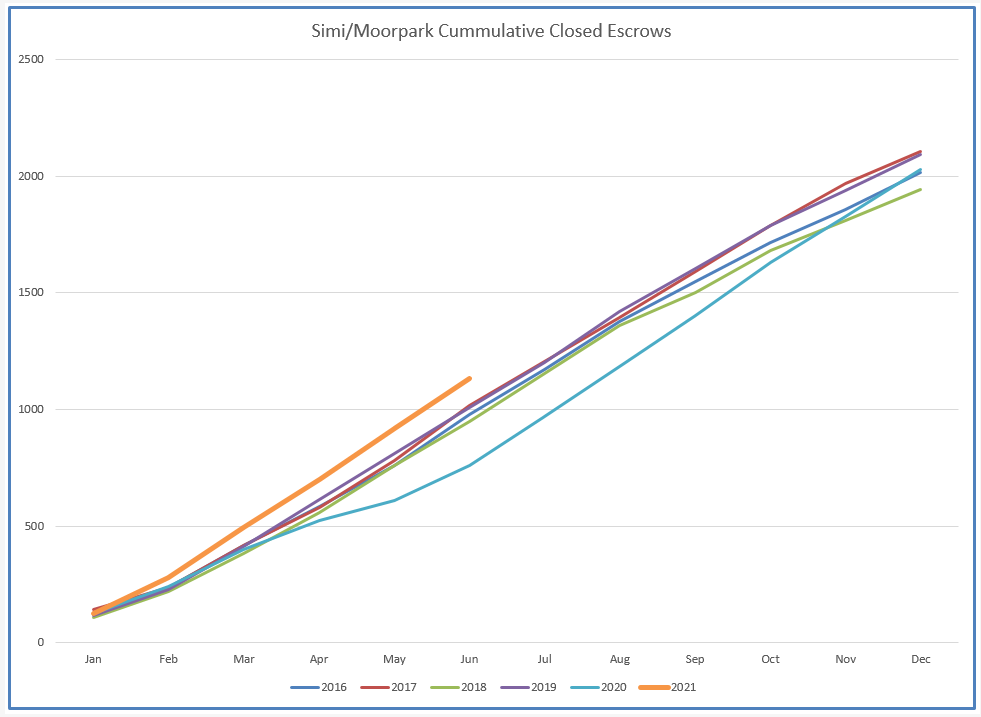
Looking at the same information in a different way, the chart below displays the running total of closed escrows as the year progresses. The light blue line representing 2020 shows the April -May severe drop, and then a leveling out and finally a recovery by finishing the year strongly. The orange 2021 line shows a strong beginning in sales activity, leveling out in March, and now paralleling the rate of sales of prior years. Because of the strong beginning, the line is higher than other years, but it is not pulling away, it is moving in parallel, matching normal sales activity.
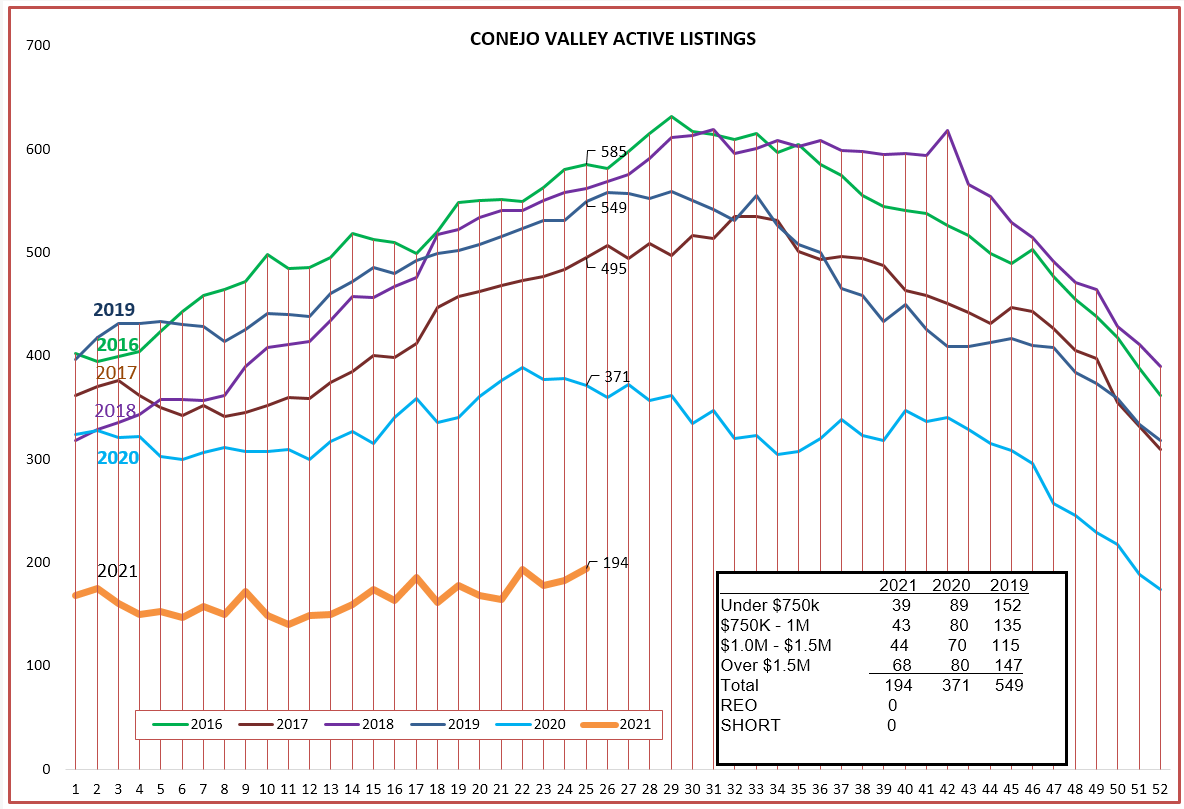
Demand has been strong, but what of the supply? This imbalance is what caused prices to rise strongly. 2020 inventory did not experience the usual climb, and As sales start to taper back to normal, our low inventory is keeping up with demand, supporting the prices that were reached.
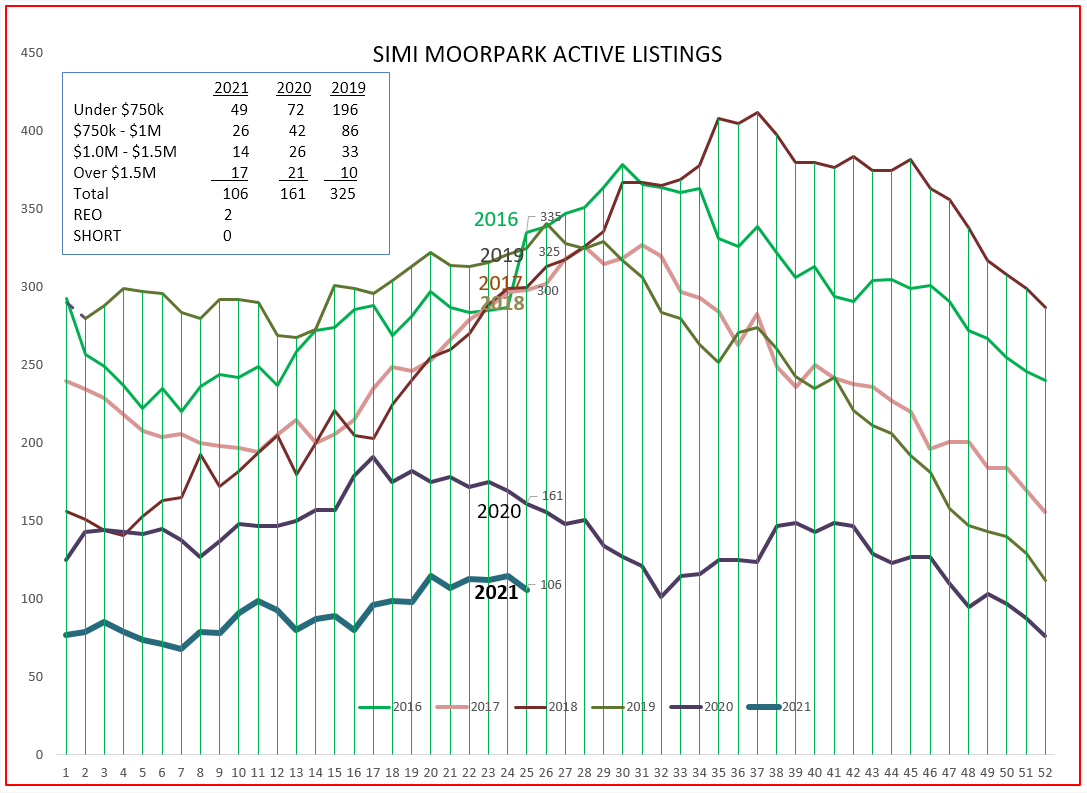
Simi/Moorpark ended 2019 with a steep drop in inventory. 2020 began with that very low inventory level, and by the time Covid 19 hit in March inventory was only in the double-digit (80) range, and never recovered. If inventory were available, sales numbers in Simi/Moorpark would have been even higher.
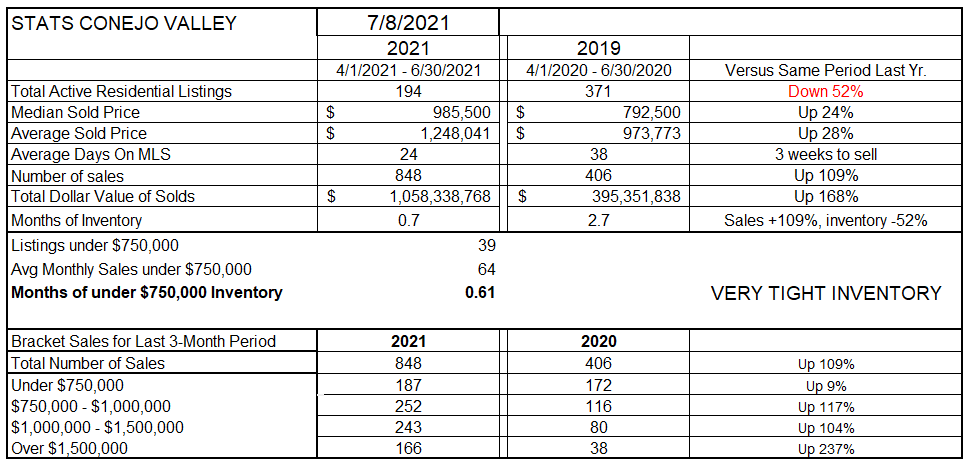
Conejo Inventory is down 52% versus a year ago. The figures are based on the inventory on the first day of the month. Sales figures are based on a three-month total. Due to the steep Covid-caused drop in March and April, it is meaningless to compare sales figures over these time frames. The number of sales are up significantly, but last year they were down significantly. However, it does make sense to look at prices, comparing average and median prices over three months this year versus the same three months last year. According to these figures, median prices are up 24% and average price increased 28%. The numbers are the numbers. Owning a home during the last year is the best investment one could find. Inventory, as measured in how long it takes to sell a home given the rate of sales during the previous three months, dropped from 2.7 months last year to 0.7 months this year. Three weeks of inventory. Strong sales and low inventory resulting in much higher prices.
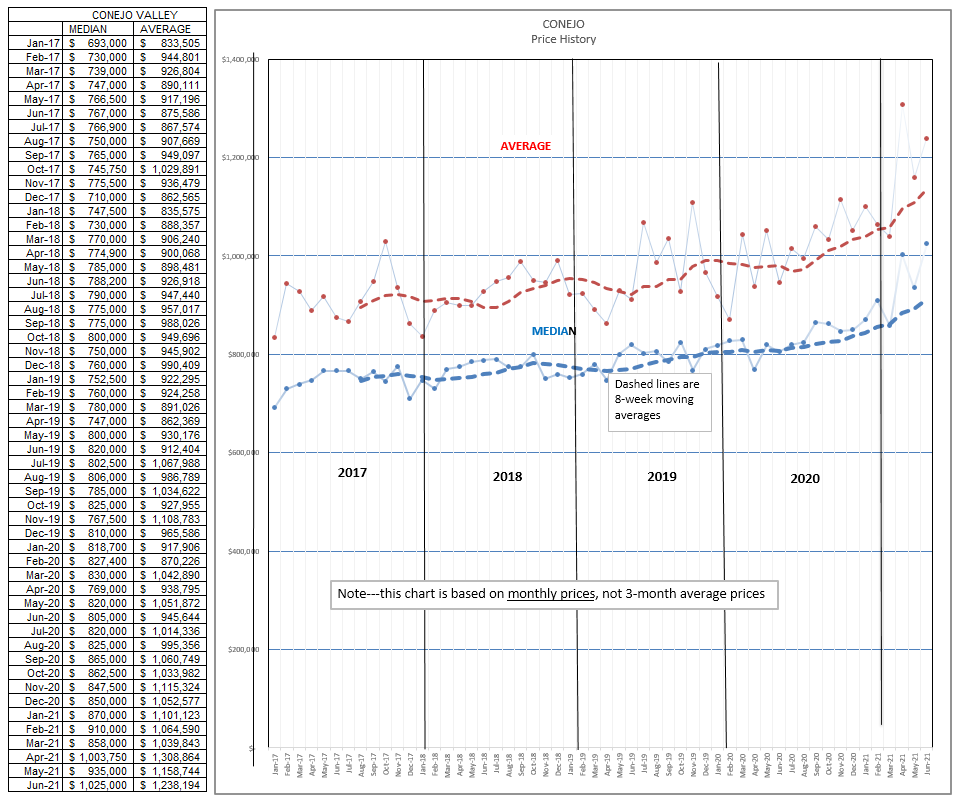
For Conejo, the chart below is based on the median and average prices for each month, not an average over three months. In June 2017 the median price was $767,000. Three years later, June 2020, the median price was $805,000. a three year increase of 5%. One year later, June 2021,the median price of a home in the Conejo Valley is $1,025,000, a one year increase of 27%. The median price using the three-month comparison is 24%. They basically agree.
Simi/Moorpark Inventory is down 66% versus a year ago. The figures are based on the inventory on the first day of the month. Sales figures are based on a three-month total. Due to the steep Covid-caused drop in March and April, it is meaningless to compare sales figures over these time frames. The number of sales are up significantly, but last year they were down significantly. However, it does make sense to look at prices, comparing average and median prices over three months this year versus the same three months last year. According to these figures, median prices are up 19% and average price increased 18%. The numbers are the numbers. Owning a home during the last year is the best investment one could find. Inventory, as measured in how long it takes to sell a home given the rate of sales during the previous three months, dropped from 1.3 months last year to 0.5 months this year. Two weeks of inventory. Strong sales and low inventory resulting in much higher prices.
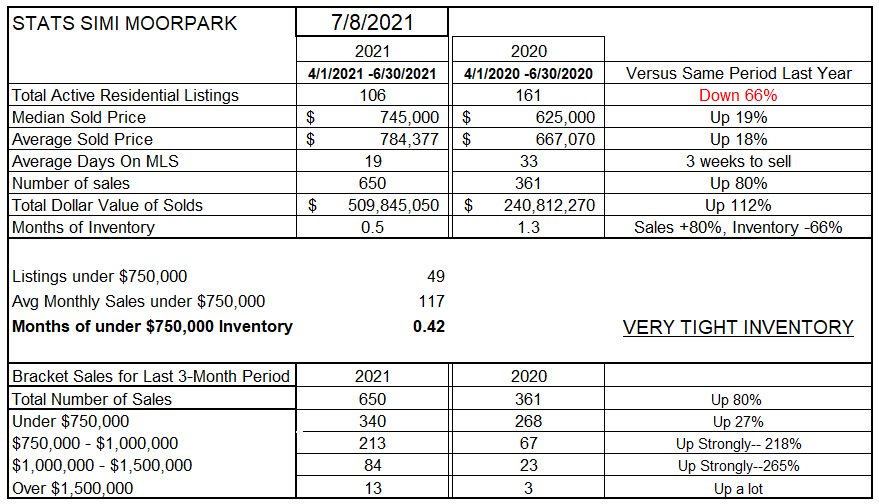
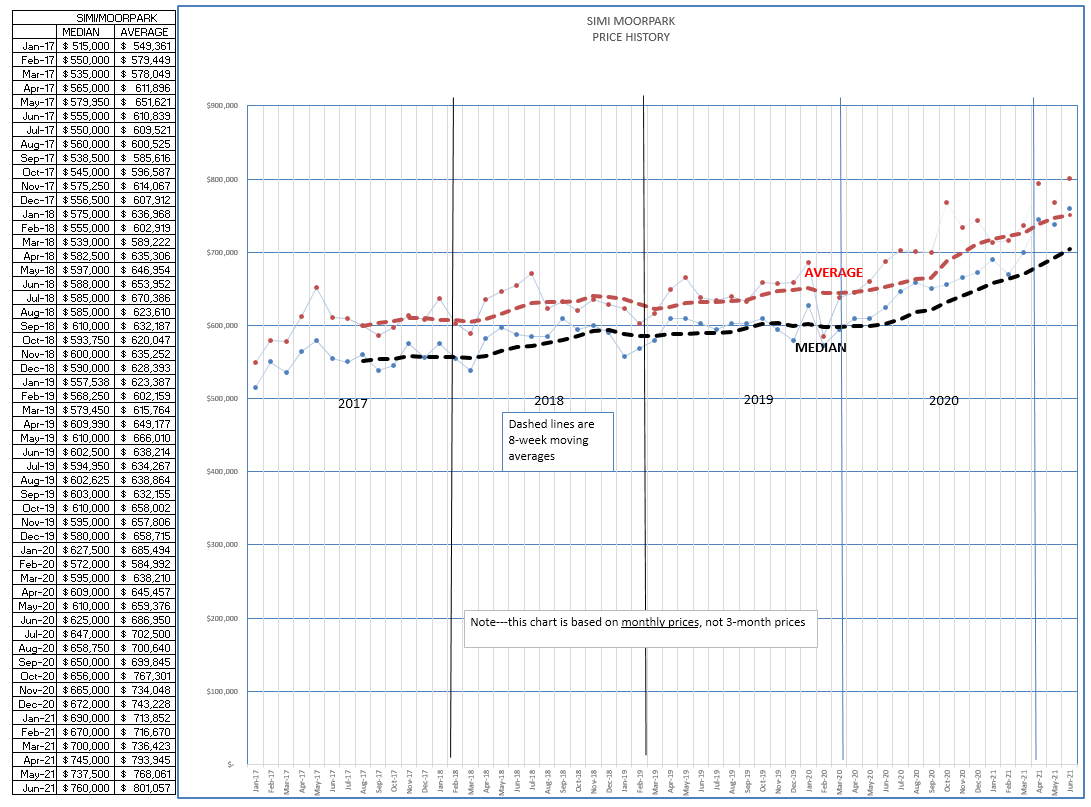
For Simi/Moorpark, the chart below is based on the median and average prices for each month, not an average over three months. In June 2017 the median price was $555,000. Three years later, June 2020, the median price was at $625,000. a three year increase of 12%. Simi/Moorpark has been experiencing low inventories over the past two years. One year later, June 2021,the median price of a home in Simi/Moorpark is $760,000, a one year increase of 21%. The median price using the three-month comparison is 19%. They basically agree.
Where do we go from here? Normal would be my best bet. Normal sales, prices neither falling nor rising abnormally, but as we would expect in a normal year. There will be some jumps and dips, but this is normal as prices search for their justifiable level.
Covid has caused many things to happen quickly, more rapidly than changes would usually take. We got really good at ZOOM, very comfortable having virtual meetings. We sold houses without ever stepping into the house. We got very comfortable doing transactions over the internet. We like working from home, and business will never go back to 40-hour weeks at the office. Amazon seems to visit my home every day, and both large and small shopping centers will forever feel the effects. Commercial office properties and retail are feeling the effects, and perhaps will be repurposed to residential or mixed use. California has been short of housing for a couple of decades, and Covid may have been the moment when everyone realized that truth. Supply and demand continues to affect prices. We are temporarily short of lumber and pipe and electrical wire and appliances, but that will be resolved by normal market forces. When housing becomes this expensive, it becomes more attractive to developers to build housing. This economic pressure is occurring at the same time as the political pressure Sacramento is bringing to push cities to remove obstacles to building, from new construction to ADUs. We are in a different time. Time has been pushed ahead a few years by Covid. These changes would eventually occur, but Covid has fast-forwarded many of the changes.
One thing does not change. Buying or selling a home remains the biggest financial decision most families experience, and they need someone they trust to guide them through the process. Consider yourself a general contractor, building a transaction utilizing a great many reliable subcontractors that will produce a product that makes your client pleased.
Enjoy your summer, enjoy going outside, but remember to stay safe. We are not out of this yet.
Chuck