What the FED wants, the FED has the power to get. And the FED wants to control inflation. In order to accomplish that, although it does not want a recession, a recession will be the result. Probably not a horrible recession, but statistics indicate the economy needs to take a rest. Economists forecasting a recession probability at 100% (according to Bloomberg yesterday).
This is from the FED’s website:
The Federal Reserve works to promote a strong U.S. economy. Specifically, the Congress has assigned the Fed to conduct the nation’s monetary policy to support the goals of maximum employment, stable prices, and moderate long-term interest rates. When prices are stable, long-term interest rates remain at moderate levels, so the goals of price stability and moderate long-term interest rates go together. As a result, the goals of maximum employment and stable prices are often referred to as the Fed’s “dual mandate.”
The FED’s target for inflation is 2%. It considers full employment generally around 95%, with 4-5% unemployment. With unemployment stable this year at 3.5% and inflation over 8% for the past couple of months, the FED has sounded the siren. For the housing industry, the effects are already being felt.
Covid has affected everything in our way of life since March 2020. At first, Covid looked as if it would sink the economy, particularly the real estate market. Many discovered it was OK to work from home, and that fostered a movement into bigger homes located further from city centers. When commuting was no longer an issue, it temporarily changed the way we live. Couple that with the huge amounts of money distributed by Congress in 2020 and 2021, and the FEDs historically low rates, we never really experienced the covid recession that was expected.
Helicopter money was delivered by Washington, interest rates were the lowest in history, unemployment remained low except for a few areas of the economy, mainly workers in lower-paying jobs in hospitality, and the economy was saved. Rather than falling through the floor, the housing market prospered beyond expectations. Now it is time for the economy to adjust, to balance out. All that helicopter money fueled a buying spree that resulted in strong inflationary pressures. Supply and demand were out of balance, along with inventory shortages and delivery problems. With full employment and strong inflation, the FED is now using its normal playbook to get inflation under control. Unfortunately, that medicine tastes bad until it is swallowed. Stopping inflation is like stopping the Queen Mary under full steam, it takes a while to overcome the momentum. It does not happen overnight.
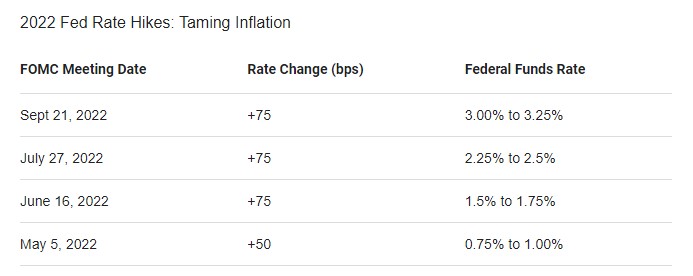
For the housing industry, we were already heading in that direction. The FED cut back on purchases of mortgage-backed-securities at the beginning of the year, causing mortgage rates to rise without the added support of FED backing. Now the FED has moved to medicate the entire economy by raising interest rates throughout the system, with more promised. Mortgage interest rates have gone from 3-1/2% at the beginning of the year to double that number today.
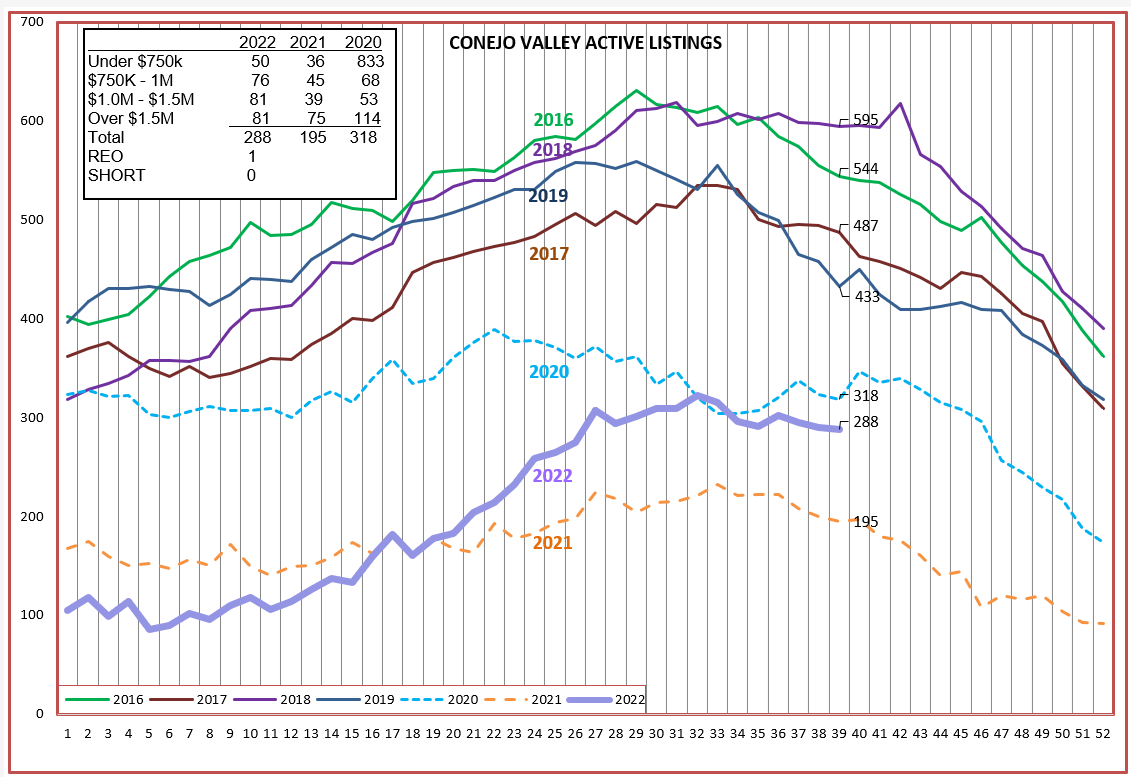
2020 and 2021 were abnormal years, as described above. The graph lines for those years are dotted, to make it easier to look past the anomaly and see how 2022 is performing as compared to what usually happens in a normal year. Except for being lower, the 2022 inventory graph is moving as expected as the year progresses. We started out slow, increased inventory as Spring occurred, hit a high in the Summer months, and now are seeing inventory slide into the Fall and Winter.
As you will see, Sales are beginning to plummet, yet inventory has not grown out of control. Why? This has to do with the second decision people make when they decide to list—where will they go? With prices this high, and particularly with mortgage rates double their current mortgage rate, most homeowners are happy with their current homes, and much happier with their current mortgages. There is not a need to sell, and as last month’s blog pointed out there is plenty of equity to protect. Of course, there is always a base of homeowners with a need to sell: families being created, families expanding, families breaking apart, job transfers, families downsizing, But only the homeowners with those needs are putting their homes on the market.
The housing market is not an on/off switch. It is measured by stronger or weaker, warmer or cooler. With the inventory under control, the price-supply-demand balance should not see a drastic move, nothing like 2008.
Although lower numbers in the chart, 2022 is reacting very similar to the normal years of 2016-2019.
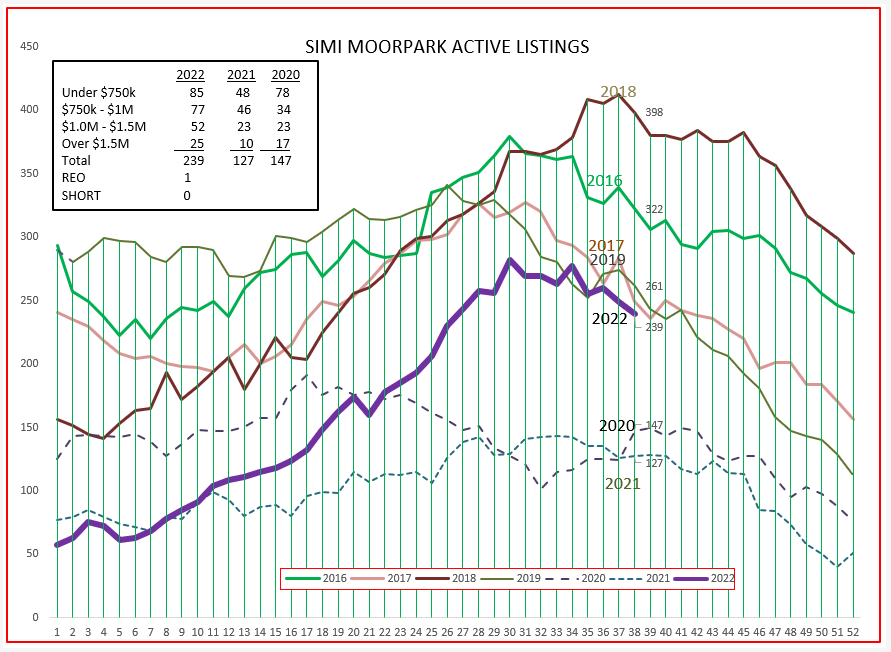
Simi Valley and Moorpark show the inventory also following historic trends. Simi/Moorpark has a median price about $200,000 lower than Conejo, and is therefore more affordable to more people. Conejo has a wider range of home prices, whereas the largest percentage of homes in Simi/Moorpark are closer to their median price. But the reaction is the same, the inventory is finally behaving in a normal pattern.
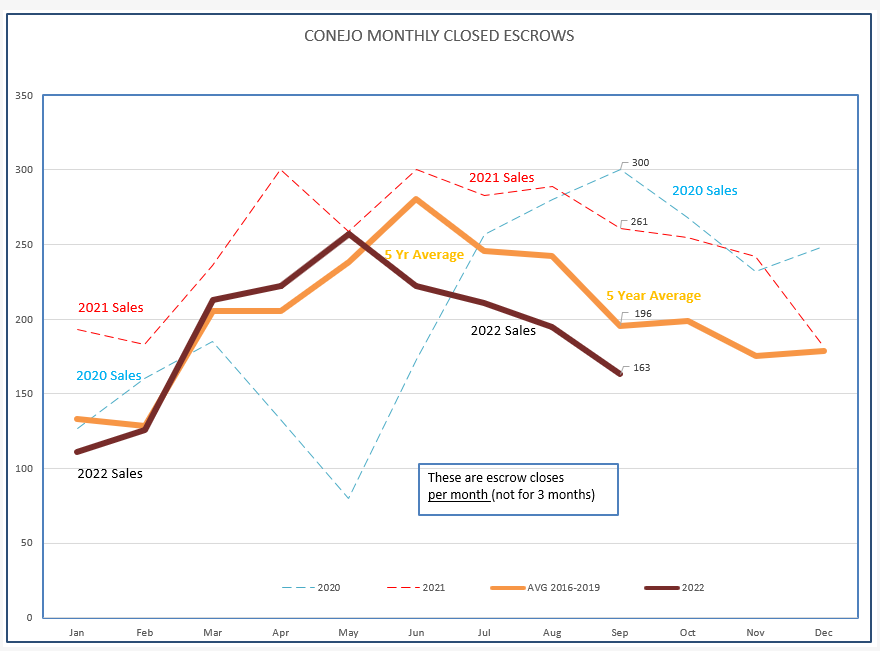
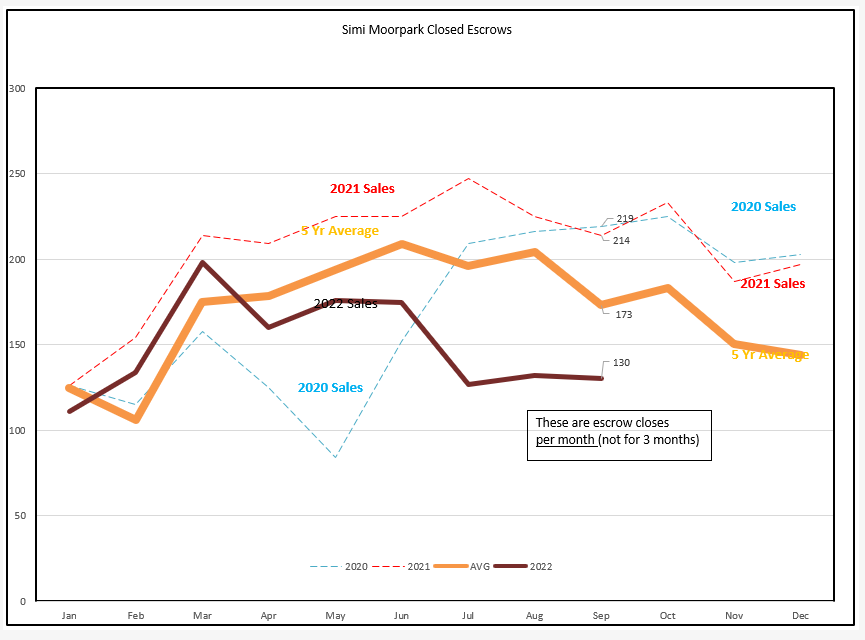
Next we look at the second part of the equation, demand as expressed by sales. Again, the anomaly of 2020 and 2021 is dotted. It’s there, but it was not normal, and frankly it does not make sense to compare 2022 to 2021. It does make sense to compare 2022 to the average sales experience prior to covid. Sales are slowing. We can point right to the rapid increase in prices, doubling of interest rates, and the slower economy. That news affects the way people think, in particular how they think about their long-term decisions. The calculus of buying a home has changed. The forecast is for better times ahead, in a year. The FED is telling the economy, and homebuyers, to slow down, and they are listening.
The chart below is for Simi/Moorpark closed escrows, and displays similar trends. Lower and slower.
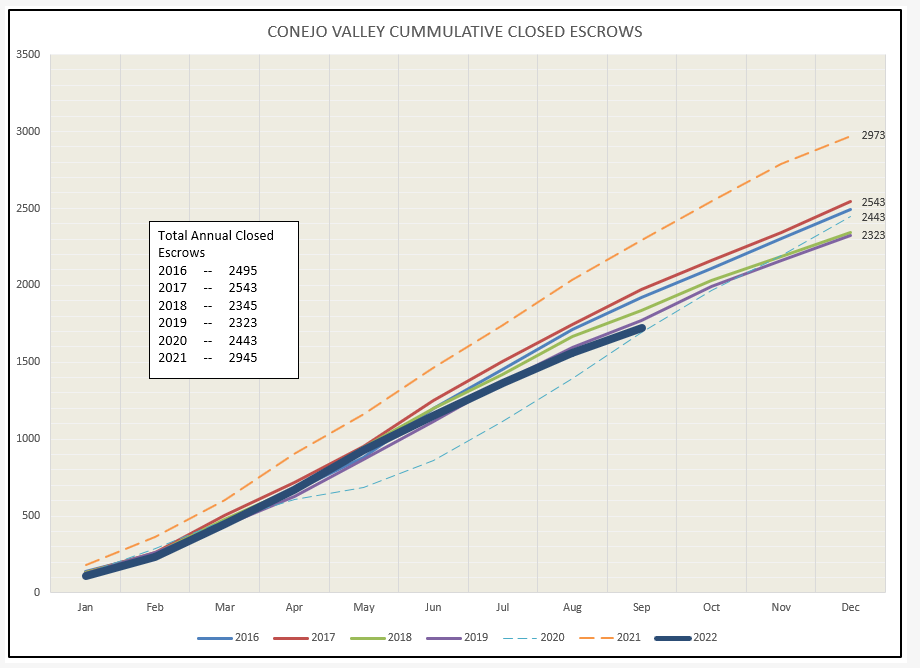
Let’s look at sales (demand) in a different chart, this one representing the total number of sales as the year progresses. Again, look past the dotted lines. You will see that the heavy purple line (2022) is trending downward. Yes, the housing market is soft, sales are soft. But as you can see from the chart, not zero, just softer than the other years.
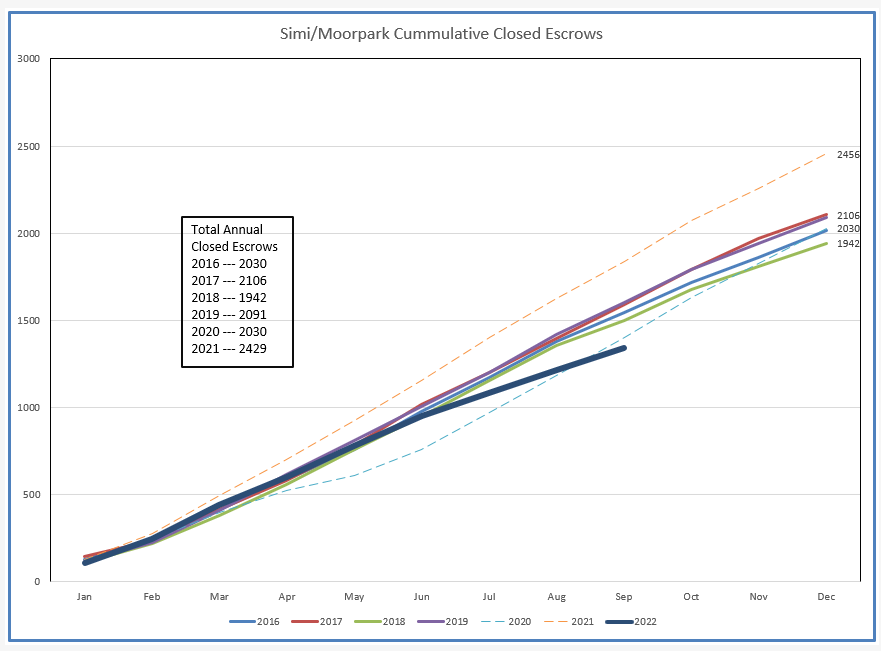
SImi/Moorpark has a similar chart, but showing a more dramatic dropoff. Since this area’s median price is about $200,000 lower than Conejo, it is more affordable to first-time home buyers. They are the ones who have the biggest hurdles to overcome, not only interest rates but in their initial deposit due to the 35% increase in home values we experienced during the past two years. FHA and particularly veterans with VA mortgages, who were basically shut out of homebuying over the past two years due to auctions and all-cash purchases will finally be able to get back into the market, particularly when mortgage rates subside.
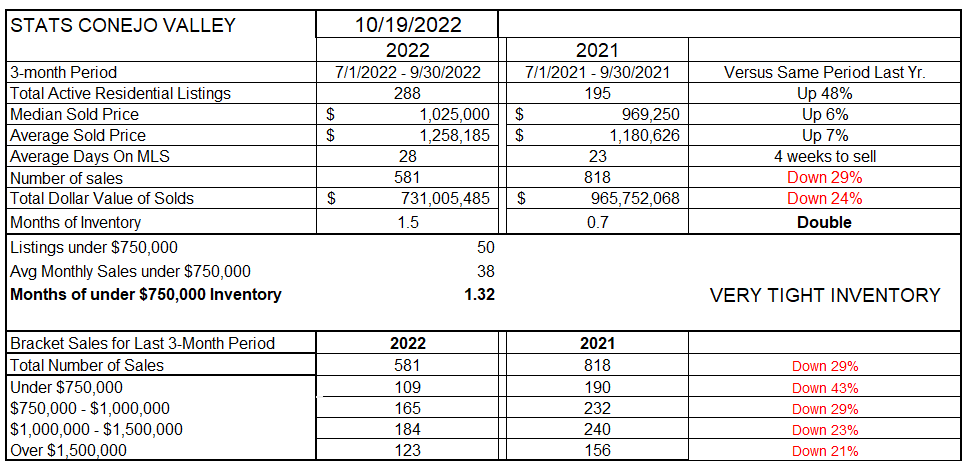
Next, let’s review the table that you have been used to seeing. The figures in this chart are mostly based on 3-month averages. My decision to use 3-month-averages is due to the differences that can happen in a short period of time, which may confuse the picture of whether numbers are going up or down, and by how much. Averaging makes it easier to see long-term trends. However, it does not point out short-term trends. We ill look at those shortly.
Inventory is up dramatically, 48% over the same time last year. But remember, the last two years were an anomaly, so not necessarily the best comparison.
Prices have increased year over year by 6-7%. According to the latest figures, that no longer keeps up with inflation.
The number of sales during this comparison of 3-month periods is down 29%.
Most interesting is how the relationship between inventory and sales is changing. The concept is that if no new homes came onto the market, how long would it take to sell off the current inventory. Last year, about 3 weeks. This year, about 6 weeks. Double.
At the bottom of the table, you can see which pricing traunches are more or less active than the previous year. All are struggling.
For Simi/Moorpark, the increase in inventory is almost double at 88%. Simi/Moorpark had been experiencing lower inventory much earlier than Conejo, and the percentage increase is heightened by a much lower base of only 127 active listings in 2021.
Prices are now up 5% year to year, based on that 3-month average. The number of sales for the 3-month period is down 43%, and the months of inventory is now triple what it was last year at this time. No more of homes flying off the market. I have begun to hear one of my favorite words, missing for a couple of years: NEGOTIATION.

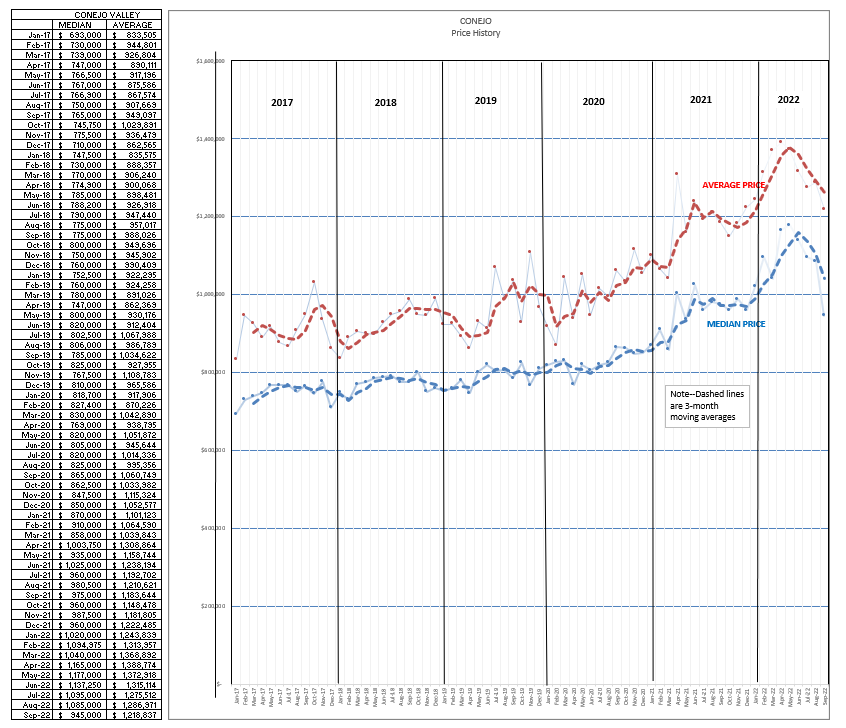
Now lets take a look at prices differently, monthly prices instead of 3-month averages. This will give us a clearer picture of what prices are doing, not balanced out over three months.
The table above shows price increases slowing down 5-6%. This chart clearly shows them dropping. (The dashed lines are 3-month averages.) The just-released CAR forecast thinks prices will decline by 8.8%. They are already declining, but a precipitous drop like 2008 is not in the cards. 2008 was truly a buyers market, or more accurately a foreclosure market. In each of the valleys there is currently only one REO. The lack of a need to sell will keep prices supported, although there is certainly reason to believe prices need to re-adjust after the crazy two years we have gone through.
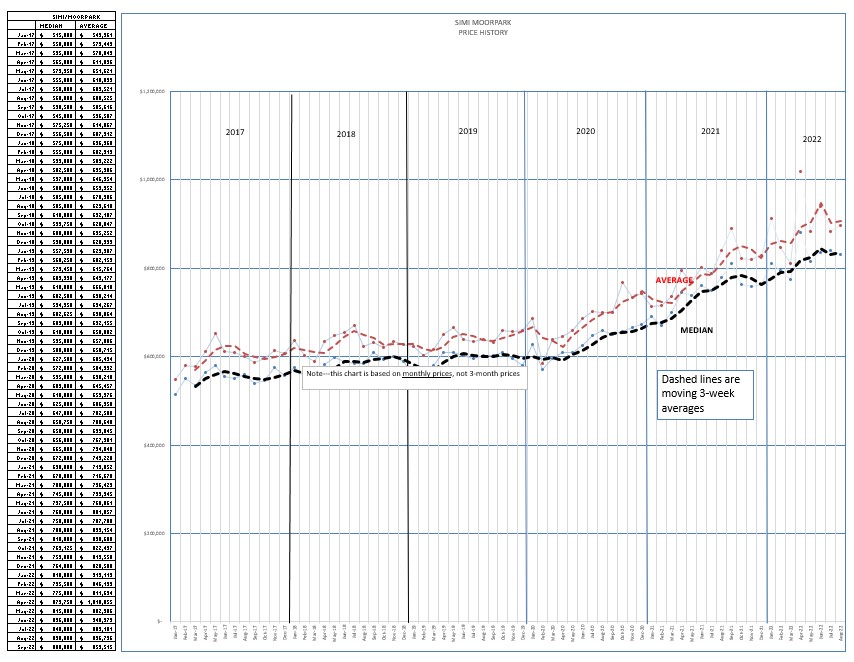
Simi/Moorpark overall prices did not show a climb as strong as the Conejo chart above, because Conejo has a much wider range of price points. But a softening is showing.
The market usually slows down this time of year. At present, the slowdown is severe. A recent report from homebuilders says there is also a strong slowdown in new construction. Because we have a shortage of homes, that slowdown in new construction will help support existing home prices.
The seasons we celebrate are quickly upon us. It is time to be thankful, to look forward to a new and prosperous year. The medicine tastes bad, and is difficult to swallow, but it is temporary. It is a process of getting things back to normal.
And remember, you are the authority on the housing market. National news from NAR, statewide statistics from CAR, even this blog about our local areas are somewhat interesting. But your clients want to know what the value of their home is doing, what did that home down the block sell for? All real estate is local.
Stay healthy and stay safe.
Chuck