We have been patiently waiting (or perhaps hoping) for the market to provide us with better news. With the current statistics, we seem to be moving in that direction.
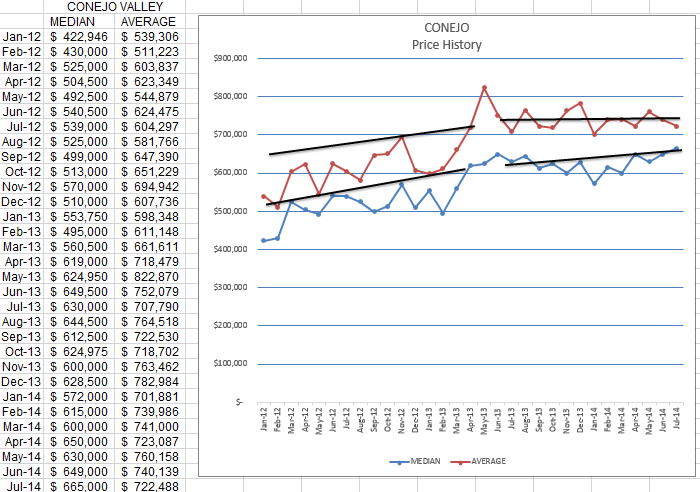
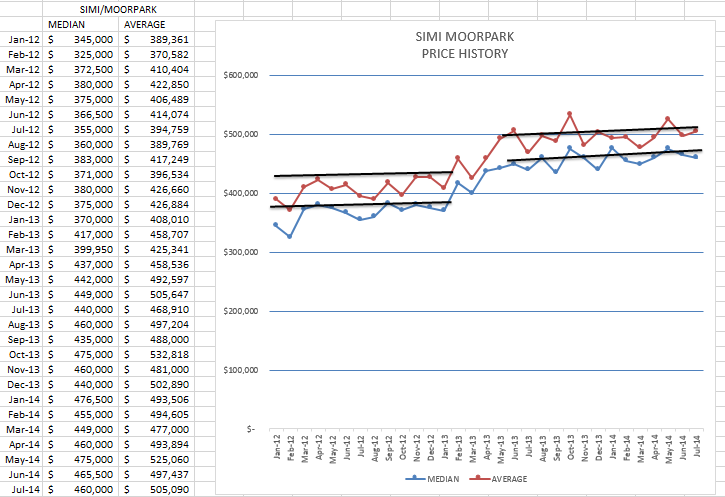
Prices are up. Not significantly, but consistently. Finally. The median prices are trending upwards, averages are flat. That indicates that the lower priced homes are increasing more than the higher priced homes. Price trends are similar for both Conejo and Simi for the past year. The average price for Simi/Moorpark actually increased, whereas it was flat for the Conejo. That is due to the lower percentage of high priced properties in Simi/Moorpark. Lower priced properties are the ones experiencing price increases.
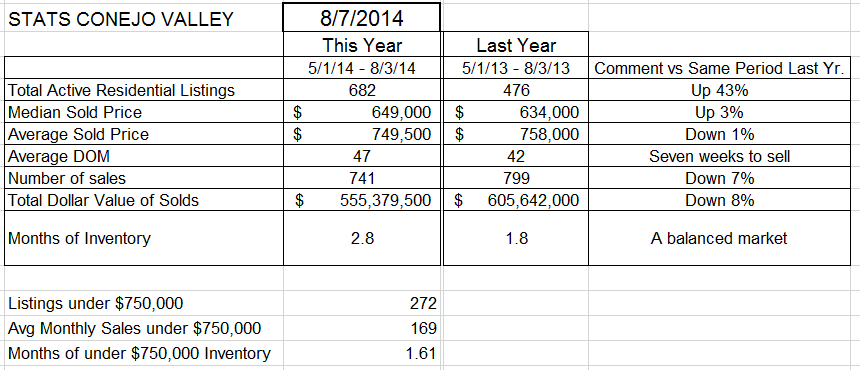
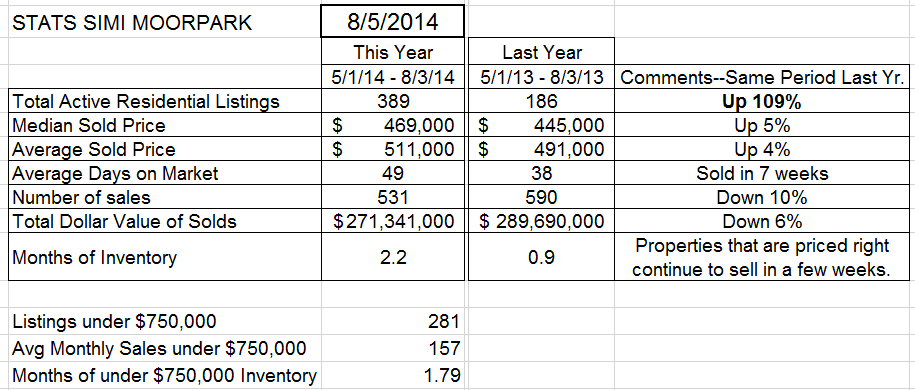
Let’s take a look at the statistics table for both areas. Price increases are 3-4% for both valleys. You may not see this number reported elsewhere for some time, because many of the reports are year to date comparisons, encompassing the entire year, or for a specific month. The statistics below are for a three month period, May through July, this year versus last. Why three months? Like goldilocks, three months info is not too much, not too little, but just right. I think three months gives us an indication of what is happening now, how things are changing, without the averaging effect of dealing with an entire year of data.
Months of Inventory are reasonably low for both areas. Inventory has grown, which makes the months of inventory figure increase, but the recent strong monthly sales push the number down. Not down as much as last year, where Simi in particular had less than a month worth of inventory. But months of supply is less than 3 months, a good, healthy number to be around.
The number of transactions (sales) is still a problem, down 7% in Conejo and 10% in Simi/Moorpark. But there seems to be strengthening in the market.
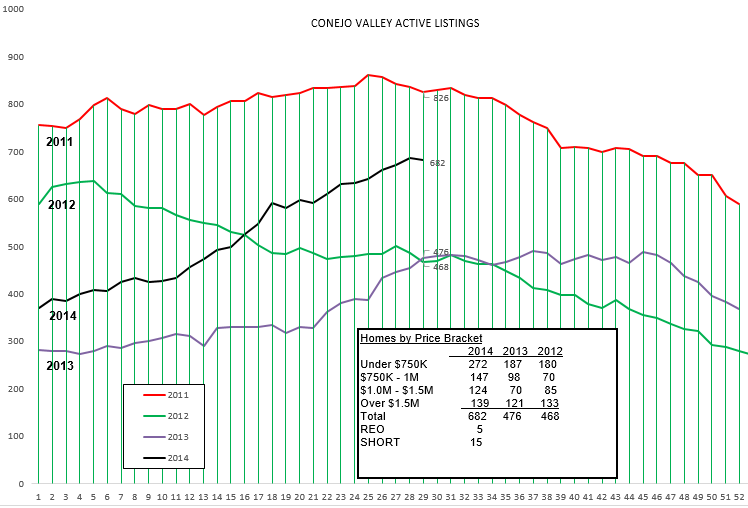
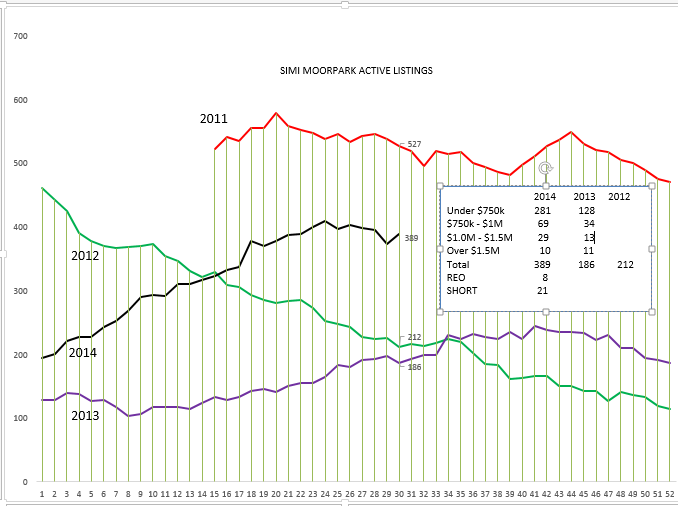
Looking at how inventory levels compare over the past four years, we can see that both valleys graphs are consistent.
And they are consistent as far as the market segments in the boxes. The most expensive segment, homes priced over $1.5 million, has stayed reasonably consistent. The other market segments have increased significantly. The overall curves mimic one another, year by year. On average, the graphs follow the same slopes. Neither valley has any significant amount (less than 30) of financially challenged listings. (REOs and Short Sales)
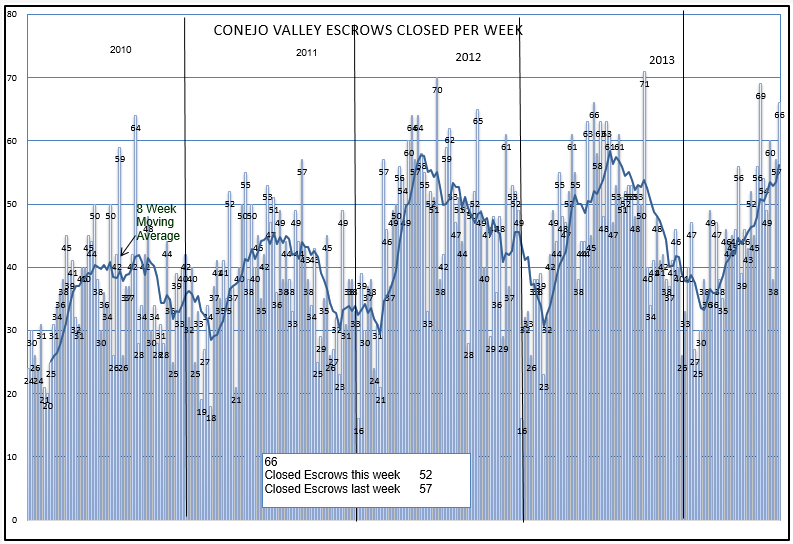
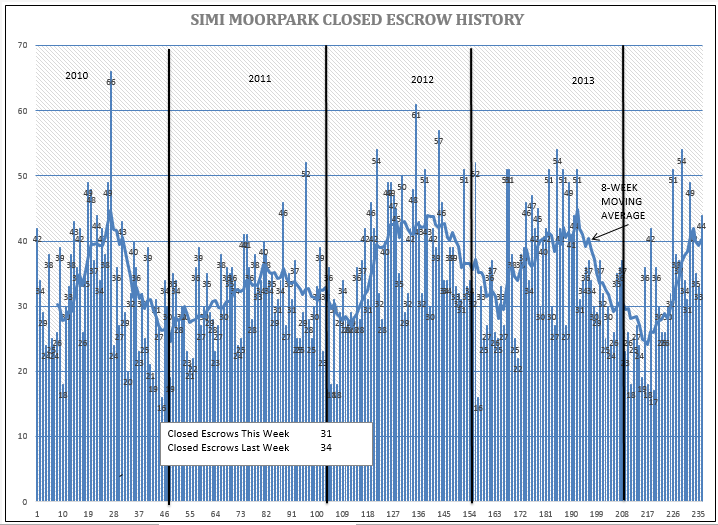
Sales continue to mirror the past two years. Both valleys had a very strong second half of the year in 2012. Sales continued strong towards the end of the year.
The inventory has increased significantly. Percentage-wise, the increase in Simi/Moorpark is huge, but that area had a much lower base of comparison. Last year, Simi/Moorpark had less than one month worth of inventory. This year, the amount is 2.2 months, and 2.8 months for the Conejo.
For homes priced below $750,000, both areas compute to about 1.6 months worth of inventory.
What are people looking for, what is flying off the market? The Completely Unofficial CSMAR Economic Forecasting Group (Tim Freund, Dave Walter, and yours truly) met this week and for once everyone agreed. If homes have been updated, if they are ready to move in, if there is no major work to be done, if they are priced according to current sales, those homes fly off the market. If homes are tending toward original condition, no matter how well maintained, or even worse if they have major upgrading needs in their future, plan for a long selling period, one involving a series of price decreases. Pricing is very important in this market, condition even more important. These buyers are very well educated. Buyers realize they have more to choose from, and they are voting for well-presented properties. As we move toward the end of the year, this situation will be even more pronounced.
We always talk about supply and demand. That description is a shortcut. We should talk about supply and demand and price. These three elements influence one another. When supply outpaces demand, prices fall. When demand outpaces supply, prices rise. But price is not only a result, it is a factor, an element. It can influence both supply and demand. As prices rise, demand slows down. As prices fall, demand picks up. How about supply? Supply is made up of a huge number of individual decisions.
- Are prices going to fall, should I get out now and sell?
- Are prices going up rapidly, should I buy a home for a rental?
- Are rents going up, should I stabilize my rent for the next 30 years by turning it into a mortgage (buying)?
- Is this a divorce situation?
- A death of the owner?
- Are we downsizing?
- Do we need more room?
- Job transfer?
- Lost my job?
- Moving?
- Retiring?
- Have problems keeping your mortgage payments current?
There are probably a few people that buy or sell a home because they consider it an investment, and buy and sell based on prices and expectations. A few, maybe, but a very small minority. Homes are places to live, they are usually our largest investment, they have done well over time. People do not day-trade their homes. The main reason inventory goes up and down is due to an accumulation of all these individual decisions. Therefore, in the relationship between supply and demand and price, supply is the least volatile, the least effected.
And that leaves us with price. Home not selling? Reduce the price. Or spend some serious money bringing it up to date. If not, don’t hurry to pack.
Have a prosperous week.
