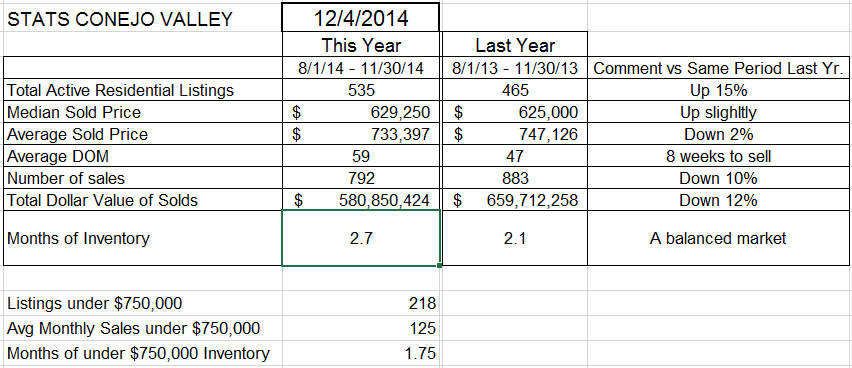
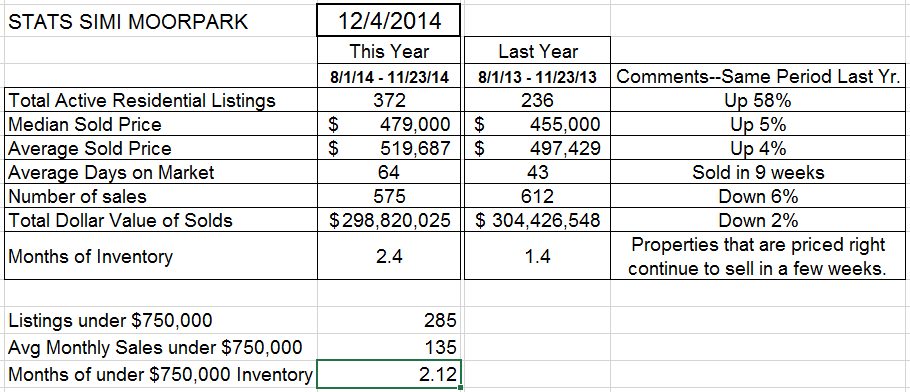
Let’s start this blog with the things you need to know, with the statistics you need to include in your elevator speech. This generally comes from the STATS page.
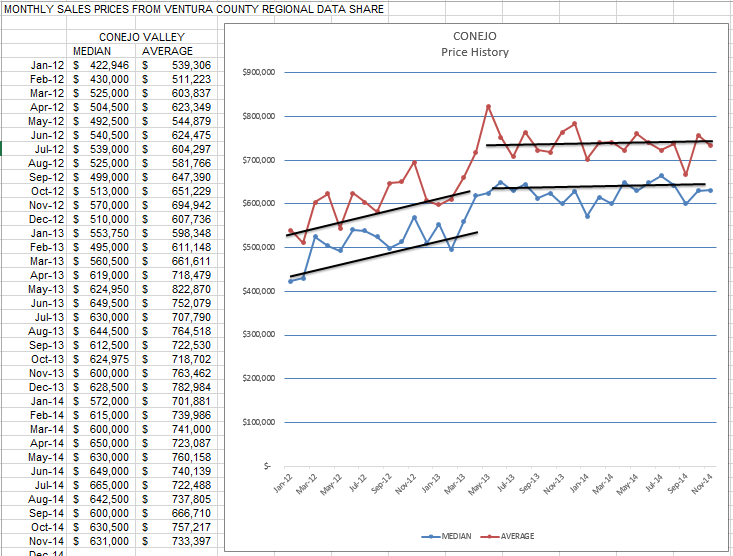
In the Conejo Valley, active listing inventory is up 15% from a year ago, while prices are even with last year. Even though the available inventory is up, the number of sales are actually down 10% from the same 4-month period last year. Inventory remains balanced, at three times the amount of monthly sales, giving buyers more to choose from. Last year, inventory was only twice the number of monthly sales, 2 months worth of inventory. But look at the homes priced below $750,000. That amount of inventory indicates we are short of homes priced below $750,000, less than two months worth. What this is telling us is that if we sold off all our inventory without anything new coming onto the market, we would be completely out of these homes in less than 2 months. Those homes have pressure for increased prices. Overall, the cloud generated by the second Amgen layoff announcement cannot help but affect people’s feeling about the direction of the market, perhaps temporarily stalling price increases.
Simi/Moorpark is a different story. Active listings are up a whopping 58%, and home prices up solidly by 4-5%. The number of sales is down, but only 6% versus 10% in Conejo. Inventory represents 2.4 months worth of sales, versus only 1.4 months worth of sales last year. Homes priced below $750,000 are comparable to Conejo, 2 months worth of sales.
Those are the comments for your elevator speech. That is what I would say if all I did was look at the charts. But luckily, I know some realtors who tell me what they think is happening. In certain price ranges, in some areas, the inventory of homes is very sparse. Some of the homes listed are not the perfect listing, some are near schools, some back to busy roads, some remain overpriced. We have buyers who are searching for homes that we cannot find. All real estate is local, and in some localities there is nothing available that matches what buyers are looking for. Very frustrating, when you consider the overall numbers.
Let’s now look at the two valleys separately, inventory and closed escrows, and see what stories the graphs are telling us.
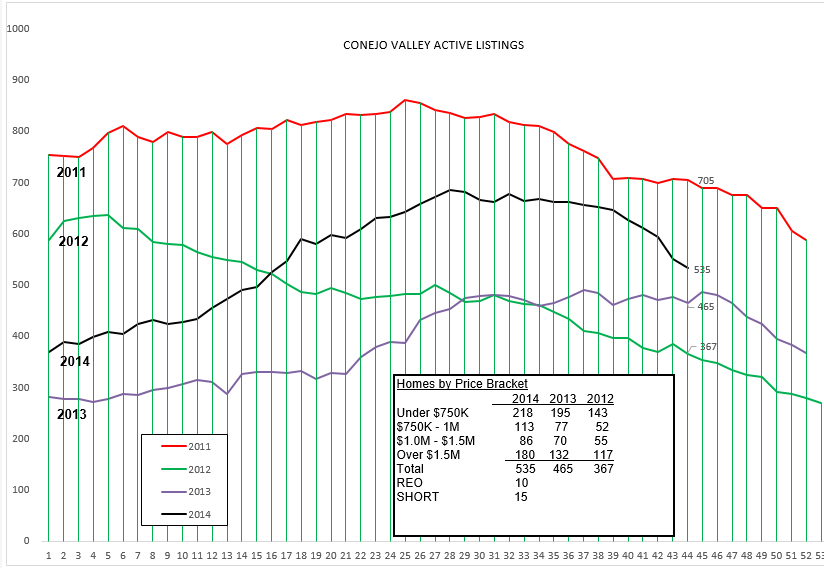
The inventory graph is doing what we would expect the graph to be doing at this time of the year. The biggest growth in inventory is for homes priced over $1.5 million. REOs and Short Sales remain a small fraction of the available inventory.
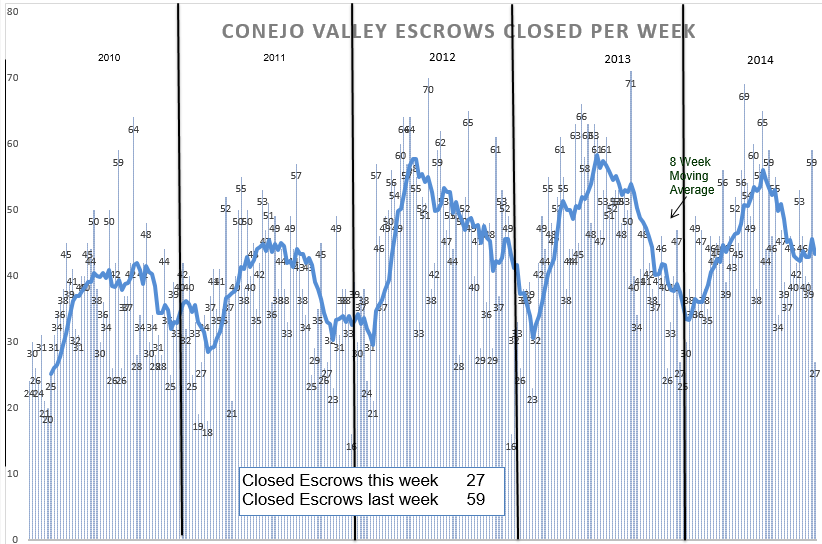
Strong sales, robust sales, consistent sales. Not as good as last year, but still healthy. Why not as good as last year? Because in the first half of 2013, prices went up significantly. (see below). When prices go up, they affect how many people can purchase homes at the new levels. When prices go up, demand tends to go down. Again, a good market, but not as good as last year.
In the statistics above, the median sold price has increased slightly, while the average sold price has decreased by 2%. That indicates more lower priced homes that are selling for close to or over the asking price. As the inventory has grown, the inventory of homes priced below $750,000 has decreased. Homes in the lower priced categories are experiencing increasing pricing pressure, while homes in the higher ranges are experiencing downward pricing pressure.
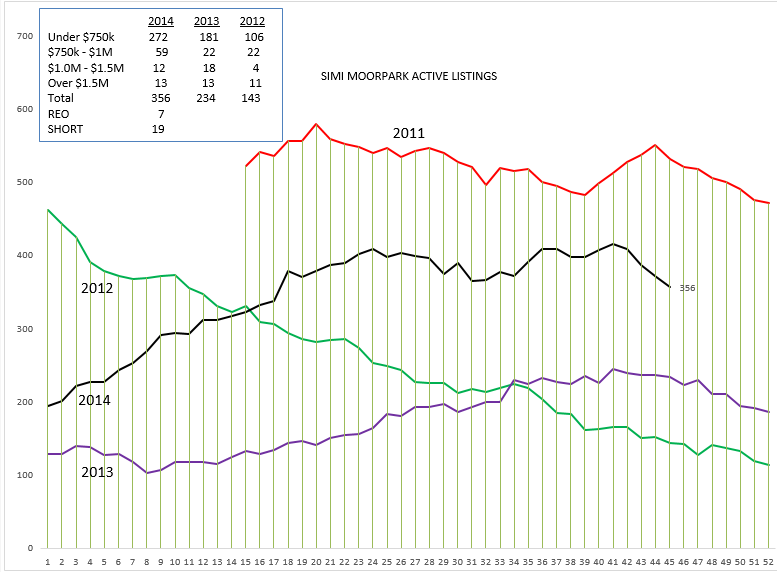
Now lets move to Simi/Moorpark and see how their dynamics are a little different. The inventory has normalized from an unbelievable low level in 2012.
The inventory is trying to normalize for the year end drop, but is stubbornly resisting the usual drop.
The inventory was extremely low in 2012, and declining all year. When a market has an imbalance between supply and demand, prices rise or fall to adjust. When it comes to housing, that rise or fall in prices affects the demand side more than the supply side. The vast majority of homeowners do not decide to sell their homes because they want to make a quick profit. There are usually many other reasons why homes are placed on the market. Sometimes the reason is a divorce, or a relocation, or a growing family needing more room, or a shrinking family needing less space, sometimes due to a probate, sometimes moving into a retirement home. All these reasons taken together add up to the base of how many homes come onto our market every year. All these reasons are not strongly affected by price.
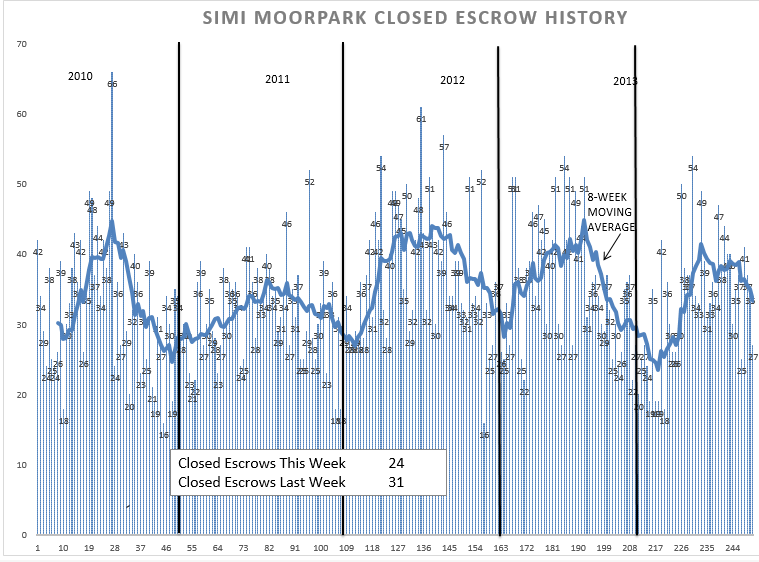
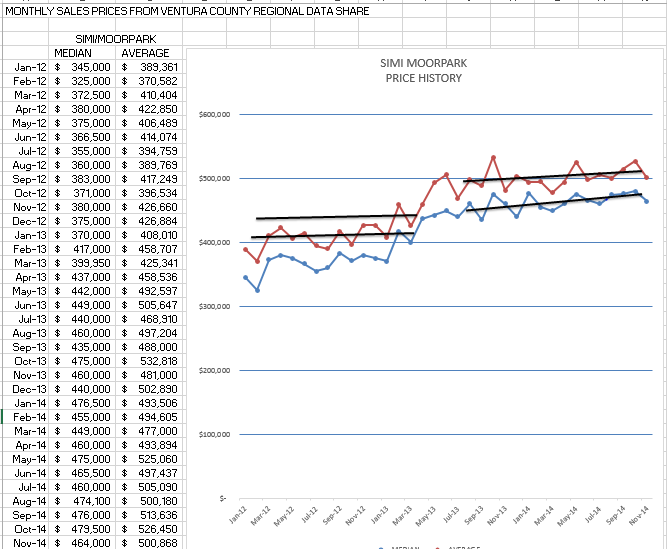
Sales figures above are reasonably consistent year to year, a little affected by the economy, a little by prices. But prices increases are consistently stronger than they are in the Conejo Valley. There are two reasons for this. Simi/Moorpark has a higher percentage of homes in the under $750,000 category, and that demand remains stronger than for higher-priced offerings. Secondly, Conejo is still operating under the “Amgen Pall”. There still is a concern over the affect of Amgen layoffs.
Prices have been increasing 4-5%, a little higher than overall inflation. SImi/Moorpark had a very quiet beginning of the year in 2014, but activity has caught up and seems more “normal”.
It’s time to make your business plans for 2015. Stella Balasanian, our company coach, will be here next week Thursday at the Thousand Oaks Library to insure we have all the information and the proper attitude to start of 2015 as your best year ever. If you are interested in attending, just let me know, you are most welcome. 805-551-1162
Chuck
