At the C.A.R. meeting last week, everyone was talking about the lack of inventory. Are they kidding? The inventory numbers have been up for the past two years. The inventory is not huge, but definitely better than last year, and that year was better than the year before. So why is everyone talking about a lack of inventory?
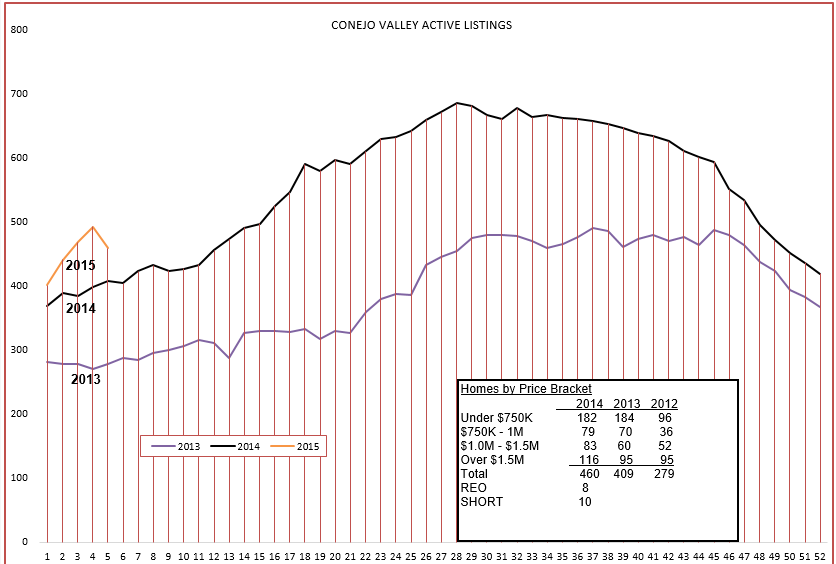
Look for yourself. Let’s start with the inventory chart. Since we have come out of a horrible recession, with inventory corrections taking place, let’s only look at the last two years, the last two normal years where the inventory starts out low, increases through the summer, and then recedes going into the end of the year.
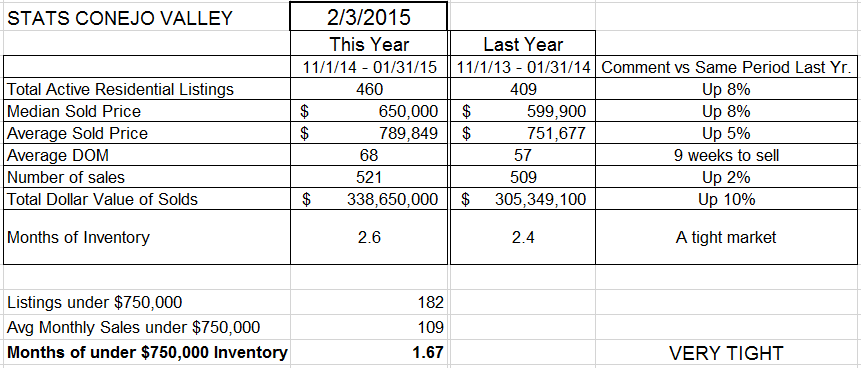
Looking at these charts, we should not really have a lack of inventory. We did in 2013, but 2014 had higher inventory with lower sales, and 2015 is starting out with higher inventory. Our average price in the Conejo is between $750,000 and $800,000. Out of a total of 460 active listings, how many are in that range? Hmm, only 23. I would have expected a lot more than 23. OK, how about from $700,000 to $750,000? Hmm, only 25.
How about under $700,000? 160. Good number, good choices available, good inventory. But when your average and mean prices are closer to $800,000, you assume that is the range where a lot of homes will be available.
We have a lot of people looking between $800,000 and $1,000,000. That is where we would like to find a lot of listings to show. That’s a $200,000 spread. How many listings? 59.
The meat of our market, the area that most people are looking for, has 107 homes available. People will begin fighting over those homes soon. Why aren’t they fighting over them now? Many of these buyers are relo buyers, and they share the feeling that prices should be going down. You can make a good argument for prices to be going down. But you have to convince the sellers to sell at those prices, and they are unwilling. There are not many sellers.
Buyers will be fighting over the limited inventory once reality sets in, but we are too early in the year for them to get real. But Supply and Demand will take over. It always does.
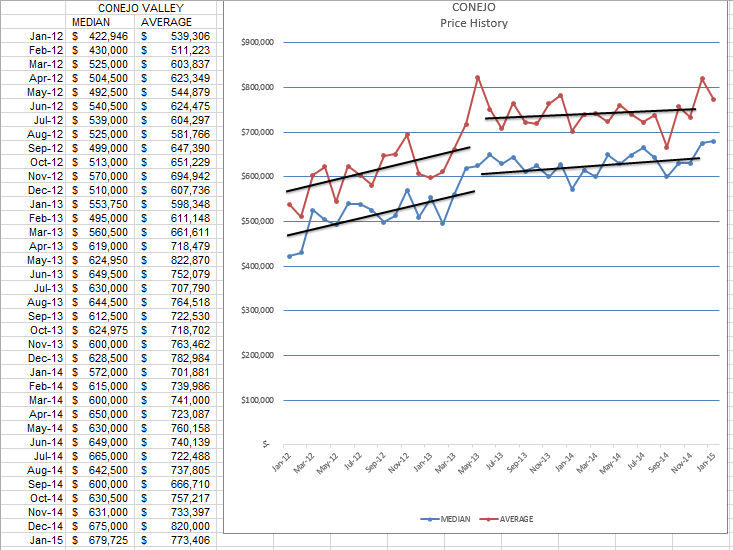
How have prices been doing? Remember, I am comparing three months at a time to the same three months a year ago, not an entire year that has the effect of averaging price changes.
Compared to the same three months last year, inventory is up 8%, but prices are also up 5-8%, the number of sales is up 2%, and the inventory of homes priced below $750,000 is a very low 6 weeks of inventory. There is one more thing that is up, one that is hard to measure: DEMAND. Lots of people looking, making offers, but low offers. Offers that are not being accepted.
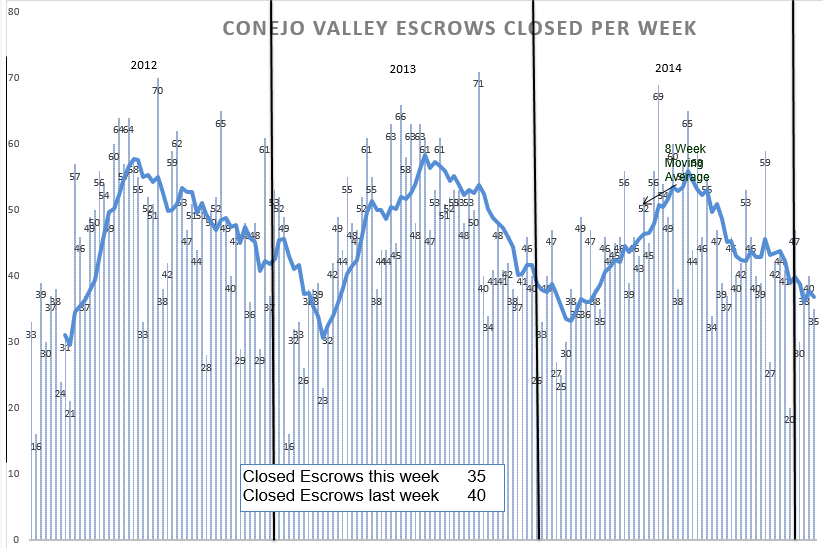
How does the closed escrow chart look for the beginning of this year?
We are beginning the year stronger than last year, stronger than the year before.
Remember that months of supply has two components. One is inventory. How long that inventory lasts (the months of supply) has to do with the rate of sales, of closed escrows. When demand is high, the months of supply goes down, even though the inventory number may stay the same. That appears to be what is happening.
One other consequence of high demand and low inventory—prices go up. Our recent history shows prices going up at the beginning of the past few years, and then leveling off. That appears to be what is happening again.
All these factors influence one another. If all we were dealing with was supply and demand and price, it would be easier. But we are also dealing with our two main employers either moving people or laying them off, or hiring new employees and moving them in. If I knew what was going on with them, my crystal ball would be more clear. Some of that is dealing with rumor. Our inventory and escrows are dealing with fact. It seems instead of having an inventory with a bell-shaped curve, higher in the middle and lower at both ends, we have an inventory like a valley, higher at both ends and lower in the middle. You cannot just look at the overall numbers to know what is going on, you have to look at the individual price levels. All real estate is local, geographically local but also price-local. Something very interesting is going on, and the story will not be fully understood for some time.
So what do you tell your clients?
There is very strong demand, and inventory is low. Because of those two factors, we expect upward pricing pressure.
Things are still unsettled, but everyone is surprised that the market is as strong as it is.
To be fair, I have to give a great deal of credit to Tim Freund for much of this analysis. His study comes not so much from a scholarly inquiry as it does from trying to find properties for his clients and having great difficulty doing so. Thank you for sharing, Tim.
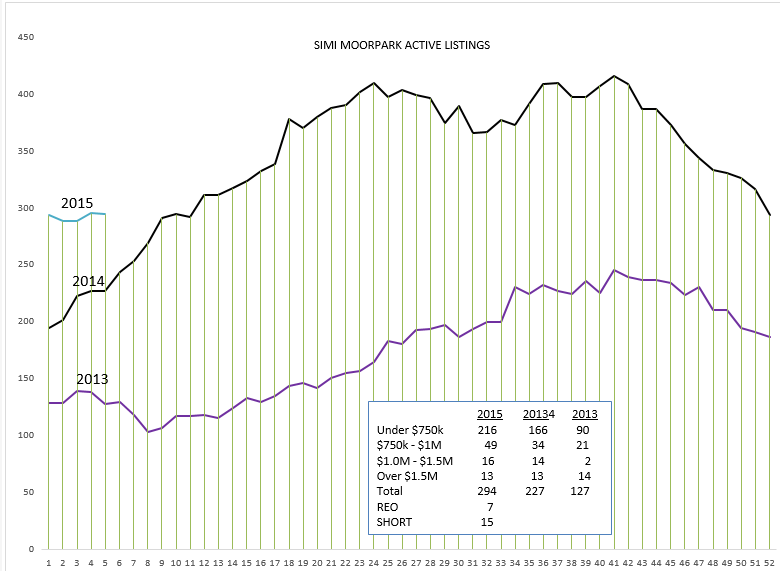
As for Simi/Moorpark, much the same but not as influenced by these two big employers.
Inventory started out higher than the previous two years, but does not seem to have growth in the graph.
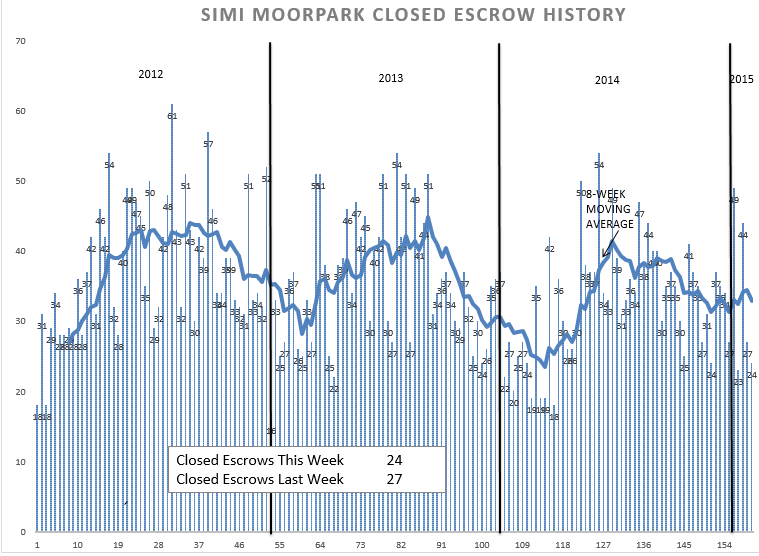
The first half of last year was very weak in Simi/Moorpark, but then the market took off and seems to be continuing strong.
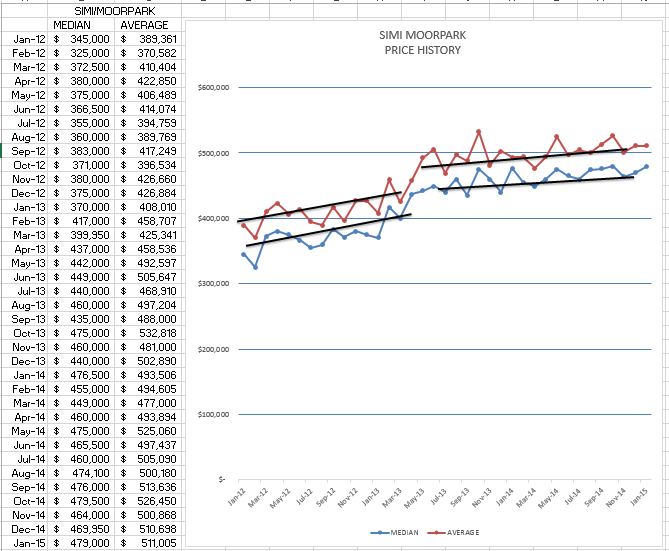
Price history has been stronger and more regular in Simi/Moorpark, and their pricing continues to be strong.
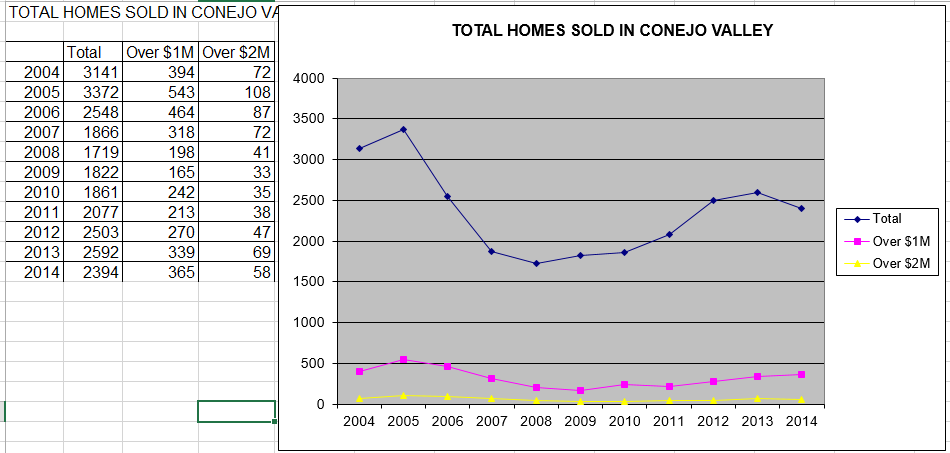
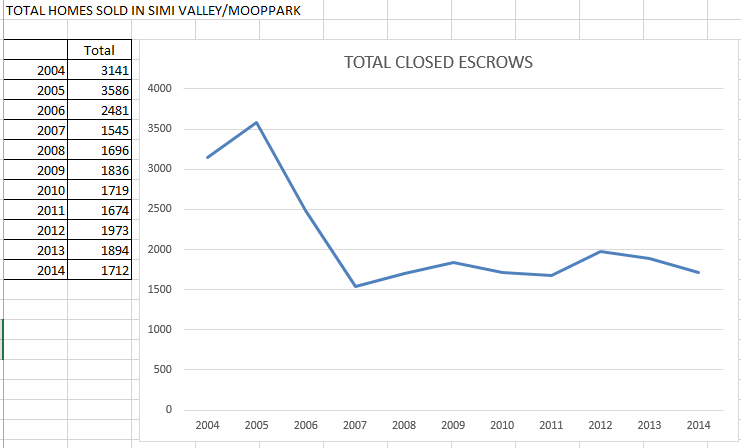
These last two graphs are the most interesting when showing the differences or similarities between our two valleys. They show the history of closed escrows over the past 10 years.
Simi/Moorpark, being lower priced in comparison to Conejo, have been extremely consistent for the past 7 years. But in those past 7 years we have gone through thousands of REOs and Short Sales, government incentives for first time buyers, blocks of purchases by investors wanting to rent out homes, thereby taking them off the market. There have been a lot of factors and pieces of the market that are no longer present.
Now that we are back to a normal market, it should make everyone feel more confident about the future. I hope you agree. Please let me know your thoughts.
Chuck
