That is the word chosen by my office sales partners that best describes the housing market right now—BOOMING.
Given our recent past, that initially sounds scary. This is not a “balloon” booming, but a seriously strong market.
Everyone seems to be talking about the lack of inventory. Let’s look at how our inventory looks, and how it compares to the last three years.
CONEJO VALLEY
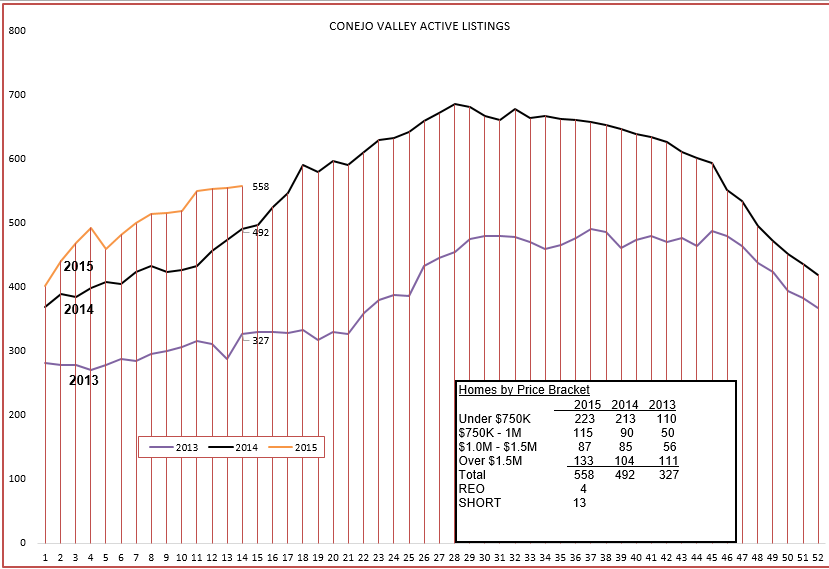
For the Conejo Valley, the inventory is 17% higher than last year, and much higher than 2013, when we had a dire shortage of inventory. Although our inventory is up from this time last year, the slope of the line shows it is climbing at a low rate, slower than last year.
Inventory is a result of the combination of housing coming onto the market and housing going off the market, going into escrow. If more homes come onto to the market than we are selling, the inventory increases. Our inventory is climbing, as expected this time of year, but it is increasing more slowly than last year.
While our inventory situation is better than 2014, it is important to look at the level of sales in addition to this inventory chart.
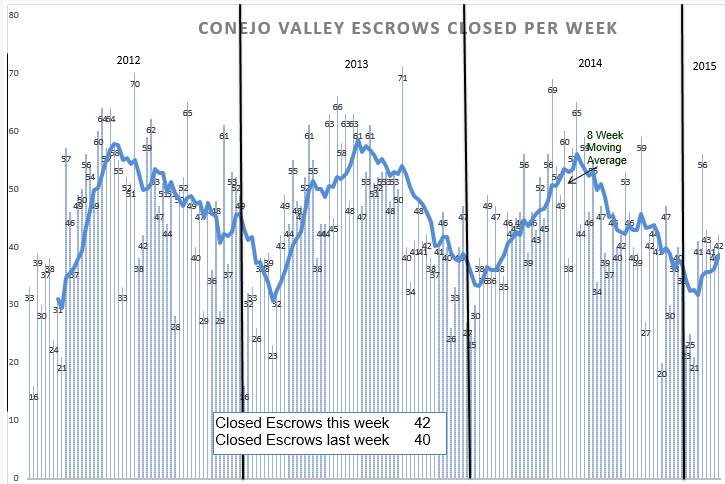
Conejo had a slow start for the year (the big white space under the heavy blue line), but now sales are very strong. The chart above records closed escrows. What is happening now? The market is extremely strong, and this strength will be reflected as closings are recorded over the next month.
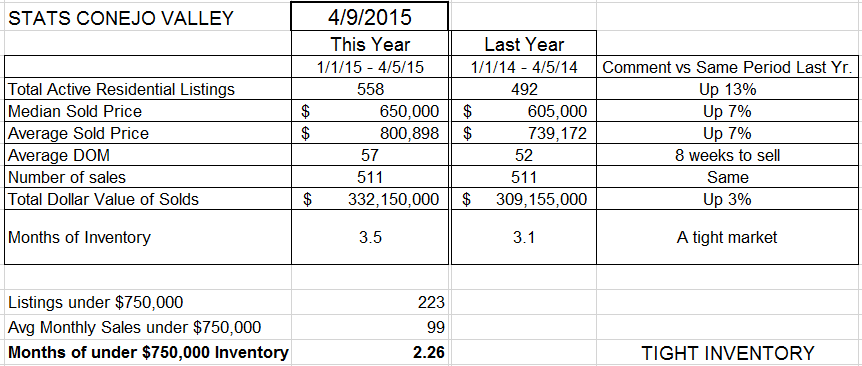
Prices are up 7%, the number of closed sales is the same as last year, inventory is up 13%, and selling prices are coming in around 95% of list prices. There has been more negotiation taking place on listing prices. However, we are now starting to see many more multiple offer situations.
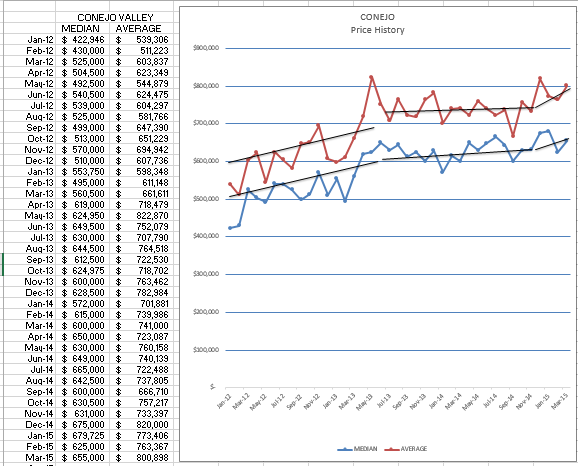
Prices in the Conejo were climbing only a little last year, but the first few months of this year has taken a serious increase. See the chart below. We have experienced price jumps in the first quarter of each of the past three years.
SIMI/MOORPARK
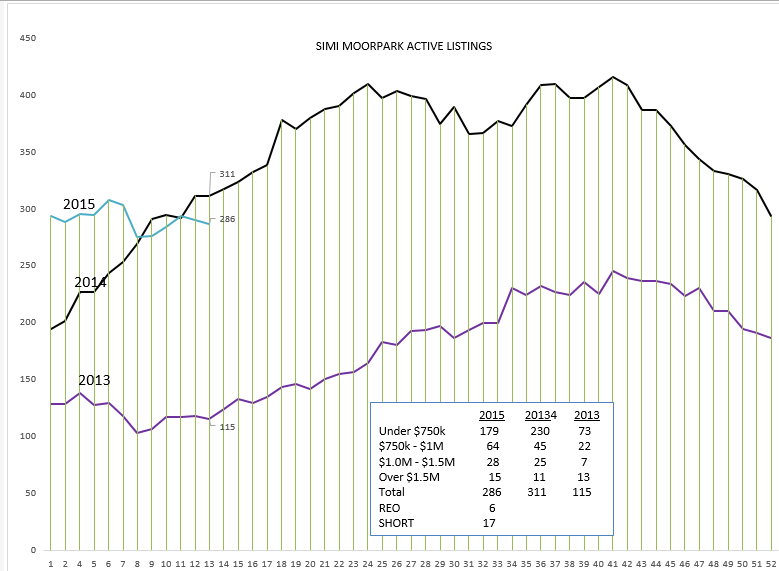
The inventory in Simi/Moorpark is behaving a little differently It is at about the same level as last year, but prices are higher, pushing some homes into the next higher price category. 2013 was a year of dire shortage, forcing prices at that time to rise substantially. This year, the inventory started out quite a bit higher (see the box in the chart) but notice how the slope of the line is changing, basically decreasing or flat at best.
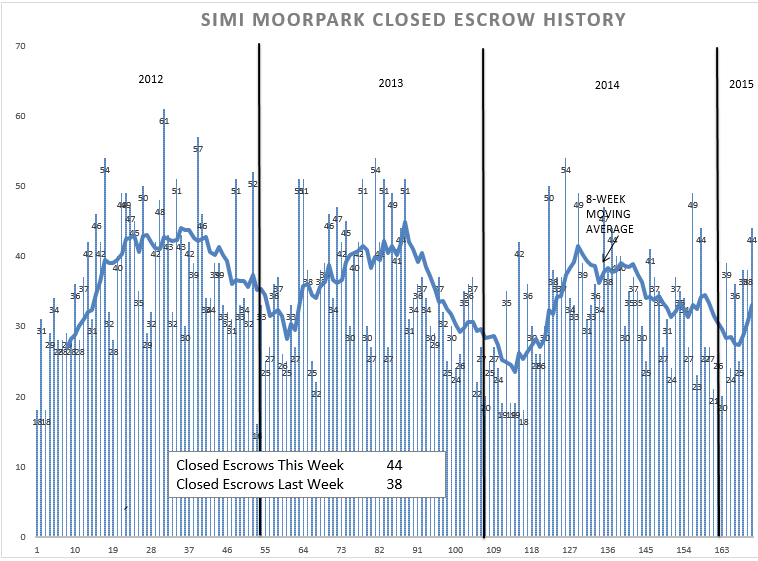
Wondering why? The answer is in the closed escrow chart. See how it compares to last year.
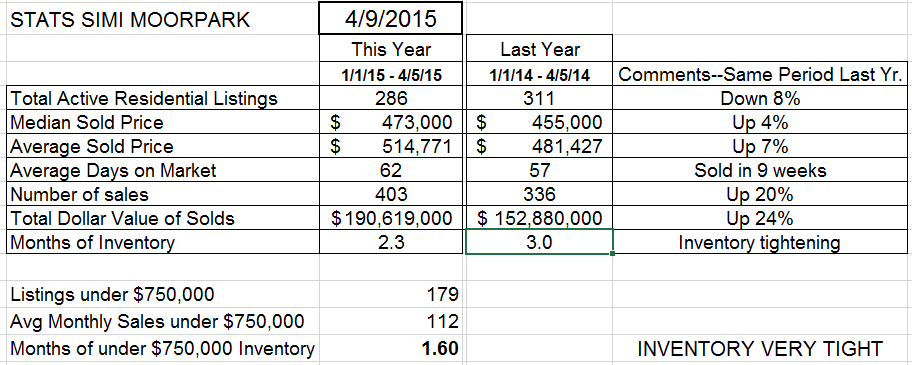
Compare the chart of closed escrow with the same chart a year ago. Sales are extremely strong, 20% higher than last year. This has reduced the number of active listings, and I can’t think of a better way to decrease the number of active listings. Last year, sales started off very slowly. This year, a different story.
Note the final figure in the list above. Due to low inventory and high sales, the inventory of homes for sale in Simi/Moorpark priced below $750,000, the bread and butter of Simi/Moorpark sales, represents only 6 weeks worth of inventory. The market is strong, the inventory is low, so look for price increases to start exceeding the 4% currently registered year-to-year. Unlike Conejo, selling prices are 99% of listing prices, very little discounting.
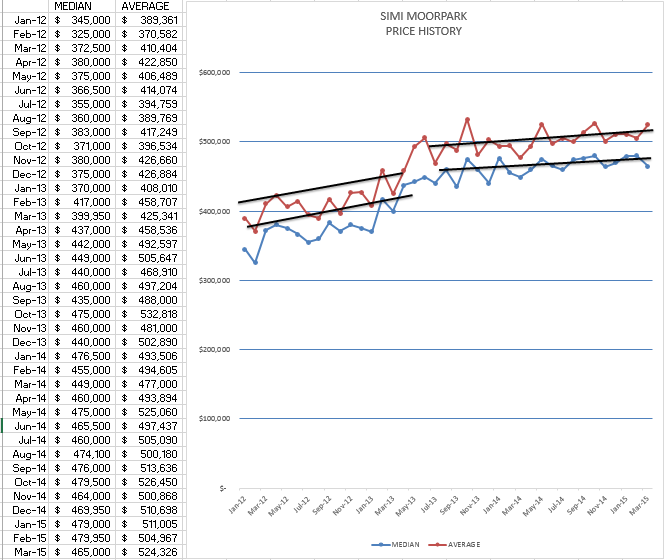
Prices continue to climb steadily, but with all the above factors, prices should be seeing a solid bump.
Overall, the market is strong, prices are on the increase, inventory is low, sales are equal to or much better than last year.
I hope you are seeing this strength in your business.
A final note. If you want to read the best blog of how to handle multiple offer situations, read Tim’s blog at http://www.1000oaksrealestate.com/2015/04/handling-multiple-offers/
Have a prosperous week.
Chuck
