We had one property sell last week with 7 offers. 5 of those offers were from flippers.
30-40 years ago, our area had a lot of construction going on. Some were developments by major builders, some were 1-5 units done by individual, smaller developers. They built homes from scratch. The bought a lot, went through the tedious process of getting approvals to build, usually got a bank loan for the life of construction, and in the end sold the home. This process often took two years.
There are very few vacant sites remaining, and most local governments have rules limiting development.
So what is the contractor to do?
The 30-40 year old homes are in need of remodeling. Remodeling has been done piecemeal by some owners, improving their properties and enjoying the benefits of a newer home. This has raised the average price in some areas, but there are now two price levels, original although well-maintained, and remodeled.
The price difference has attracted flippers. Sometimes these contractors have a poor reputation, as they tried to take advantage of higher tier prices by cutting quality with shoddy workmanship. But a good flipper can take an original home in a good neighborhood, do quality work to bring it up to today’s design, and get repaid for their work in a fairly short amount of time, a few months rather than the years required as a builder.
Flippers also help the market, taking the original properties off the market and replacing them with much improved offerings. This process is raising the average price in a neighborhood, and creating a stir as homeowners see the benefits of upgrading their properties.
The market is made up of a number of segments, and we have been missing the flippers for some time. They are back.
The overall market has been performing well. Let’s take a look at the statistics to back up that statement.
Inventory has been rising. Two years ago, we were limited by low inventory, and could have sold more houses if we had them to sell. Last year we had them to sell, but the buyers were holding back. This year, we have the combination of available inventory and buyers wanting to buy.
CONEJO VALLEY
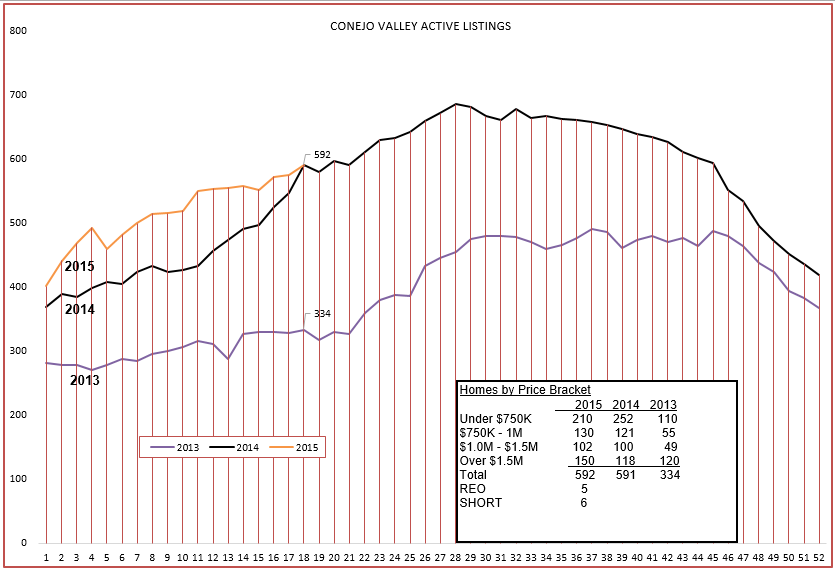
The inventory is almost exactly the same as it was last year. You can see how much lower it was in 2013. REOs and Short Sales have all but disappeared. There will always be a few around, but they are the exception, not the rule. The high priced inventory has increased strongly, and is selling well. Since the inventory is the same, we need to compare how sales (closed escrows) have been going.
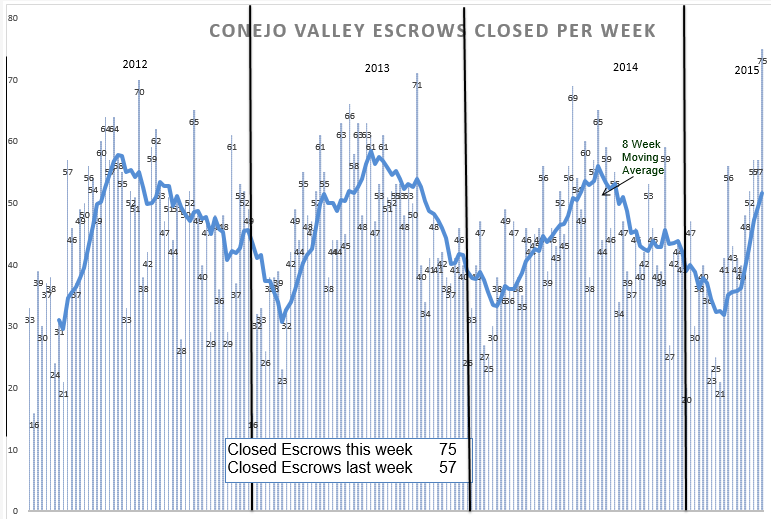
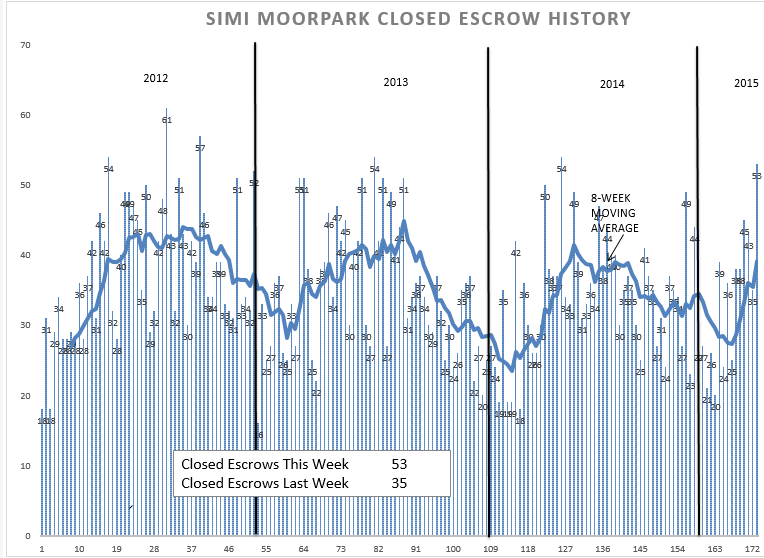
Last week recorded the highest number of closed weekly escrows in the past four years. We always experience a lull due to the end-of-year holidays, but compare the slopes (how fast they are rising) for 2014 and 2015. One could say “sales are taking off”.
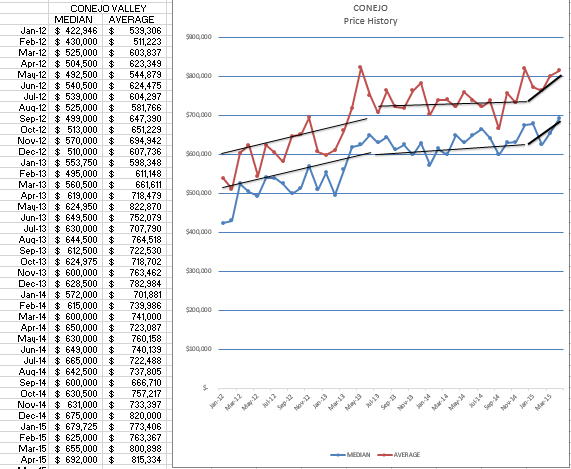
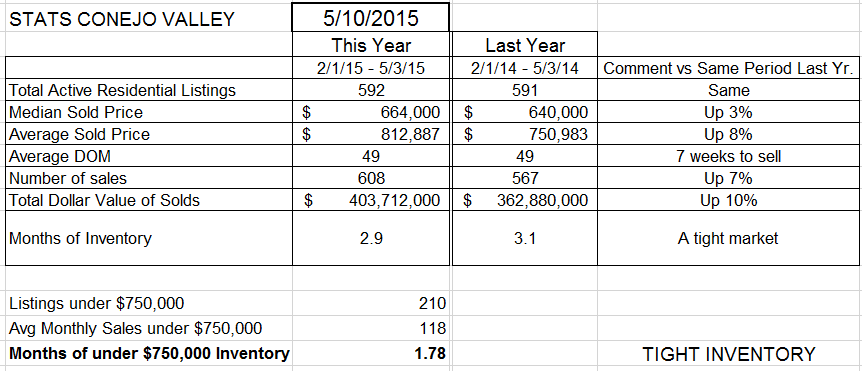 Sales, in units, are up 7% compared to a year ago. And prices are up, but the numbers can be confusing. Median prices are up 3%, while Average prices are up 8%. (I ran them twice, no mistake.)
Median is the price of the home based on units, not price. If there were 100 homes sold, and you arranged them in order from highest to lowest, the #51 home price would be the median price.
Average is total of all the sales prices divided by the number of homes sold. It is based on price, and can change drastically with by a high number of very low priced homes or a high number of very high priced homes.
If we sold 10 homes at $500,000 each, the median and the average would be $500,000. If we added one home at $480,000, and one home at $2,000,000, the median would not change, but the average would increase.
This anomaly means we are selling a lot of higher priced homes. The total dollar value of all the homes sold is up 10%. It is probably up higher than that, as I have not changed the way I have been computing the total dollar value.
With a strong market, we should see prices increase. According to the chart above, they have been, dramatically.
The market is strong. Not runaway racing-towards-an-accident out-of-control strong, but strong,
SIMI VALLEY MOORPARK
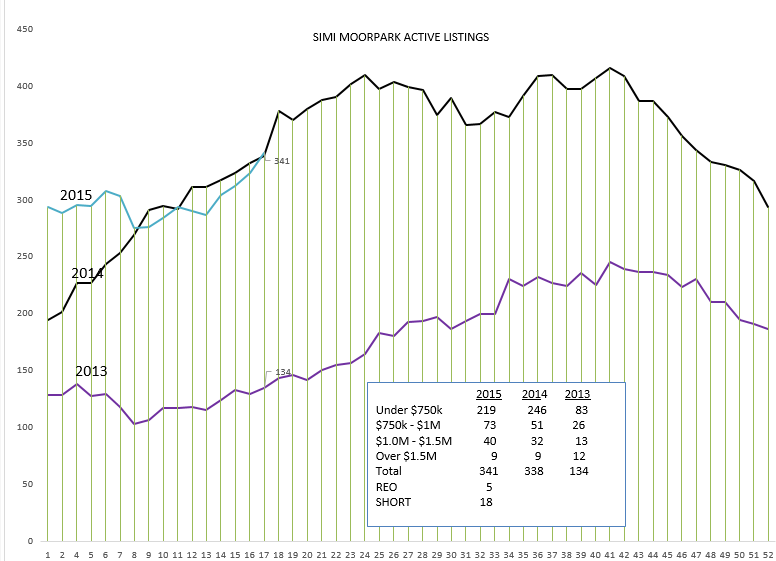
The inventory in Simi Moorpark has taken a lot of twists and turns, but has ended up, just like Conejo, at close to the same level as this time last year.
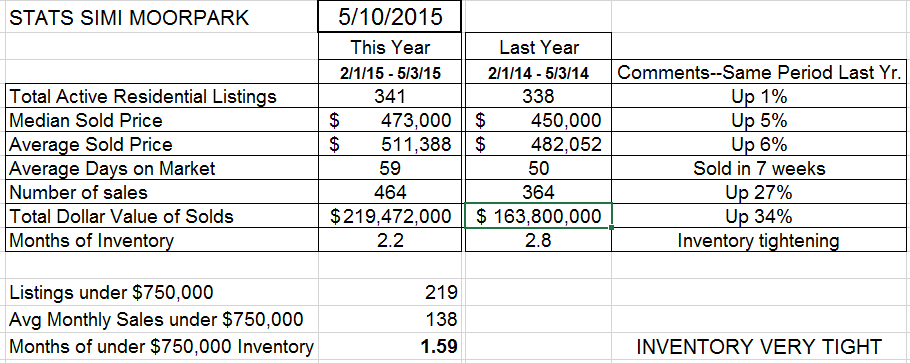
Notice we have more short sales than Conejo, but not a significant number, only 5% of the total listings. 2015 and 2014 have reached the same point, but 2013, the year of inventory shortage, was only about 1/3 of the inventory we have now. High priced homes are not the factor in Simi Moorpark as they are in Conejo.
Note that 2015 began with a much higher activity level than 2014, and is also very strong. Let’s look at the actual numbers for the last three months of 2015 versus the same period of 2014.
Inventory the same, both median and average priced up 5-65, and number of sales up 27%.
The number of sales are up 27% compared to last year. Wow.
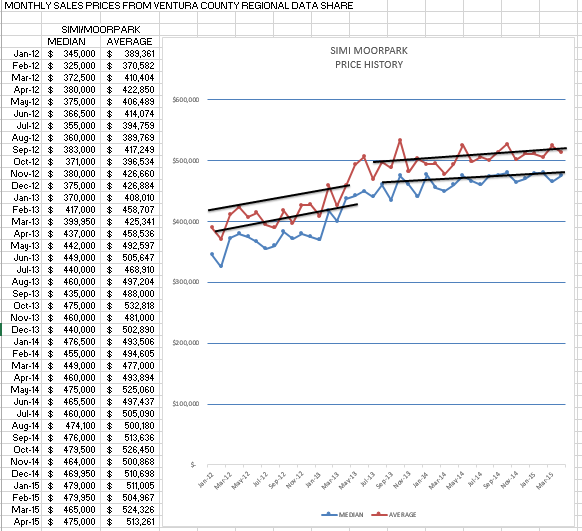
The price chart for Simi Moorpark is below.
Solid, consistent increase all year for the past year.
Did I mention the number of escrows increased by 27%?
Yes, the market is healthy, the market is strong, and not out of control.
Enjoy. This is a lot easier to write about than the past 7-8 years.
Chuck
