Goldilocks economy is being used by everyone to describe our current market.
2013, we could have sold more, but we did not have enough inventory.
2014, we had the inventory, but not the buyers.
2015, it has all come together.
As the economy was recovering, the housing sector was noticeably absent. Even with incentives for first time buyers and historically low mortgage rates, housing never fully recovered with the rest of the economy.
Until now. Now it has recovered. We have three years of good market conditions. Two years ago, we did not have enough inventory to satisfy the buyers, so prices went up, 27%. The number of sales compared to the previous year declined 6%. We did not have enough inventory to sell, and competition for the inventory caused prices to increase strongly.
Last year we had the inventory, but the buyers became cautious because prices had risen too rapidly, and sales were down. California prices rose 10%, but the number of sales declined 8%.
This year we have the inventory, we have the buyers, interest rates remain fabulous, consumer confidence is high, unemployment is low, and the future looks good for the economy. We have been recovering slowly and steadily, and that portends well for the future. We don’t like the word “bubble”.
How does our business this year compare with the same 3-month period last year?
CONEJO VALLEY
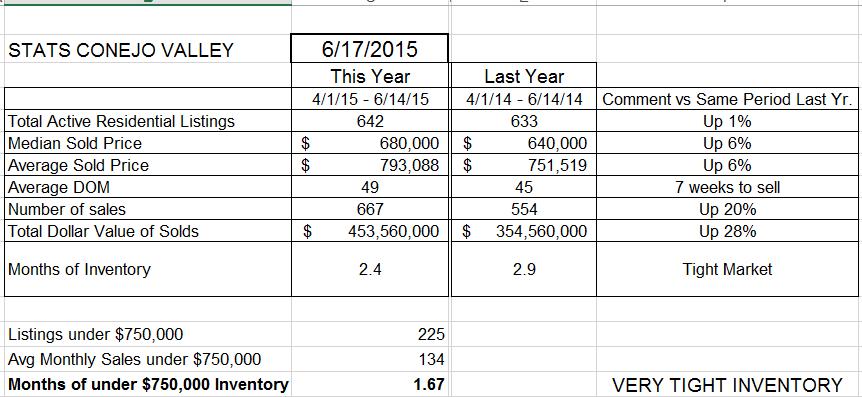
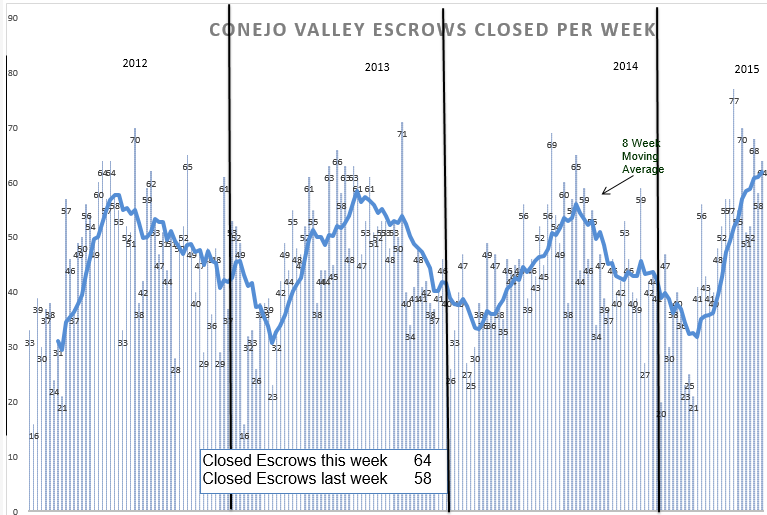
The biggest change is the rise in the number of sales, up 20%. Graphically, this is how sales compare for the past three years.
When you look at the graph, and the upward slope of the 8-week moving average, you get a sense that sales are up. But from the numbers, up 20%. A significant rise. What could slow that down? Prices. If sales are very strong, they usually eat up the inventory, and with a low inventory and high demand, prices rise. How does the inventory look?
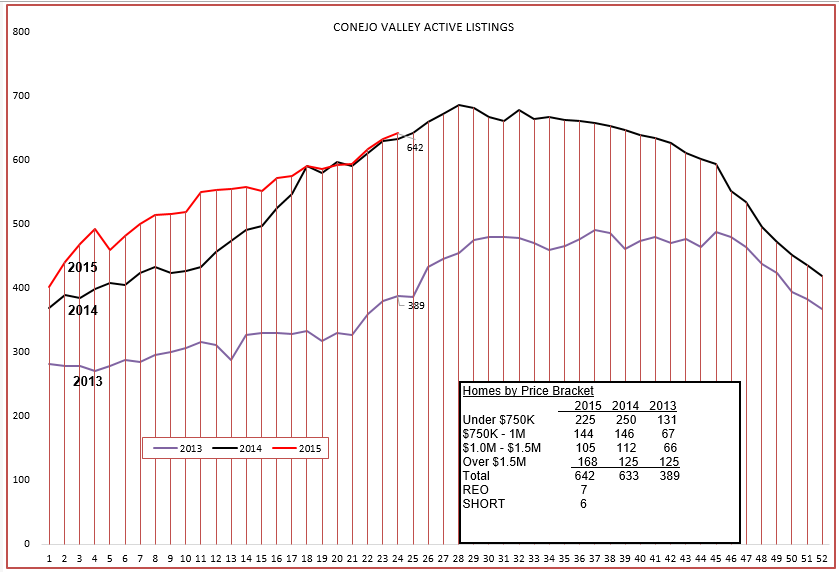
With listings up only 1% from a year ago, there is a reasonable amount of inventory. For comparison, look at the numbers on the box to see how the inventory compares over the last three years. You can see that 2013 was EXTREMELY low. That is why prices went up so much in 2013.
Today’s prices are up 6% from a year ago. A nice, solid increase, but not the size of increase that influences buying and selling decisions, not the type of increase to throw a wet blanket on demand. If prices are rising slightly, closer to the general rate of inflation, that describes a balanced market. Inventory is low based on weeks of demand, and that provides some strength to pricing. But currently, everything is in balance.
SIMI VALLEY/MOORPARK
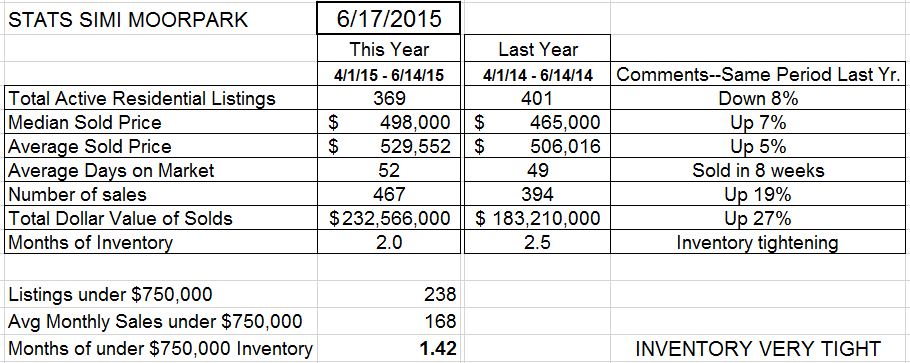
Similar in all respects as in Conejo. The biggest rise is in the number of sales, up 19%. A significant rise compared to the same 3-month period last year.
This graph does show the increase, but I have to admit that between 19% and looking at the graph, I am more impressed with the 19% figure.
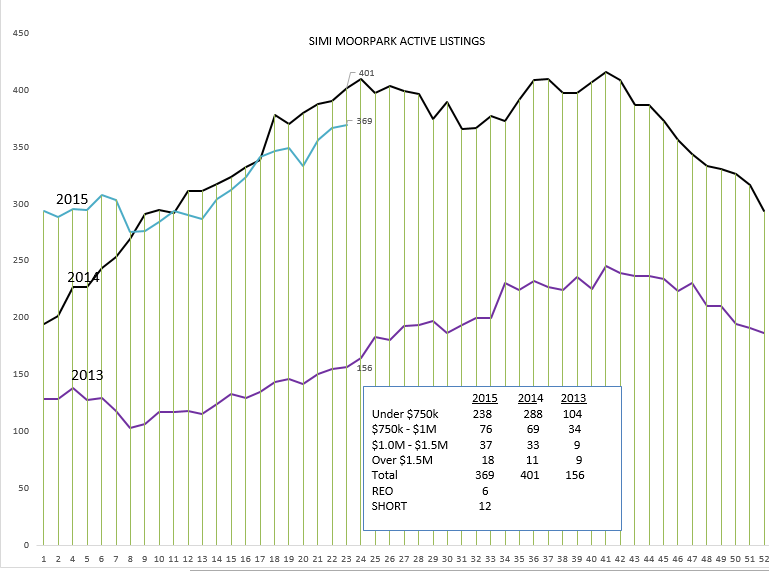
This chart makes me wonder if my hand was shaking when I drew it. (I know, the computer drew it, but it does look a bit weird.) However, look at the difference between the actual inventory numbers in 2013 and the inventory today. 156 versus 369. We have more than twice the inventory as two years ago, and 19% more sales than last year. Things have gotten into balance. That is evidenced by prices, the third component of supply-demand. Up about 6%. However, with the inventory this low as measured by months of supply, the market is strong and prices are well supported.
What to tell your clients? The market remains very strong, yet balanced. Prices are firm, and rising. The housing market has become a strong sector in support of the economy.
Have a fabulous week.
Chuck
