August for me is a time of change.
My birthday is in August, so I start a new year. A second chance at New Year Resolutions, a time of change.
August is also a time of change for the real estate market. The inventory starts to decline, sales activity begins to decline.
It’s normal.
It’s August.
Let’s see if the graphs are following my thinking about August.
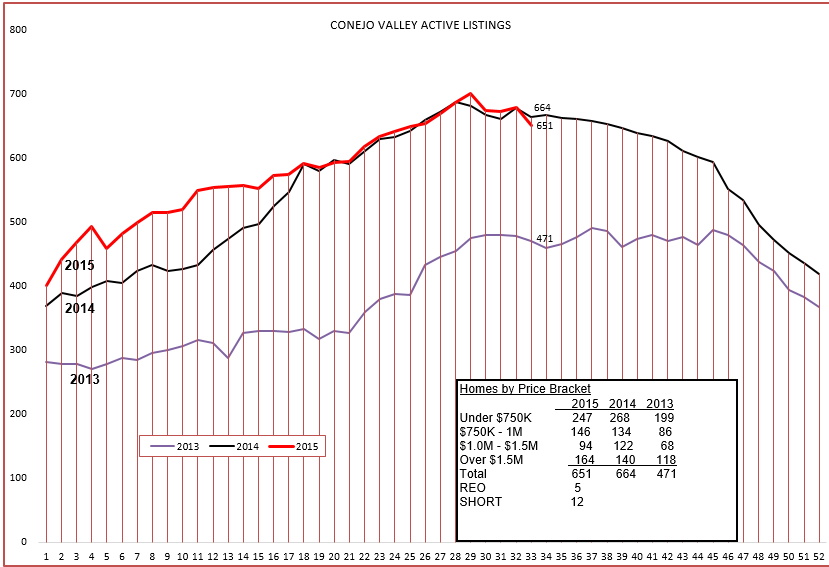
Almost exactly on target. At this point, one is tempted to draw a dotted line to the end of the year and forecast where we will end up. But no, I will leave that one to the professional economists. Enough to say we the inventory is behaving exactly as we would expect it to.
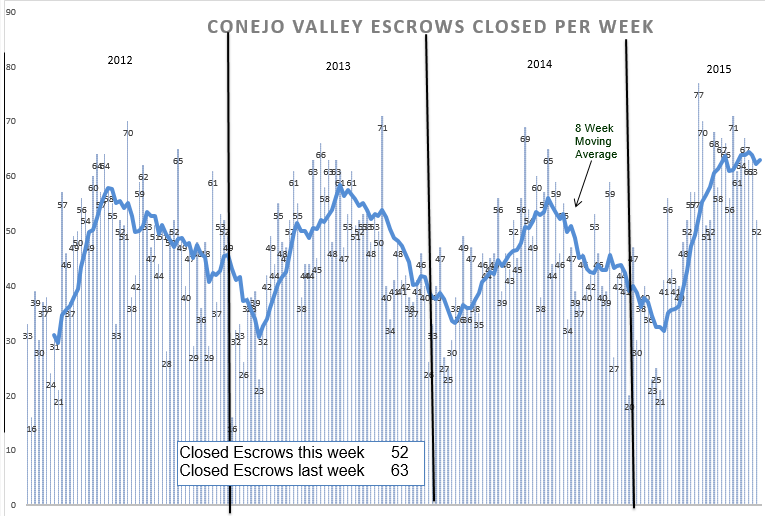
You can see it has been a good year so far, a very strong year. The number of sales are up 12% versus last year. But that number has been dropping a little. Up 12? Still strong in anybody’s book. What are the dynamics for continuing the strong market? We have to combine the two graphs above to see how long the inventory will take us, based on our sales volume.
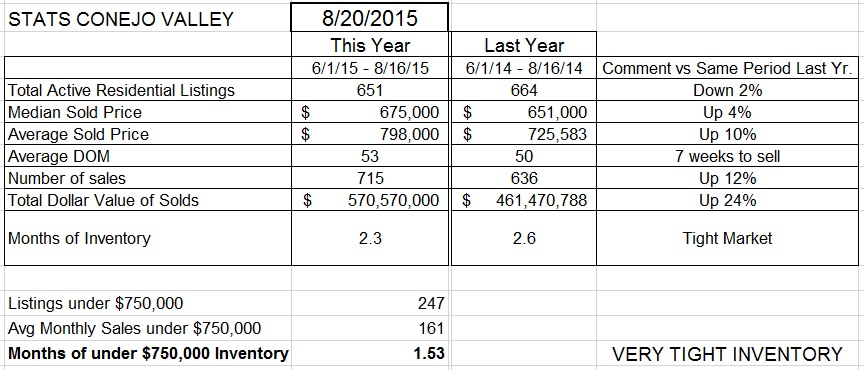
Compared to last year at this time (only three months of last year compared to our most recent three months) the inventory is down 2% and behaving as expected, the number of closed escrows is up 12%, and the most interesting statistic for our industry is that dollar sales are up 24%. I compute that figure using the average sold price, not the median. There is a huge difference between the median and average prices, $120,000, a much larger difference than last year. That indicates that there are some very expensive homes are being sold, raising the average but not the median as much. For example, let’s say an estate sold for $25 million. That would influence the average price a great deal, but as it is only one home, the median would probably stay the same. The median price is the price at which half of the homes sell above, and half of the home sell below.
Perhaps the most important figures to look at is Months of Inventory. Nationally, we consider months of inventory to be about average at 6 months worth of inventory. For us, it is closer to 3-4 months. Our inventory consumption is very low, extremely low when you consider the homes in the under-$750,000 category, only 6 weeks worth of inventory. And that is the category in which Simi Valley/Moorpark experience the highest percentage of their sales. Let’s look at the inventory history in Simi/Moorpark.
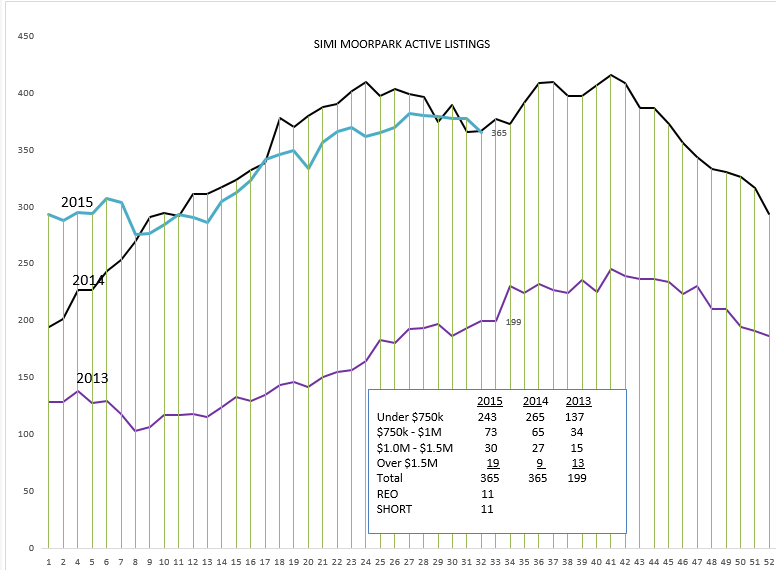
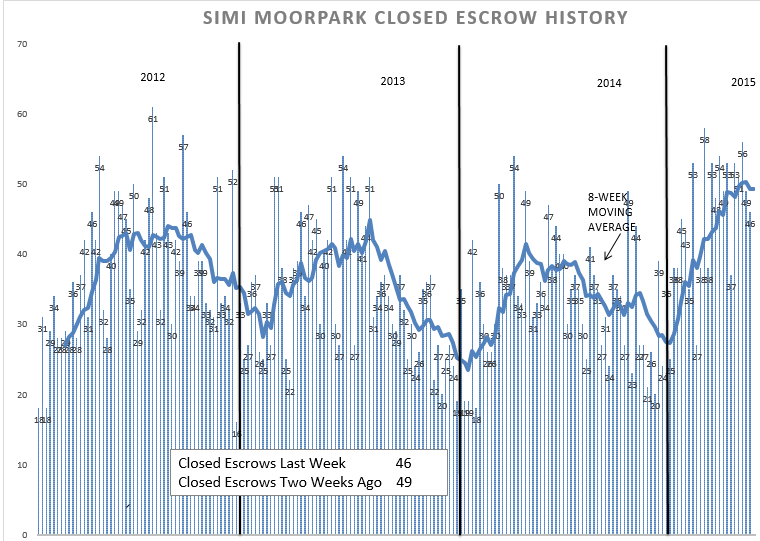
In Simi/Moorpark the inventory is generally following 2014, but has a little different story than 2014. The graph of closed escrows is also similar to Conejo, but not a copy. (I was going to say carbon copy. Many of you probably don’t know what a carbon copy is.)
2012 – 2014 was pretty consistent for the Conejo, but last year saw a bigger dip for Simi/Moorpark. They are making up for that this year.
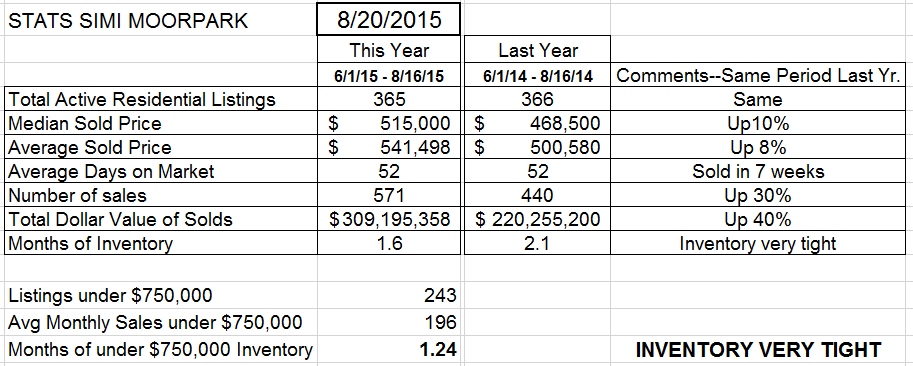
Inventory—the same number as last year.
Median sold price—up a very strong 10% The average is slightly lower at 8%. Not as many high dollar homes sold versus last year.
But check out the number of sales. Up a phenomenal 30%. Add that to the price increase and the total dollar value of real estate sold in Simi/Moorpark is up an unbelievable 40%. Why? First, Simi/Moorpark is a great place to live, as is the Conejo. But the average price in SImi/Moorpark is $250,000 more attractive. And that is attracting more buyers, and probably more investors.
How do we compare to the rest of the country? The figures out of Washington today announced a volume increase of 10.3% over a year ago, with ten consecutive months of year-over-year increases. Median prices for all housing types in July was $234,000, a 5.6% increase over a year ago.
First time buyers are the most talked about in forecasts. They have been late to the party. Millennials are older than their predecessors when they buy their first house. But many are forecasting the wave of first-time-buyers is coming, and that will add impetus to the strong market in real estate we are already experiencing. It all starts in the lower price ranges and works its way up.
Feel confident? I could tell you about the difficulties in Greece, the devaluing of the Chinese Yuan, the plunge in the stock market. When you read the news, you get concerned by the bad news. And the news media loves bad news. It sells. But there other forces supporting our housing market. Rental rates are so high that some are paying 50% of their income for housing. That makes h0me purchases look very affordable by comparison. We are way behind in building new housing, there is a shortage, which is why rents are so high.
But that discussion deserves a book. This is merely a blog. Hope you enjoyed the information.
Have a prosperous week.
Chuck
