The stock market—down 10% in one week?
The oil market—25% up in one week?
China—1/3 value lost in one month?
Housing—hoping not to get burned by everything else going on.
People do not day-trade in housing. It is not only an investment, it is where you live, it is how you live.
The three areas above have been hugely active for the past few years. Huge profits, then huge corrections.
Unless you believe we have another bubble, and I do not, then housing remains reasonably stable. Certainly comparatively stable.
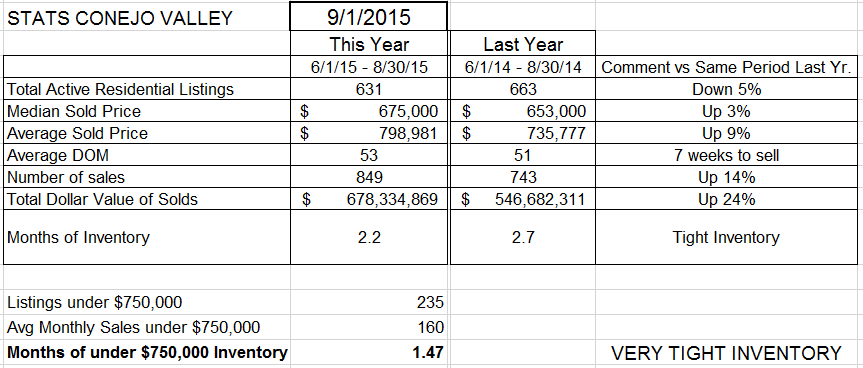
Let’s begin by looking at the table of important information. If you are an agent, these numbers should be at the tip of your tongue.
Inventory is lower than last year (5%), but prices are still increasing (6% from last year). What is up dramatically is the number of sales, up 14% compared to last year. And the inventory is very tight, only two months worth of sales, and even tighter for homes in lower price ranges.
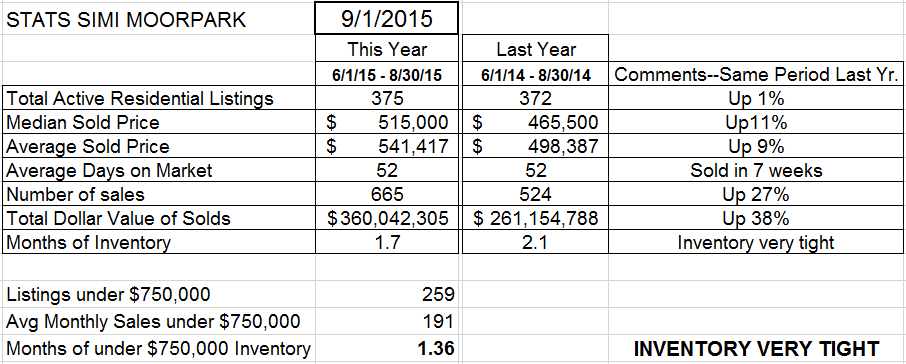
Let’s see how that explanation sounds with Simi/Moorpark numbers.
Inventory is about the same as last year, but prices are still increasing (10% from last year). What is up dramatically is the number of sales, up 27% compared to last year. And the inventory is very tight, less than two months worth of sales, and even tighter for homes priced around $500,000.
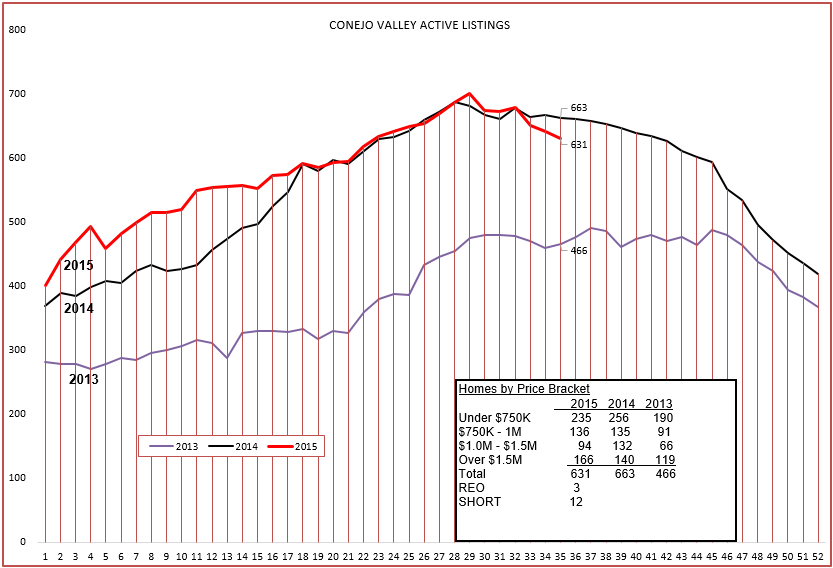
Nothing indicates that things will be changing any time soon. To get a picture of the above numbers, let’s first look at the inventory.
No surprises here, the inventory usually declines this time of year, and it seems to be declining faster than it did last year at this time. One thing to note is the number of bank owned properties (only 3) and short sales (only 12). There will always be some in this category, but these numbers are miniscule.
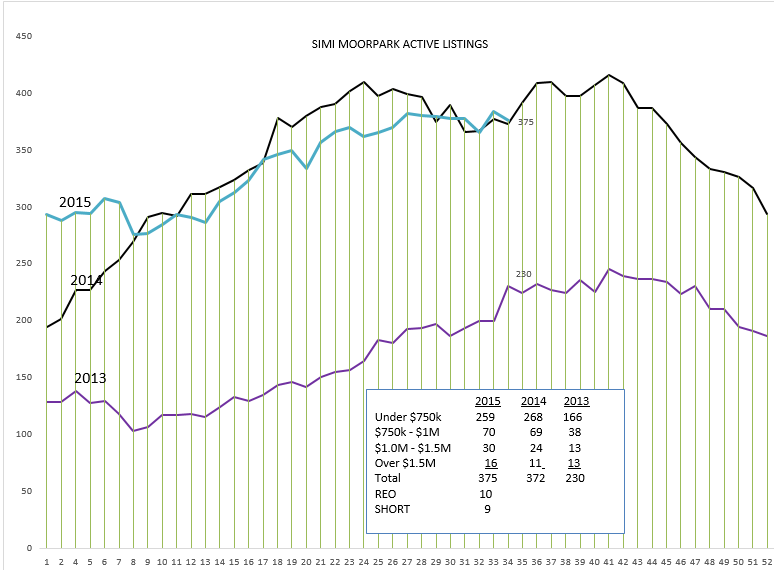
Same thing for Simi/Moorpark. The inventory remains tight, well under control. Homes continue to sell for full list price. REOs and Short Sales remain under control. The low inventory and high sales is generating a price increase 10% above the same period last year.
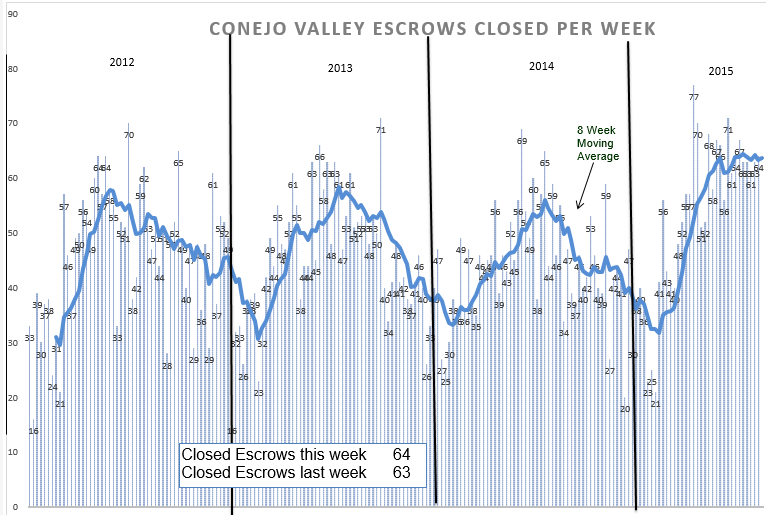
Next, we look at closed escrows. Remember, these are an indication of what the market was like 6 weeks ago.
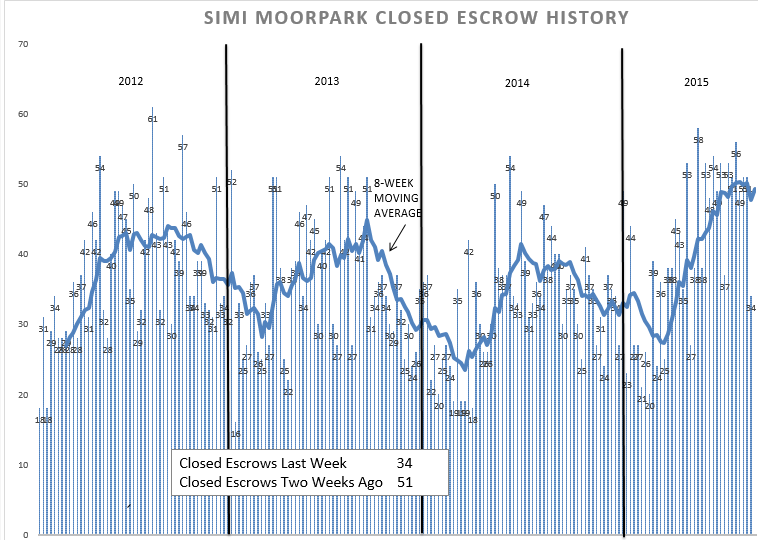
It has been an outstanding year, with the number of sales up 14%. Think that is a hot market? Look next at Simi/Moorpark.
The year started out slow (the white spaces under the 8-week average line), but it has come on strong and, based on a comparison to the same 3 months of last year, is up 27%. It would have been very optimistic to forecast that increase a year ago. Low Supply and high demand yields price increases. Let’s look at those increases in chart form.
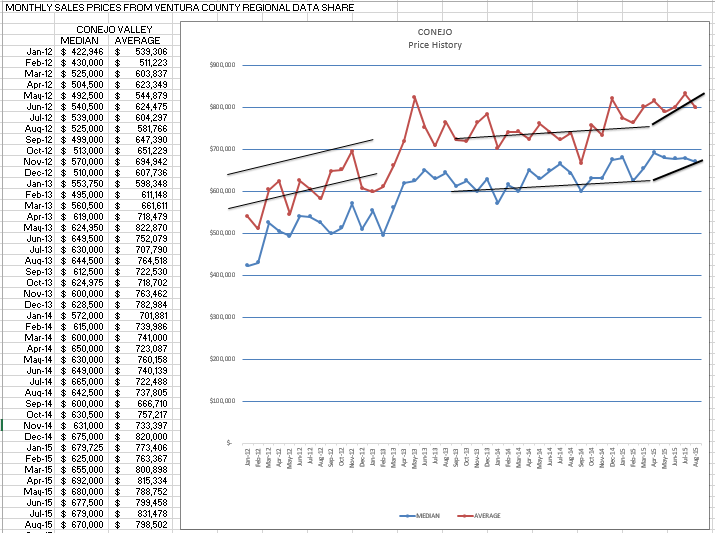
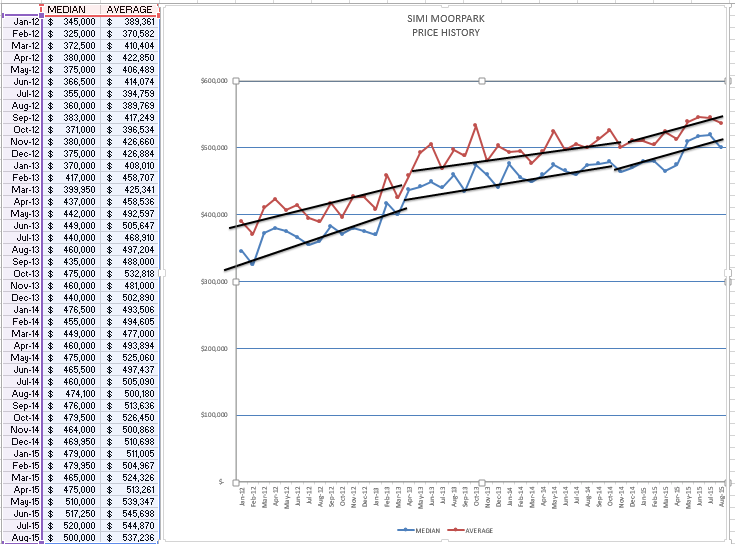
There was a huge increase at the beginning of 2013, then things flattened out through 2014. 2015 has seen a decent increase, inflation of about 6%. Price increases have been stronger in the lower priced homes (under $750,000) than the higher priced homes. Even the Fed would be happy with that number. But how about Simi/Moorpark? Most of their inventory is around $500,000, and their inventory has been tighter.
You can see the results of a 10% price increase. Simi/Moorpark has had steady increases for the past few years, even after the big jump in the beginning of 2013.
Our market is alive and well, steady and maybe a little boring compared to the stock market, the oil market, and China.
In this instance, I really like boring. Let’s stay that way.
Have an excellent Labor Day Weekend.
Chuck

